October 2011
Do Powerful CEOs Determine Microfinance Performance?
Rients Galema
a
, Robert Lensink
a,b
*, and Roy Mersland
c
a
Centre for International Banking, Insurance and Finance (CIBIF), Faculty of Economics and Business, University of Groningen, the Netherlands.
b
Development Economics Group, Wageningen University and CREDIT, University of Nottingham, UK. c
University of Agder, Norway
*Correspondence: Robert Lensink. Faculty of Economics and Business, University of Groningen, PO Box 800, 9700 AV Groningen, the Netherlands; telephone: +31-50-363-3712; fax: +31-50-363-8252; email: [email protected]
Acknowledgments. The authors thank the participants of a Microfinance Workshop (University of Agder, Norway, August–September 2009), the First European Research Conference on Microfinance (Center for European Research in Microfinance, Belgium, June 2009), Corporate Finance Day (University of Antwerp, Belgium, September 2009), and the seminar of the Institute for Economics, Econometrics and Finance (University of Groningen, the Netherlands, November 2009). They particularly thank Aljar Meesters for providing advice on econometrics and programming; Rob Alessie for suggesting quantile regression; and Hans van Ees, two anonymous referees and the editors of this special issue of JMS for very useful comments.
Abstract
Recently, microfinance is coming under public and media attacks. The microcredit crisis following from microfinance-induced suicides in 2010 in the Indian state of Andhra Pradesh indicates that weak corporate governance and imprudent risk taking have far-reaching consequences. Yet, analyses of corporate governance mechanisms among microfinance institutions (MFIs) remain underdeveloped. As a response, this study examines the impact of CEO power on MFI risk taking by deriving explicit predictions of this effect from a characterization of the microfinance industry. Based on a sample of 280 microfinance institutions, our results suggest that powerful CEOs of microfinance nongovernmental organizations (NGOs) have more decision-making freedom than powerful CEOs of other types of MFIs. This induces them to make more extreme decisions that increase risk. Furthermore, the decision-making freedom powerful CEOs have in NGOs appears to lead to worse decisions, because the presence of powerful CEOs in microfinance NGOs is associated with lower performance.
3
INTRODUCTION
The literature on corporate governance and its effects on firms and commercial banks has grown quite voluminous, yet analyses of corporate governance mechanisms among microfinance institutions (MFIs) in developing countries remain underdeveloped and inconclusive (for a review, see Labie and Mersland, 2011). More generally, while our knowledge of strategic management and in particular governance has increased considerably, little research has been conducted outside the US and the UK (Elbanna and Child, 2007), let alone in developing countries. The minimal attention to the role of corporate governance in MFIs is unfortunate though, because MFIs serve hundreds of millions of poor and vulnerable people, and ultimately, governance systems may explain why some MFIs succeed while others fail (Armendáriz and Morduch, 2010). According to CSFI (2011), corporate governance quality constitutes a key risk for MFIs and the vulnerable customers they serve, especially because the best practice governance mechanisms seem not to have penetrated these areas (Hartarska, 2005; Mersland and Strøm, 2009). And yet still the majority of explanations of MFI performance continue to focus on innovative contract designs (Armendáriz and Morduch, 2010). When research does consider corporate governance in MFIs, it cites relationships between different governance variables and MFI performance. No study deals with risk analysis, though risk taking remains critical to decision making, with important implications for MFI performance and survival.
Furthermore, microfinance is coming under public and media attacks. As if in a backlash to widespread praise (e.g., United Nations declaring 2005 the Year of Microcredit; the Nobel Peace Prize awarded to Mohammad Yunus and Grameen Bank in 2006), microfinance is being strongly challenged. Is the provision of tiny loans actually an effective means to lift poor people out of poverty? Do MFIs charge overly high lending rates and practice heavy-handed collection methods? The microcredit crisis following from microfinance-induced suicides in 2010 in the southern Indian state of Andhra Pradesh
4
indicates that weak corporate governance and imprudent risk taking have far-reaching, dramatic consequences.
In response, this study examines the impact of CEO power on MFI risk taking by deriving explicit predictions of this effect from a characterization of the microfinance industry. We thus expand on work by Adams et al. (2005) and Pathan (2009), who examine the relationship between CEO power and risk taking for publicly traded firms and commercial banks in the United States, respectively. Although MFIs are financial institutions, they differ fundamentally from commercial banks, mainly in that they pursue financial objectives together with social objectives and aim to reach the poorest customers possible. Moreover, most MFIs have distinctive ownership, in which profit-driven investors do not play primary roles. Thus managing an MFI may be more similar to managing a hospital or school than a commercial bank.
Although a few MFIs are transforming into regulated, shareholder-based financial institutions, the majority remain driven by their social aims (Armendáriz and Morduch, 2010), particularly those that function as nonprofit, nongovernmental organizations (NGOs). These MFIs have no shareholders and lack high-powered equity ownership incentives, which likely discourages stakeholders from executing control rights. Moreover, no takeover market exists that might exercise external controls on management or the board of microfinance NGOs.
The combination of weak governance and complex pursuits of both financial and social objectives has important consequences for MFIs’ risk profiles and the ways CEOs might influence MFI policy. Adopting the theoretical framework proposed by Adams et al. (2005), we argue that MFI managers in microfinance NGOs have substantial managerial discretion, such that CEO power should increase risk taking. To test this hypothesis empirically, we use two tests: a heteroskedasticity test (Adams et al., 2005; Cheng, 2008; Pathan, 2009) and a linear regression of the standard deviations of MFI performance over time based on CEO power and several controls. Our results contrast with those from prior
5
research (e.g., Pathan, 2009), which confirms the difference between microfinance NGOs and commercial banks in terms of CEO discretionary decision freedom. In addition, using quantile regressions, we show that the presence of powerful CEOs in microfinance NGOs not only induces more variable performance but is also associated with declining performance.
Our findings thus call for stronger governance mechanisms for microfinance NGOs, whether through improved self-regulation or with stricter external oversights. Our analysis also reaffirms the appeal of transforming microfinance NGOs into regulated, shareholding, financial intermediaries.
MICROFINANCE CONTEXT AND HYPHOTHESES
In this section we provide a characterization of the variety of financial institutions that perform microfinance activities. From this characterization we draw on organization theory to argue that NGOs allow microfinance executives the most managerial discretion, such that CEOs are most likely to be able to influence outcomes in NGOs. To influence outcomes, a CEO also needs a sufficient degree of power. Power is a person’s ability to force another person to do something he or she otherwise would not have done (see Dahl, 1957). Thus power is a relational construct, and the exercise of power is in relation to others who may resist (Adams et al., 2005). Because the impact of powerful CEOs is likely to be higher in environments that provide greater discretion (Adams et al., 2005), we hypothesize that powerful CEOs increase NGO risk.
Special Features of Microfinance NGOs
Any characterization of MFIs is complicated by the variety of financial institutions that perform microfinance activities, including commercial banks, credit unions, nonbank financial institutions (NBFI), and nonprofit organizations (e.g., NGOs) (Jansson et. al., 2004). As we noted previously, some MFIs are even transforming into regulated, shareholding, financial institutions, similar to commercial banks. The most common provider of
6
microfinance though is still socially oriented NGOs that provide microcredit to small informal entrepreneurs (Christen et al., 2003). We focus on these microfinancers; in Table I we also provide a typology of MFI forms, ranked according to the extent of managerial discretion they allow. Finkelstein and Hambrick (1990) use the concept of managerial discretion to explain why CEOs either do or do not affect firm performance and strategic decisions. Hambrick and Finkelstein (1987) define managerial discretion as the “latitude of action in making strategic choices.” That is, discretion is the level of freedom or constraint faced by a CEO (Finkelstein and Hambrick, 1990). It refers to a multidimensional concept that reflects the range of options available to an individual when taking consequential action (Caza, 2011). Executives with more freedom to implement decisions and relatively fewer constraints significantly shape their organizations; those with greater constraints and less freedom are less able to do so (Finkelstein and Hambrick, 1990). We predict that especially in microfinance NGOs, CEOs have great managerial discretion.
[INSERT TABLE I ABOUT HERE]
We distinguish microfinance NGOs from normal commercial banks, NBFIs, and other banks particularly in terms of their (1) aims; (2) activities; (3) client features, loan portfolios, and lending technologies; (4) governance structures; and (5) operating environment. Despite some similarities between microfinance NGOs and credit unions/cooperatives in terms of aims and client features (see Table I), the financial transactions of cooperatives/credit unions usually are limited to registered members, such as those living in a certain region or working in a certain occupation (World Bank, 2005).
Aims: Dual Objectives
Microfinance NGOs pursue two often conflicting objectives: financial self-sufficiency and poverty reduction (Hermes et al., 2011). Commercial banks, NBFIs, and banks might claim to focus on social objectives as well, but ownership pressures (Mersland, 2009), their
7
financial structures (i.e., less donated capital, more commercial debt), and public regulations generally push these types of MFIs toward financial objectives. Furthermore, multitasking creates an incentive problem for managers, particularly if one of the goals is difficult to measure—“such as poverty reduction and female empowerment [which] are notoriously difficult to measure in a simple regular way” (Armendáriz and Morduch, 2010, p. 357).
Their mission—to reach the poor while simultaneously remaining financially sustainable—implies that executives of MFIs, especially NGOs, confront a situation in which it is not clear what is expected of them. The trade-off between financial sufficiency and poverty reduction implies that managers might justify their bad performance on one criterion by referring to the other; for example, their poor financial performance could be attributed to the social mission, especially because social performance is so difficult to measure. This problem is well known in multitask agency theory but difficult to solve (Holmstrom and Milgrom, 1991). Different CEOs disagree about whether to focus on financial stability or reaching the poor, and the lack of consensus might even enhance a CEO’s discretion. The CEOs of microfinance NGOs also have discretion over funds they receive from donors; if donor oversight is relatively poor, they may take advantage by investing in more high-risk projects.
Powerful CEOs could use the ambiguity over organizational objectives to determine the outcomes of strategic decisions. For instance, CEOs that are also chairman of the board or founded the NGO, and thus have high structural power (Finkelstein, 1992), could use their formal position to decide whether the NGO should focus more on financial or social objectives. Therefore, we argue that the dual objectives of NGOs are likely to increase the impact of powerful CEOs on organizational outcomes.
Activities
The range of operations of microfinance NGOs tends to be much broader than that of commercial banks and other types of MFIs. In line with their dual objectives, they provide not
8
just financial services but also various social services, such as business development, health care provision, or literacy training (Maes and Foose, 2006). Business development services include a broad range of nonfinancial services, such as management or vocational skills training; marketing and technical assistance; technology access; productivity and product design; accounting and legal services; and access to various information about standards, regulations, or ideas in an enterprise field. Social services integrate credit with health, education, or other programs intended to raise health consciousness, health practices, and the use of formal healthcare. The wide operating framework of microfinance NGOs thus creates an ideal environment for a CEO who wants considerable freedom in making strategic choices. Especially in combination with the dual objectives of NGOs, it is unclear on which sectors NGOs should focus. Therefore powerful CEOs could use the structural power awarded by their formal position (Finkelstein, 1992) to decide in which sectors the NGO is active.
Client Features, Loan Portfolio, and Lending Technology
In terms of their financial activities, microfinance NGOs normally provide only microfinance loans. In contrast with commercial banks, microfinance banks, and NBFIs, they cannot offer savings or time deposits. Credit unions/cooperatives provide savings possibilities and loans only to their members.
These distinctive client, lending technology, and loan portfolio features are interrelated and reflect the client characteristics of MFIs (Jansson et al., 2004). Loans normally are small and short-term, with relatively high interest rates, and they are not secured by collateral. The clients of microfinance NGOs tend to be low-income entrepreneurs, working in informal sectors, with no physical capital and limited formal documentation. Although clients are not inherently more risky than traditional bank clients, microlending activity as such may be, because it is so sensitive to management quality. Lending technologies use alternative incentive schemes, such as joint liability group lending or dynamic incentives, to encourage repayment. Moreover, normal banks consult formal documentation about clients before
9
granting loans, whereas microfinance NGOs usually do not evaluate loans based on formal financial information but instead rely on character and cash flow analyses during on-site inspections. The decision to grant a loan is mostly based on a field evaluation of the client’s ability to pay (Jansson et al., 2004), a credit rating procedure that is very difficult for outsiders to verify. The lack of formal loan approval procedures gives CEOs considerable freedom in deciding on lending technologies and credit rating procedures.
Governance Structure
Microfinance NGOs are mostly organized as associations or foundations, which do not strictly have owners but rather feature organizational donors who contribute start-up funds (Jansson et al., 2004). Their “ownership” structure is dominated by the nonprofit organizations that created the MFI, including international or national NGOs, governmental aid organizations, multilateral donors, and other development-oriented organizations. In contrast, microfinance banks and NBFIs may include nonprofit investors among their shareholders, but they also work with profit-oriented private investors and shareholders. Cooperatives/credit unions are owned and managed by their members, following a one person–one vote principle (World Bank, 2005).
Although best practices suggest that board members and the CEO should maintain some distance or independence, in many microfinance NGOs, the CEO/founder handpicks the board (Rock et. al., 1998), which may lead to a lack of proper oversight. A clear example of the problems that arise without proper oversight comes from the collapse of the Colombian microfinance NGO Corposol (Rock et al., 1998). The founder/CEO of Corposol initially enjoyed much respect and admiration for founding the successful MFI in 1988, leading to ownership and prestige power (Finkelstein, 1992). The CEO then increased his structural power by centralizing operational control and information, filling key management positions with friends, and marginalizing the influence of experienced middle managers. In 1995, consultants concluded that true autonomy existed only at the CEO level, with a management
0
team that served mainly as an “echo of his own ideas” (Steege, 1998, p. 89).
Donors to microfinance NGOs also have few personal incentives to monitor risk-taking behavior by the CEO, especially compared with profit-driven private investors and shareholders (Christen et al., 2003). This point is not to suggest that share-holding private investors do not engage in excessive risk taking; rather, in general, profit-driven investors seem to monitor management more closely than do social investors (Mersland, 2009). In addition, because microfinance NGOs are not listed on stock markets, decisions by their CEOs are not restricted by a takeover market that might exercise external controls.
Finally, perhaps the greatest distinction between microfinance NGOs and other types of lenders is the non-distribution constraint. In theory, this constraint should restrict CEOs from exploiting the latitude afforded by the absence of private owners, because the distribution of excess earnings is not allowed. It also should commit the NGO to not cheating donors, customers, and workers (e.g., Glaeser and Shleifer, 2001; Hansmann, 1980). However, in practice the non-distribution constraint creates considerable organizational slack, because any excess profits go back to the organization. Financial shocks cannot be absorbed by shareholders but rather get absorbed by employees (e.g., varying wages) or clients of the MFI (e.g., changes to the services they receive; Fishman and Hubbard, 2005). To reduce the adverse effects of shocks, firms that face the non-distribution constraint may require precautionary savings, such as endowment fund balances provided by donors. However, these funds also facilitate misuse by CEOs, which implies that the fund balance itself supports greater managerial discretion (Fishman and Hubbard, 2003). The non-distribution constraint is often weakly binding too (Brhlíková and Ortmann, 2006), allowing the CEO to invest in risky projects with a lower probability of success that deliver more perks (e.g., a nice office). Together, these weak governance practices are a source of managerial discretion in all areas of microfinance NGOs’ operations.
Two central features of the microfinance environment are the rapid growth of the industry in general and the relative lack of regulation, especially for NGOs.
Growth.
Whereas in the early 1980s, microfinance institutions served only a few million clients, they reached more than 190 million families in 2009 (Reed, 2011). This rapid growth appears likely to continue, considering the size of the underserved market: Up to 3 billion people still lack access to proper financial services. Such growth levels also afford MFI CEOs with considerable discretion, because good performance creates organizational slack, enhances the CEOs’ position in the firm, and institutionalizes the position of the CEO; boards are less willing to fire CEOs of well-performing firms (Finkelstein and D’Aveni, 1994). In addition, Bradley et al. (2011) show that in high-growth industries financial slack is associated with lower performance. So in high-growth environments powerful CEOs are especially likely to influence NGO outcomes.
Moreover, most MFIs are experiencing high portfolio growth on their own, prompting growth optimism, reinforced by past successes that have resulted in overconfidence and overly ambitious goals for many MFIs and their CEOs. The overconfidence (or hubris) of these CEOs also increases their risk taking (Li and Tang, 2010). An overconfident CEO overestimates his or her own problem-solving capabilities but underestimates the required resources and organizational uncertainties (Li and Tang, 2010). Consequently, CEO hubris, due to the enormous successes of microfinance, should strengthen the impact of CEO power on MFI risk taking.
Lack of Regulation.
Because the microfinance industry is a small part of the total financial sector, regulators can afford to ignore microfinance NGOs without endangering the stability of the financial system. In addition, in many countries, the formal banking industry is regulated by a central bank. Formal financial institutions take liquid deposits from the public and transform
2
them into risky, illiquid loans. If a bank suddenly must return deposits, it might lack the capacity if its funds all are tied up in illiquid loans, which prompts the failure of deposit-taking institutions. Central bank regulations attempt to mitigate such risk, but most MFIs only offer credit products and no savings, which exempts them from regulations. Without savings products or equity issues, NGOs primarily rely on (foreign) donor money. In addition, the lack of regulation, and thus weak oversight, implies that CEOs could be tempted to invest in risky projects that deliver more perks (Fishman and Hubbard, 2005). In general, the impact of CEO power will be greater in industries with minimal regulatory constraints (i.e., high environmental discretion) than in those with severe regulatory constraints (i.e., low environmental discretion). Thus, we anticipate that a lack of regulation strengthens the relationship between CEO power and CEO risk taking in MFIs.
Taken together, the special features of microfinance NGOs—in terms of aims, activities, lending technology, corporate governance, and environment—should widen the scope of CEO discretion. As Glaeser (2003, p. 2) puts it, “managers of non-profit firms … have an almost unmatched degree of autonomy.” Furthermore, a direct relationship emerges between CEO power and managerial discretion. If a CEO is powerful, he or she has more discretion to influence decisions. Moreover, the impact of the CEO’s power depends on the degree of managerial discretion he or she has. Just as managerial discretion moderates the impact of CEO power on firm performance, it moderates the relationship between CEO power and firm risk taking.1 Adams et al. (2005), for instance, show that the impact of CEO power on performance variability is more pronounced in industries with fewer environmental constraints but more managerial discretion. Especially in firms and organizations with high managerial discretion, CEO power thus should lead to risk taking; CEO power and performance variability relate positively. Therefore, we predict
3
Hypothesis 1: In microfinance NGOs, CEO power increases risk taking; CEO power and performance variability relate positively.
Powerful CEOs and MFI Performance
Although our main objective is to examine the relationship between the presence of powerful CEOs and risk taking in microfinance NGOs, we also provide evidence with respect to the impact of powerful CEOs on microfinance performance. In theory, CEO power could have positive or negative effects on firm performance (Finkelstein and D’Aveni, 1994); for example, it might encourage strong leadership and benefit incentive alignment. However, CEO power also could reduce the effectiveness of board monitoring and create a negative CEO entrenchment effect, which creates incentives for the CEO to extract private benefits.
Finkelstein and D’Aveni (1994) propose a framework to integrate these opposing views: The negative effect dominates when the risk of entrenchment is high, such as when the CEO’s informal power is high or the firm performs well. Until quite recently, MFIs have earned nearly constant praise for their ability to reduce poverty in a financially viable manner. This positive reputation may increase the risk of CEO entrenchment. The risk of negative entrenchments effects also should increase if the possibilities for managerial discretion are high, as we have proposed they are in microfinance NGOs. In particular, the weak monitoring system, absence of profit-driven investors, and non-distribution constraint likely have noteworthy influences. Therefore, we hypothesize
Hypothesis 2: The presence of powerful CEOs in microfinance NGOs is associated with declining performance.
METHODOLOGY Sample
4
compiled from rating reports (www.ratingfund2.org), as well as data from the risk assessment reports of five official microfinance rating agencies—MicroRate, Microfinanza, Planet Rating, Crisil, and M-Cril—approved by the C-GAP Ratingfund. The rating methodologies reveal no major differences in MFI assessments relevant to the variables we study.
Each rating agency obtains a maximum of four years of MFI financial data and characteristics to develop its ratings. The reports in our data set cover 280 MFIs from 60 countries gathered during 2000–2007, and most of them refer to the past four years. We annualized and monetized all financial entries. However, the data set does not contain the largest, regulated microfinance banks, which have funders that demand traditional credit ratings, such as those offered by agencies like Standard & Poor’s. The virtually unlimited number of very small savings and credit cooperatives also do not appear in the data set, because they generally operate in isolation from the rest of the microfinance industry. We expect the effect of CEO power to be extremely high for these very small MFIs, which often lack adequate governance structures. In this regard, our estimates of CEO power are probably conservative. The 280 MFIs in the data set represent commercial, professionally oriented institutions that have decided to allow themselves to be rated to improve their access to funding, benchmark their status against others, and increase their transparency.
[INSERT TABLE II ABOUT HERE]
The rating agencies collected the data, which makes our data source more reliable than self-reported data sources such as Mixmarket (www.mixmarket.org) or questionnaires. Compared with those included in the 2006 Mixmarket Annual MFI Benchmarks, the MFIs in our sample are younger and smaller, have fewer credit clients, and hold smaller loan portfolios, though the median loan value is comparable. Table II contains the correlations of the variables in our panel; we present the descriptive panel statistics, together with a description of all variables, in Table III. In Panel A, we note that the average MFI in our sample has about $7.5 million in assets, an average loan size of $773, 7 board members, and
5
an age of approximately 11 years. We provide a cross-tabulation of the number of MFIs per region and type in Panel B; we have the most observations for NGOs, followed by NBFIs. In addition, most observations come from Latin America, followed by Eastern Europe and Central Asia and Africa.
Methods
To investigate our hypotheses, we use three different methods and consider different aspects of MFI performance variability. Extreme outcomes can materialize at different points in time for different MFIs, so we also address across-MFI performance variability and test our hypotheses using a panel of MFIs that should feature both across- and within-MFI variability. Similar to Adams et al. (2005) and Cheng (2008), we apply Glesjer’s (1969) heteroskedasticity test to pooled time-series data in two steps. First, we conduct a regression that explains MFI performance according to the following model:
, 1 2 3 , ,
i t i i t i t
ROA =β +β CEO power +β Controls +e
, (1)
where ROA
i,t
indicates return on assets for MFI i at time t,and CEO power is a dummy that indicates either CEO–chairperson duality or CEO is founder. It should be noted that there are different forms of power, including ownership, expert, prestige, and structural power (Finkelstein, 1992). However, our main focus is structural power, which relates to the CEO’s formal position in the organizational hierarchy and which we measure by two indicators: CEO duality and whether the CEO was the founder of the MFI. The residuals of this first step correspond to the unexpected portion of MFI performance. Therefore, the absolute value of the residuals are a sensible proxy for the unpredictability or variability of MFI performance.
Second, to explain the variability of MFI performance, we regress the absolute value of the residuals on the same explanatory variables:
, 1 2 3 , ,
|ei t |=γ +γ CEO poweri+γ Controlsi t+υi t
. (2)
6
variability is not necessarily related to managerial discretion. For example, powerful CEOs’ strategic deviance could have a positive effect for some MFIs but negative effects for others. These different impacts of CEO power in the cross-section could drive performance variability across MFIs. Therefore, to isolate the effect of managerial discretion, we investigate the effect of CEO power on within-MFI performance variability by regressing the standard deviation of return on assets (ROA) for each MFI over time on the average of our explanatory variables (i.e., horizontal bars indicate averages over time):
1 2 3
( )i i i i
std ROA =γ +γ CEO power +γ Controls +υ
. (3)
Finally, to test Hypothesis 2, we take a closer look at the extremes of the performance distribution. Managerial discretion cannot reveal whether the positive effect of CEO power on performance variability results from positive or negative deviations from the mean. Therefore, we might predict that CEO power has a symmetric impact on performance distribution: a negative impact on the lower quantiles and a comparably positive impact on the upper quantiles. Conversely, Hypothesis 2 considers only a negative impact on the lower quantiles, such that the increase in the standard deviation in Hypothesis 1 reflects negative deviations from the mean.
We use quantile regression to investigate the impact of CEO power on different quantiles of the ROA distribution (Koenker and Hallock, 2001). For ease of exposition, we ignore the panel structure of the data and label the set of explanatory variables Xi. Using
ordinary least squares (OLS), we estimate parameters βfor the conditional mean of ROA,
[ i| i]
E ROA X , which we obtain by minimizing the sum of squared deviations:
(
)
2 min n i i i ROA X β∑
− ′β. Thus, the OLS method offers parameters for the mean of ROAi,
conditional on Xi. With quantile regression, instead of obtaining parameters for the
7
0.5[ i | i]
Q ROA X , by minimizing the sum of absolute deviations:
min n i i i ROA X β
∑
− ′β . Unlike OLS, there is no closed form solution for this minimization problem, so we use numerical optimization methods to solve for β. Beyond the conditional median function, it ispossible to solve the conditional quantile function, Q ROAq[ i |Xi], for different quantiles q. Then the minimization becomes (Cameron and Trivedi, 2005):
: : min | | (1 ) | | i i q i i q n n i i q i i q i ROA X i ROA X q ROA X q ROA X β
∑
≥ ′β − ′β +∑
< ′β − − ′β . (4)This asymmetric weighting procedure ensures that the minimization procedure chooses the conditional quantiles. If q=0.90, more weight gets placed on predictions for observations with ROA≥X′βthan for observations with ROA< X′β.Thus, quantile regression enables us to estimate the effect of CEO power for the extremes of the ROA distribution. In the reported regressions, we choose the quantiles q=0.10and q=0.90and plot the regression coefficients from q=0.10to q=0.90against their corresponding confidence intervals, such that we can estimate the effect of CEO power over the entire ROA distribution.
Dependent Variable
The performance variables that typically assess the effect of governance on performance variability are ROA, Tobin’s Q, and stock returns. The latter two require a firm to be listed on a stock exchange. Most MFIs (cf. a few commercial organizations, such as Compartamos in Mexico and Equity Bank of Kenya) are not listed, so we only use ROA as a dependent variable. It should be noted that (stable) financial returns are very important for microfinance NGOs, because financial returns offer a key “social” indicator of whether the MFI will be able to continue to service its customers over time (Schreiner, 2002).
Independent Variables
8
power. First, we proxy for the structural dimension of power, with the variable CEO =
chairperson, a dummy variable equal to 1 if the chief executive is also chairperson of the board and 0 otherwise. As Table III shows, there is CEO duality only in 12% of the MFIs in our sample, so the distribution of CEO–chairpersons is skewed toward nonduality. Adams et al. (2005) note a similar problem (9%) in their sample. This skew further implies that our results are conservative, because the few CEO duality occurrences induce a bias toward no significant finding. Second, we consider CEO = founder, a dummy variable equal to 1 if the CEO founded the MFI and 0 otherwise. There has been some discussion about which power dimension this variable measures: Finkelstein (1992) uses it as a proxy for ownership power, whereas Adams et al. (2005) argue that it proxies for a dimension of structural power. In line with the resource-based view of the firm, we argue that a founder CEO is the person with the longest tenure in the MFI and possesses firm-specific, unique competencies. Management literature similarly suggests that CEO founders have “higher practical, analytical, and creative intelligence and that, together with entrepreneurial self-efficacy, it enables and motivates successful entrepreneurial behavior” (Baum and Bird, 2010). This form of power is interesting to investigate, because with a mean duration of 11 years, the MFIs in our sample are relatively young, and 34% still have their founders as their CEOs.
Interaction Term. Hypothesis 1 describes a relationship between two variables (performance variability and CEO power) that depends on a third (NGO status). To test it, we include an interaction term in the moderated regression (Aiken and West, 1991), for which we multiply CEO power by NGO status. By definition, the main effect of CEO power then measures the effect of CEO power in all other types of MFIs. Because we have two proxies for CEO power, we create two interaction effects: CEO = chairperson × NGO status and CEO = founder × NGO status.
Control Variables
9
whether there are clients, donors, or employee representatives on the board; board size, because larger boards and more stakeholders with different perspectives should increase the effect of diverse opinions; and the number of international board members and international shareholders, which could offer international knowledge and good governance practices.
Furthermore, we consider whether the CEO is female, because MFIs serve mainly female
customers, who might be better served by a female CEO; Mersland and Strøm (2009) find that a female CEO increases financial performance.
[INSERT TABLE III ABOUT HERE ]
Our individual lending variable captures differences in performance that stem from different lending methods. Regulated indicates whether the MFI is regulated by banking authorities, which provides a good proxy of lender confidence in the MFI and the costs of implementing regulation. Urban lending captures the performance differences between MFIs that operate mainly in urban areas versus in rural areas. With MFI age, we measure MFI learning effects. To measure the size of an MFI, we use ln(Assets), which is the natural logarithm of assets and captures MFI scale economies. We proxy for outreach with the natural logarithm of the gross outstanding portfolio divided by the number of active credit clients to capture social performance, ln(Average Loan Size). This outreach measure helps control for a possible trade-off between social and financial performance. To capture diversification advantages, we use the number of branch offices. We provide a full explanation of these variables in Table III, which also shows that we include MFI organizational type and region dummies to control for MFI type- and region-specific fixed effects.
ANALYSES AND RESULTS
To summarize our initial evidence, in Table IV we present a simple variance F-test of the difference in the ROA variability for our panel. Panels A and B suggest that MFI performance variability is significantly higher for powerful CEOs. Panel C indicates a significant difference in performance variance between NGOs and all other types of MFIs. Panels D and
2 0
E confirm Hypothesis 1: NGOs with CEO–chairperson duality and in which the CEO is a founder achieve higher performance variability than MFIs in which there is no CEO– chairperson duality and the CEO is not the founder, respectively. In Panels D and E, the difference in standard deviations is greater than that in Panels A and B, which suggests that CEO power increases performance variability more in NGOs than in other MFIs.
[INSERT TABLE IV ABOUT HERE]
In Table V, we report the results we obtain from applying Glesjer’s (1969) heteroskedasticity test. Model 1 shows that the effect of CEO–chairperson duality on ROA variability is positive and significant. With a coefficient of 0.029, it is also economically large. The average absolute value of ROA residuals across all MFI years is 0.06. Moving from an MFI year in which the CEO is not chairperson to one in which the CEO is, the absolute value of ROA residuals increases by a factor of 48%. Adams et al. (2005) similarly find that having a founder CEO increases the absolute value of ROA residuals by a factor of 18.5%, though they do not find an effect of CEO duality.
In Model 2, we add the interaction between CEO-chairperson duality and a dummy for whether the MFI is an NGO. This interaction effect is positive and significant, in support of Hypothesis 1. Judging from the increase in the adjusted R-square value, the addition of the interaction effect explains more variance. In addition, the model has a somewhat better fit, judging from the decrease in the Akaike information criterion (AIC). The main effect of CEO–chairperson duality is no longer significant in Model 2. By construction, the main effect in Model 2 measures the effect of CEO–chairperson duality on performance variability for all MFIs other than NGOs; therefore, CEO–chairperson duality has no effect on variability in these other types of MFIs.
Our panel analyses reveal no evidence for Hypothesis 1 when we use CEO = founder as a power proxy. Model 3 shows that the effect of a CEO founder on ROA variability is not significant; Model 4 shows that the interaction of the CEO = founder variable and NGO status
2 is not significant either.
[INSERT TABLE V ABOUT HERE]
Similar to Cheng (2008), we find a negative effect of board size on performance variability, which matches our expectations according to the diversification of opinions effect. That is, group decisions by bigger boards demand more consensus, resulting in less extreme outcomes. To derive the economic significance of these results, consider an increase in board size of one standard deviation (i.e., 3.72 directors): It decreases the absolute value of ROA residuals by -0.003 × 3.72 = -0.01, which implies a decrease in the absolute value of ROA variability of 17%.
Contrary to our expectations, MFIs without stakeholder electives exhibit less performance variability. We expected such boards to be more homogeneous and thus make more extreme decisions. We find a negative effect of being a credit union or cooperative, as we expected, because different cooperative members must agree to reach consensus. In addition, larger MFIs have less performance variability, judging from the negative effect of ln(assets) in Models 1–4. Also, MFIs with less outreach (smaller average loan size) are associated with less performance variability in Models 1 and 2, which suggests a possible trade-off between risk and outreach.
[ INSERT TABLE VI ABOUT HERE ]
We isolate the effect of within-MFI performance variability by estimating Equation 3 without the region dummies, as we show in Table VI. The most surprising result is that Models 1 and 3 indicate no effect of CEO power on within-MFI performance variability, but the interaction effects between CEO power and NGO type are significant in Models 2 and 4. In contrast with our panel regression, we find that CEO = founder has a positive effect on performance variability in NGOs, in support of Hypothesis 1, though only at a 10% significance level. The effect is economically sizeable; in NGOs, compared with the average within-MFI standard deviation of 0.05, CEO–chairperson duality and CEO = founder increase
2 2
the standard deviation by 0.08 and 0.04, respectively. Furthermore, the main effect of a CEO– chairperson becomes significantly negative; in MFIs other than NGOs, this type of duality decreases performance variability. Finally, the cross-section analyses confirm the panel analyses: Larger MFIs and those with lower average loan balances experience less performance variability, which suggests a possible trade-off between risk and outreach.
[INSERT TABLE VII ABOUT HERE]
To investigate Hypothesis 2, we perform quantile regression for a sample of NGOs only. We first consider q = 0.10 and q = 0.90 and display the results of estimating Models 1 and 3 in Table VII. A CEO–chairperson duality significantly decreases ROA by 12% for q = 0.10, but it has no significant effect for q = 0.90. Among the worst performing MFIs in our sample, CEO–chairperson duality has a negative effect on performance, but there is no effect for the best performing MFIs. In support of our panel analyses in Table IV, in unreported results we find no effect of CEO = founder for either the low or the high quantile of the ROA distribution. Finally, the CEO = female variable is positively associated with ROA performance for the high quantile of the ROA distribution, in line with Mersland and Strøm’s (2009) finding of a positive effect of female CEOs on average ROA.
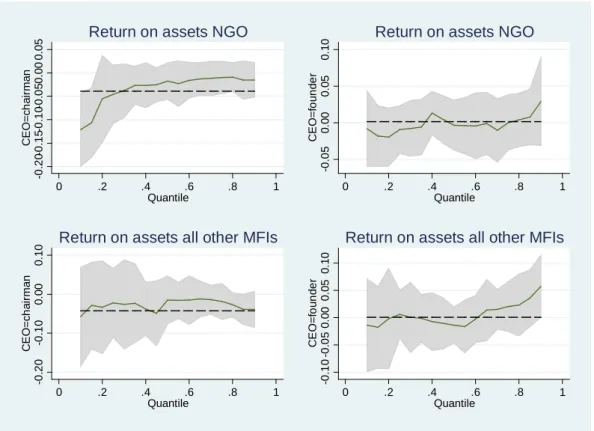
[INSERT FIGURE 1 ABOUT HERE]
Instead of two quantile estimates, we can investigate multiple quantile estimates by plotting them. In Figure 1, we therefore include 17 quantile estimates from q = 0.10 to 0.90 for CEO–chairperson duality, with a solid line to connect the estimates. The gray area represents the 95% confidence interval; a quantile estimate is significant if the grey area does not include the zero line. The OLS estimate is represented by the dotted line. Similar to Mersland and Strøm (2009), we find that the median estimate (q = 0.5) of CEO–chairperson duality is insignificant, but it emerges as significant for quantiles below q = 0.2, because the confidence intervals no longer include 0. Finally, we find no effect of CEO = founder on any of the quantiles of the ROA distribution.
2 3
To contrast NGOs with other MFIs, we also plot CEO–chairperson duality and CEO = founder for the sample of all other MFIs in the two lower plots in Figure 1. Neither CEO– chairperson duality nor CEO = founder has any effect on the lower quantiles of the ROA distribution, though CEO = founder has a marginally significant effect on the upper quantiles, which suggests that for other MFIs with high financial performance, there are positive effects of CEO power.
DISCUSSION
Existing literature on CEO power and firm risk taking has been conducted in the context of limited liability firms and commercial banks (see Adams et al., 2005, and Pathan, 2009). This study centers instead on the impact of CEO power on risk taking in the context of MFIs. Drawing on research in organization theory, we have argued that CEO power is positively associated with risk taking, because extreme decisions are more likely when the CEO is the primary decision maker, rather than when several executives have decision-making power. As a proxy for CEO structural power, we consider CEO duality; in an alternative analysis, we also measure CEO power according to whether the CEO was a founder of the MFI. In line with managerial discretion literature, we have conjectured that the effect of CEO power on risk taking is greater if CEOs face fewer decision-making constraints (i.e., managerial discretion is high).
Microfinance usually is provided by nonbanking institutions, such as microfinance NGOs, which differ greatly from commercial banks and other types of MFIs in terms of their lending procedures, range of activities, objectives, investors, markets, and non-distribution constraints. We argue that the special features of microfinance NGOs enhance managerial discretion, and our empirical evidence confirms that CEO power in microfinance NGOs increases risk taking. That is, CEO duality and, to a lesser extent, CEOs who are founders relate positively to MFI performance variability, in panel and cross-sectional study contexts. We also have shown that the presence of powerful CEOs in other types of MFIs does not
2 4
significantly increase their risk taking, which confirms our hypothesis that microfinance NGOs are special and exhibit particularly high managerial discretion. We thus can compare our results with Pathan (2009), who studied the impact of CEO power on risk taking for a large sample of U.S. banks. In that study, CEO power negatively affected risk taking, though not significantly according to Glejser’s heteroskedasticty tests. This result is similar to our finding for other types of MFIs, which is reasonable: This group of MFIs consists mainly of microfinance banks and NBFI that are similar in many respects to normal commercial banks.
Although it is not the main focus of our analysis, our study also suggests that the presence of powerful CEOs in microfinance NGOs is associated with declining performance. Adams et al. (2005), in their study of CEO power and risk taking among private firms, find no evidence of a negative effectááá of CEO power though; rather, their study suggests that firms with powerful CEOs exhibit both the best and the worst performance. Our findings contradict this claim though, because the centralization of power in the hands of CEOs in microfinance NGOs is consistently bad for performance. Apparently, organizational slack and latitude in strategic decision making that marks microfinance NGOs facilitates managerial “stealing.”
Theoretical and Practical Implications
Although our study is focused on the relationship between CEO power and risk taking in MFIs, the results have wider application, particularly with regard to the role of CEOs in NGOs in general. The presence of powerful CEOs in NGOs may be associated with higher return variability. In some types of NGOs, depending on the services they provide, stakeholders may dislike (donors) or be vulnerable to (recipients) such performance variation. Moreover, our study hints at factors that increase CEOs’ managerial discretion that have not been analyzed previously. By analyzing the relationship between CEO power and risk taking in microfinance NGOs, we highlight the enhanced discretion that results from the absence of profit-driven investors. Furthermore, the non-distribution constraint in NGOs appears only weakly binding and incompletely enforced, such that it can enable CEOs to divert donor
2 5
funds for their own use. Overall, we note the relevance of studying the relative importance of various factors that distinguish NGOs from for-profit businesses, in terms of enhancing CEO decision freedom.
Our study also strongly suggests that it is necessary to reduce the strategic decision power of CEOs in microfinance NGOs. Various instruments could improve the governance structure of microfinance NGOs to help avoid undue risk taking by CEOs, such as better internal control schemes, internal auditing procedures, and more oversight by donors, possibly in the form of donor representation in the board. Examining the various possibilities for reducing the CEO’s strategic decision power should be an important area for further research. Moreover, for the microfinance industry, our study emphasizes the relevance of transforming unregulated microfinance NGOs into regulated, shareholding, financial intermediaries with better governance and ownership structures.
Limitations
The results of this study should be viewed in light of its limitations. First, microfinance research is persistently plagued by data limitations. Our data set is the only one that contains governance variables, but it features only rated MFIs. It is not representative of the total population of MFIs; in particular, it excludes very big MFIs rated by regular bank rating agencies and very small MFIs that are not rated at all. The rating agencies only rated the MFIs once during our sample period, so our governance variables also do not change over time, and we cannot assess the effects of changes in governance.
Second, we use CEO–chairperson duality and CEO as a founder to proxy for the complex notion of CEO structural power. These proxies are relevant, but they cannot reflect the informal power that derives from managerial characteristics, such as aspiration level, commitment, or locus of control (Hambrick and Finkelstein, 1987). Our analysis primarily deals with one dimension of power; this study does not mean to imply that all forms of CEO power induce risk taking and/or are bad.
2 6
Third, though our theoretical arguments suggest a causal relationship between CEO power and performance variability, we cannot preclude reverse causality: Higher performance variability could influence CEO power. Demsetz and Lehn (1985) suggest that an increase in uncertainty increases the scope for moral hazard. When uncertainty, as proxied by performance variability, increases, boards should put more constraints on a CEO’s behavior. Then performance variability would lead to less CEO power. Alternatively, boards may value CEO power, especially when the firm’s performance is poor (Finkelstein and D’Aveni, 1994), to signal there is a “captain in charge of the ship.” We find that CEO power is closely associated with the worst NGO performance; perhaps then the worst performers grant their CEO more power. To resolve this issue, further microfinance research needs instruments for CEO power (e.g., Adams et al., 2005), which currently are not available.
Fourth, our analysis looks at the impact of CEO power on risk taking in terms of financial variables. It does not consider the social consequences of the presence of powerful CEOs in microfinance NGOs.
CONCLUSION
Although literature on microfinance is voluminous, consideration of the governance of MFIs remains scant. This article offers an initial investigation into the effect of governance on MFI risk taking. Building on prior research, we argue that managers in microfinance NGOs have managerial discretion, so CEO power increases risk taking. We find, regarding the drivers of greater performance variability, that CEO power in NGOs is associated with declining performance. Therefore, good governance in microfinance NGOs is needed to guard against powerful CEOs.
2 7
REFERENCES
Adams, R. B., Almeida, H., and Ferreira, D. (2005). ‘Powerful CEOs and their impact on corporate performance’. Review of Financial Studies, 18, 1403-32.
Aiken, L.S. and West, S.G. (1991). Multiple Regression: Testing and Interpreting Interactions. Newbury Park, CA: Sage.
Armendáriz, B. and Morduch, J. (2010). The Economics of Microfinance: Second Edition. Cambridge, MA: The MIT Press.
Baum, J, and Bird, B (2010). 'The successful intelligence of high-growth entrepreneurs: links to new venture growth'. Organization Science, 21, 397-412.
Bradley, S.W., Shepher, D.A. and Wiklund, J. (2011). ‘The importance of slack for new organizations facing ‘tough’ environments Journal of Management Studies, 48, 1071-1097.
Brhlíková, P. and Ortmann, A. (2006). The Impact of the Non-Distribution Constraint and its Enforcement on Entrepreneurial Choice, Price and Quality. Working Paper Series 299 (ISSN 1211-3298). Prague: CERGE-EI.
Brown, M. B., and Forsythe, A. B. (1974). ‘Robust test for the equality of variances’. Journal of the American Statistical Association,69, 364-67.
Cameron, A.C. and Trivedi, P.K. (2005). Microeconometrics: Methods and Applications. New York: Cambridge University Press.
Caza, A. (2011). ‘Typology of the eight domains of discretion in organizations’. Journal of Management Studies, no. doi: 10.1111/j.1467-6486.2010.00982.x.
Cheng, S. (2008). ‘Board size and the variability of corporate performance’. Journal of Financial Economics, 87, 157-76.
Christen, R.P., Lyman, T.R. and Rosenberg, R. (2003). Microfinance Consensus Guidelines: Guiding Principles on Regulation and Supervision of Microfinance. Washington, DC: CGAP and the World Bank Group.
2 8
CSFI (2011). Microfinance banana skins: losing its fairy dust.
http://www.cgap.org/gm/document-1.9.49643/Microfinance_Banana_Skins_2011.pdf
(accessed on 22 June 2011).
Dahl, R.A. (1957). ‘The concept of power’. Behavioral Science, 2, 201-215.
Demsetz, H. and Lehn, K. (1985). ‘The structure of corporate ownership: causes and consequences’. Journal of Political Economy. 93, 1155-1177.
Elbanna, S. and Child, J. (2007). ‘The influence of decision, environmental and firm characteristics on the rationality of strategic decision-making.’ Journal of Management Studies,44, 561-591.
Finkelstein, S. (1992). ‘Power in top management teams: dimensions, measurement, and validation’. Academy of Management Journal, 35, 505-38.
Finkelstein, S. and D’Aveni, R. (1994). ‘CEO duality as a double-edged sword: how boards of directors balance entrenchment avoidance and unit of command’. Academy of
Management Journal, 37, 1079-1108.
Finkelstein, S. and Hambrick, D.C. (1990). ‘Top-management-team tenure and organizational outcomes: the moderating role of managerial discretion’. Administrative Science
Quarterly, 35, 484-503.
Fishman, R. and Hubbard, R.G. (2003). ‘The role of non-profit endowments’ in Glaeser, E.L. (Ed.), The Governance of Not-for-Profit Organizations. Chicago: University of Chicago Press, 217-233.
Fishman, R. and Hubbard, R.G. (2005). Precautionary savings and the governance of nonprofit organizations. Journal of Public Economics, 89, 2231-2243.
Glaeser, E.L. (2003). ‘Introduction to the governance of not-for-profit organizations’, in Glaeser, E.L. (Ed.), The Governance of Not-for-Profit Organizations. Chicago: University of Chicago Press.
2 9
Economics, 81, 99-115.
Glesjer, H. (1969). ‘A new test for heteroskedasticity’. Journal of the American Statistical Association, 64, 316-323.
Hambrick, D. C. and Finkelstein, S. (1987). ‘Managerial discretion: a bridge between polar views on organizations’, in Cummings, L.L. and Staw, B.M. (Eds.), Research in
Organizational Behavior.Greenwich, CT: JAI Press.
Hansmann, H.B. (1980). ‘The role of nonprofit enterprise’. Yale Law Journal, 80, 835-901. Hartarska, V. (2005). ‘Governance and performance of microfinance institutions in central and
Eastern Europe and the newly independent states’. World Development, 33, 1627-1643. Hermes, N., Lensink, R., and Meesters, A. (2011). Outreach and efficiency of microfinance
institutions, World Development,39, 875-881.
Holmstrom, B. and Milgrom, P. (1991). ‘Multitask principal-agent analyses: incentive
contracts, asset ownership, and job design’. Journal of Law, Economics, and
Organization, 7, 24-52.
Jansson, T., Rosales, R. and Westley, G. (2004). Principles and Practices for Regulating and Supervising Microfinance. Washington, DC: Inter-American Development Bank.
Koenker, R. and Hallock, K.F. (2001). ‘Quantile regression’. Journal of Economic
Perspectives,15, 143-156.
Kogan, N. and Wallach, M. (1966). ‘Modification of judgmental style through group interaction’. Journal of Personality and Social Psychology, 4, 165-174.
Labie, M. and Mersland, R. (2011). ‘Corporate governance challenges in microfinance’. In
Armendáriz, B. and Labie, M. (Eds.), The Handbook of Microfinance, Oxon: World
Scientific Publishing Ltd., 283-300.
Li, J., and Tang, Y (2010). ‘CEO hubris and firm risk taking in China: the moderating role of managerial discretion’. Academy of Management Journal, 53, 45-65
3 0
Digging Deeper to Find Keys to Success. Washington: Seep Network—Poverty Outreach Working Group.
Mersland, R. (2009). ‘The cost of ownership in microfinance organizations’. World Development, 37, 469-478.
Mersland, R. and Strøm, R., Ø. (2009). ‘Performance and governance in microfinance institutions'. Journal of Banking and Finance, 33,662-669.
Moscovici, S. and Zavalloni, M. (1969). ‘The group as polarizer of attitudes’. Journal of Personality and Social Psychology, 12, 125-135.
Pathan, S. (2009), ‘Strong boards, CEO power and bank risk-taking’. Journal of Banking and Finance, 33, 1340-1350.
Reed, L. (2011). State of the Microcredit Summit Campaign Report 2011. Washington, DC: Microcredit Summit Campaign (MCS).
Rock, R., Otero, M. and Saltzman, S. (1998). Principles and Practices of Microfinance Governance. Accion International.
Sah, R.K. and Stiglitz, J. (1986). ‘The architecture of economic system: hierarchies and polyarchies’. American Economic Review, 76, 716-727.
Sah, R.K. and Stiglitz, J. (1991). ‘The quality of managers in centralized versus decentralized Organizations’. QuarterlyJournal of Economics, 106, 289-29.
Schreiner, M. (2002). “Aspects of Outreach: A Framework for the Discussion of the Social Benefits of Microfinance”, Journal of International Development, 14, 591–603. Steege, J. (1998). The Rise and Fall of Corposol: Lessons Learned from the Challenges of
Managing Growth. Washington, DC: USAID Microfinance Best Practice.
Tang, J, Crossan, M. and Rowe, W.G. (2011). ‘Dominant CEO, deviant strategy, and extreme performance: the moderating role of a powerful board’. Journal of Management Studies,
48, 1479-1503.
World Bank (2005). Financial Sector Assessment: A Handbook. Washington, DC: The World Bank and IMF.
Table I. Managerial discretion typology of MFIs NGOs Cooperatives / Credit
Unions
NBFIs Banks
Not regulated Not regulated Partly regulated Regulated Non-distribution constraint Distribute profits to members Distribute profits to owners Distribute profits to owners Governance not tied to
ownership Governance tied to members Governance tied to ownership Governance tied to ownership Dual objectives Dual objectives Financial objectives Financial objectives
Table II. Correlations (1) (2) (3) (4) (5) (6) (7) (8) (9) (10) (11) (12) (13) (14) (15) (16) (17) (18) (19) (20) (1) Return on assets 1 (2) CEO = chairperson -0.09 1 (3) CEO = founder -0.04 0.15 1 (4) No stakeholder electives -0.02 0.11 -0.04 1 (5) Board size 0.07 -0.14 0.04 0.05 1
(6) International board members 0.02 -0.16 -0.11 -0.10 -0.09 1 (7) International shareholders -0.01 -0.10 0.01 -0.08 -0.13 0.40 1 (8) CEO = female 0.17 0.02 0.23 -0.16 0.21 -0.07 -0.18 1 (9) Individual lending 0.04 -0.12 -0.03 -0.10 -0.22 -0.01 0.11 -0.07 1 (10) Regulated 0.01 -0.02 0.05 -0.33 -0.06 0.16 0.12 -0.01 0.24 1 (11) Urban lending 0.11 -0.09 -0.16 0.28 0.02 -0.10 0.01 0.01 0.22 -0.12 1 (12) MFI age 0.03 -0.09 -0.10 -0.03 0.29 -0.25 -0.23 -0.15 -0.04 0.07 0.02 1 (13) ln(Assets) 0.22 0.07 0.07 -0.13 0.05 0.17 0.04 -0.03 0.24 0.26 -0.11 0.16 1
(14) ln(Average loan size) 0.09 -0.14 0.06 -0.14 -0.23 0.06 0.07 -0.06 0.58 0.21 0.02 -0.08 0.40 1
(15) Branch offices 0.07 0.09 0.09 0.04 0.35 -0.08 -0.06 -0.09 -0.15 0.13 0.01 0.44 0.37 -0.18 1
(16) Bank 0.07 0.00 0.07 -0.03 -0.01 0.17 0.12 -0.08 0.10 0.20 0.01 0.08 0.27 0.10 0.20 1
(17) Nonbank financial institution -0.12 0.12 0.02 -0.11 -0.29 0.23 0.58 -0.16 0.08 0.37 -0.08 -0.27 0.06 -0.01 -0.08 -0.08 1
(18) NGO 0.12 -0.08 -0.09 0.29 0.19 -0.14 -0.45 0.04 -0.15 -0.48 0.15 0.10 -0.20 -0.18 0.02 -0.20 -0.69 1
(19) Cooperative/credit union -0.03 -0.11 0.12 -0.43 0.12 -0.15 -0.10 0.23 0.12 0.24 -0.11 0.28 0.09 0.18 -0.02 -0.05 -0.16 -0.41 1 (20) State bank -0.07 -0.04 -0.07 0.07 -0.10 -0.05 -0.03 -0.05 -0.12 -0.06 0.12 -0.07 -0.11 -0.14 -0.06 -0.02 -0.05 -0.13 -0.03 1
Table III.Descriptive statistics
Variable Obs. Mean Median Std. Dev. Min Max
Panel A: Summary Statistics
Return on assets 926 0.01 0.03 0.13 -0.90 0.79 CEO = chairperson 803 0.12 0.00 0.33 0.00 1.00
CEO = founder 205 0.34 0.00 0.47 0.00 1.00
No stakeholder electives 926 0.58 1.00 0.49 0.00 1.00
Board size 812 7.34 7.00 3.72 2.00 33.00
International board members 700 0.56 0.00 1.20 0.00 6.00 International shareholders 926 0.09 0.00 0.28 0.00 1.00 CEO = female 768 0.25 0.00 0.44 0.00 1.00 Individual lending 877 0.57 1.00 0.49 0.00 1.00 Regulated 925 0.30 0.00 0.46 0.00 1.00 Urban lending 926 0.36 0.00 0.48 0.00 1.00 MFI age 923 11.06 8.00 9.24 0.00 80.00
Assets 919 7.50E+06 3.10E+06 1.60E+07 40467.00 2.50E+08
ln(Assets) 919 14.94 14.94 1.32 10.61 19.34
Average loan size 905 772.52 446.00 1318.12 15.00 24589.00 ln(Average loan size) 905 6.05 6.10 1.09 2.71 10.11 Branch offices 899 12.54 7.00 19.06 1.00 129.00 Regions A EE EE & CA LA ME & NA SA Total
Panel B: Cross-tabulation number of MFIs per MFI type and region
Bank 19 5 3 12 0 3 42
Nonbank financial institution 39 33 33 96 7 5 213
NGO 55 21 95 299 37 32 539
Cooperative/credit union 32 1 7 59 0 5 104
State bank 0 0 0 11 0 0 11
Other 3 0 10 4 0 0 17
Total 148 60 148 481 44 45 926
Notes: ROA = net operating income/average annual assets. CEO = chairperson is a dummy that equals 1 if the CEO and the chair of the board are the same person. CEO = founder is a dummy that equals 1 if the CEO is also the founder of the MFI. No stakeholder electives equals 1 when no clients, donors, or employees serve on the board. Board size indicates the number of MFI board members. International board members indicates the number of international board members. International shareholders equals 1 if an MFI has international shareholders. CEO = female is a dummy that equals 1 if the CEO is a woman. Individual lending equals 1 if the MFI mainly conducts individual lending as opposed to group lending. Regulated equals 1 if the MFI is regulated by banking authorities in the country. Urban equals 1 if an MFI’s main market is urban as opposed to rural. MFI age = year – start-up year. Ln(Assets) is the natural logarithm of assets. Ln(Average loan size) is the natural logarithm of (gross outstanding portfolio/number of active credit clients). Branch offices indicates the number of branch offices. The regions are Africa (A), East Asia and the Pacific (EA & P), Eastern Europe and Central Asia (EE & CA), Latin America (LA), Middle East & North Africa (ME & NA) and South Asia (SA).
Table IV. Variance F-tests of equality of performance variance
Panel A. H0 : CEO = chairperson
CEO = chairperson (std.) 0.09 Number of observations 33 CEO ≠ chairperson (std.) 0.07 Number of observations 208 Variance F-test 6.954 P-value [0.00]
Panel B. H0: CEO = founder
CEO = founder (std.) 0.09 Number of observations 69 CEO ≠ founder (std.) 0.07 Number of observations 136 Variance F-test 3.618 P-value [0.03]
Panel C. H0: MFI = NGO
MFI = NGO (std.) 0.14 Number of observations 542 MFI ≠ NGO (std.) 0.11 Number of observations 389 Variance F-test 13.389 P-value [0.00]
Panel D. H0: CEO = chairperson & MFI = NGO
CEO = chairperson & MFI = NGO (std.) 0.11
Number of observations 21
CEO ≠ chairperson or MFI ≠ NGO (std.) 0.07
Number of observations 220
Variance F-test 7.447
P-value [0.00]
Panel E. H0: CEO = founder & MFI = NGO
CEO = chairperson & MFI = NGO (std.) 0.12
Number of observations 39
CEO ≠ chairperson or MFI ≠ NGO (std.) 0.07
Number of observations 166
Variance F-test 4.312
P-value [0.01]
Notes: We report a robust version of the variance F-test of Brown and Forsythe (1974), in which the mean is replaced by the 10% trimmed mean. We perform an F-test of the difference in the variance of the return on assets and operational costs. We report means for these variables with their standard deviation in parentheses; we report the F-statistic with the p-value in square brackets.
Table V. Panel performance variability as a function of CEO power and NGO status
Dependent variable Absolute value of ROA residuals
Independent variables Model 1 Model 2 Model 3 Model 4
CEO = chairperson 0.029** (0.014) -0.002 (0.018) CEO = chairperson × NGO-status 0.044* (0.025)
CEO = founder 0.007 (0.007) -0.002 (0.011)
CEO = founder × NGO-status 0.014 (0.015)
No stakeholder electives -0.016* (0.009) -0.017* (0.009) -0.019** (0.007) -0.023*** (0.008) Board size -0.003*** (0.001) -0.003*** (0.001) -0.002* (0.001) -0.002 (0.001) International board members 0.003 (0.003) 0.004 (0.003) 0.006 (0.004) 0.006 (0.004) International Shareholders 0.007 (0.012) -0.003 (0.012) -0.009 (0.012) -0.013 (0.013) CEO = female 0.001 (0.006) -0.001 (0.007) 0.003 (0.008) 0.003 (0.009) Individual lending -0.000 (0.007) -0.001 (0.007) 0.001 (0.007) 0.003 (0.007) Regulated -0.009 (0.006) -0.011* (0.006) -0.012* (0.007) -0.019*** (0.007) Urban lending -0.007 (0.007) -0.007 (0.006) -0.010 (0.007) -0.009 (0.007) MFI age 0.001* (0.000) 0.001* (0.000) 0.000 (0.000) 0.000 (0.000) ln(Assets) -0.012*** (0.004) -0.013*** (0.004) -0.014*** (0.004) -0.015*** (0.004) ln(Average loan size) -0.011** (0.005) -0.010** (0.005) -0.001 (0.004) -0.000 (0.004) Branch offices -0.000 (0.000) -0.000 (0.000) 0.000 (0.000) 0.000 (0.000)
Bank -0.015 (0.033) -0.014 (0.029) -0.004 (0.029) 0.000 (0.029)
Non-bank financial institution -0.023 (0.031) -0.025 (0.027) -0.008 (0.026) -0.001 (0.027)
NGO -0.022 (0.029) -0.034 (0.025) -0.019 (0.024) -0.020 (0.025) Cooperative/credit union -0.044 (0.031) -0.054* (0.027) -0.054** (0.027) -0.050* (0.028) State bank 0.022 (0.032) 0.010 (0.029) 0.043 (0.026) 0.045* (0.027) Constant 0.351*** (0.071) 0.384*** (0.069) 0.316*** (0.079) 0.316*** (0.079) Observations 481 481 415 415 Adjusted R-squared 0.166 0.173 0.144 0.152 AIC -1339 -1343 -1196 -1208
Notes: This table reports the estimations of Equation 2. We include MFI type dummies for banks, non-bank financial institutions, cooperatives/credit unions, and state banks, excluding other types. We include region dummies for Africa, East Asia and the Pacific, Eastern Europe and Central Asia, Latin America, and the Middle East and North Africa, excluding South Asia. We report robust standard errors clustered by MFI in parentheses.
Table VI. Cross-section regressions: performance variability over time as a function of CEO power and NGO Status
Dependent variable Standard deviation of ROA
Independent variable Model 1 Model 2 Model 3 Model 4
CEO = chairperson -0.008 (0.020) -0.057* (0.031)
CEO = chairperson × NGO 0.079** (0.034)
CEO = founder 0.016 (0.012) -0.008 (0.018)
CEO = founder × NGO 0.038* (0.022)
No stakeholder electives -0.002 (0.012) -0.005 (0.011) 0.001 (0.011) -0.002 (0.010) Board size -0.001 (0.002) -0.002 (0.002) -0.000 (0.002) 0.000 (0.002) International board members 0.002 (0.005) 0.003 (0.005) 0.007 (0.005) 0.007 (0.005) International Shareholders -0.012 (0.026) -0.023 (0.025) -0.033 (0.027) -0.035 (0.027) CEO = female -0.001 (0.011) -0.005 (0.011) -0.006 (0.012) -0.006 (0.012) Individual lending -0.004 (0.009) -0.001 (0.009) -0.004 (0.008) -0.002 (0.008) Regulated -0.005 (0.012) -0.006 (0.012) -0.004 (0.015) -0.006 (0.015) Urban lending -0.002 (0.010) -0.002 (0.010) -0.003 (0.009) -0.004 (0.009) MFI age -0.000 (0.001) -0.000 (0.001) -0.000 (0.001) -0.000 (0.001) ln(Assets) -0.010** (0.005) -0.012*** (0.004) -0.016*** (0.004) -0.016*** (0.004) ln(Average loan size) -0.022* (0.011) -0.023** (0.011) -0.011 (0.009) -0.010 (0.009) Branch offices 0.000 (0.000) 0.000 (0.000) 0.000 (0.000) 0.000 (0.000)
Bank -0.019 (0.035) -0.035 (0.027) -0.013 (0.040) -0.003 (0.045)
Non-bank financial institution -0.025 (0.036) -0.034 (0.029) 0.003 (0.039) 0.007 (0.044)
NGO -0.047 (0.032) -0.072*** (0.027) -0.042 (0.029) -0.053 (0.035) Cooperative/credit union -0.051 (0.034) -0.071** (0.028) -0.046 (0.032) -0.044 (0.038) State bank 0.012 (0.043) -0.013 (0.041) 0.044 (0.037) 0.043 (0.041) Constant 0.392*** (0.090) 0.459*** (0.092) 0.380*** (0.088) 0.382*** (0.089) Observations 133 133 112 112 Adjusted R-squared 0.153 0.188 0.188 0.203 AIC -368.6 -373.4 -329.9 -331.2
Notes: This table reports the estimations of Equation 3. We include MFI type dummies for banks, non-bank financial institutions, cooperatives/credit unions, and state banks, excluding other types. We include region dummies for Africa, East Asia and the Pacific, Eastern Europe and Central Asia, Latin America, and the Middle East and North Africa, excluding South Asia. We report robust standard errors clustered by MFI in parentheses.