T
HE
W
ILLIAM
D
AVIDSON
I
NSTITUTE
AT THE UNIVERSITY OF MICHIGAN BUSINESS SCHOOLAutonomy and Performance of Foreign Subsidiaries in five
Transition Countries
By: Urmas Varblane, Katrin Männik, and Helena Hannula
William Davidson Institute Working Paper Number 780
July 2005
AUTONOMY AND PERFORMANCE OF FOREIGN SUBSIDIARIES IN FIVE TRANSITION COUNTRIES
Urmas Varblane,1 Katrin Männik,2Helena Hannula3 ABSTRACT
The paper analyses the link between the autonomy according to business function and the performance of foreign subsidiaries in Slovenia, Poland, Hungary, Slovakia and Estonia. The novelty of the paper is in the deeper investigation of the multidimensionality of autonomy. Using the method of principal components, four business function factors relating to autonomy were obtained (technology, marketing, management, finance). The results supported the argument that the relationship between autonomy and performance depends on the type of autonomy. Marketing and finance are the most powerful dimensions of autonomy. Higher autonomy in marketing is negatively linked with technology upgrading, measured by productivity level, improvement of technological level of production equipment, and quality of products. The higher the financial autonomy of the subsidiaries the bigger the positive changes in all fields of performance.
Keywords: international technology transfer, FDI effects on the host economy, subsidiary autonomy, subsidiary performance, transition countries
JEL classification: F21, O30, O14
1
Professor of International Business, Faculty of Economics and Business Administration, University of Tartu; Estonia, Email: [email protected]
2
PhD student, Faculty of Economics and Business Administration, University of Tartu; currently Science & Technology Policy Research (SPRU), University of Sussex; Mail address: 4-A213 Narva Rd., 51009 Tartu, Estonia; Email: [email protected]
Introduction
Integration of Central and Eastern European (CEE) countries into the European Union has accelerated the process of integration of firms from these countries into international production and technological networks. Their foreign direct investment (FDI) has played a significant role in this process and their involvement in the creation of subsidiaries in host countries was accompanied by the transfer of knowledge and material assets.
The aim of this paper is to analyze the link between the autonomy according to business functions and the performance indicators of subsidiaries of multinational companies in five CEE countries. In addition, country-, industry- and firm-specific variables will be used as control variables. The research questions presented in the paper are based on the literature that focuses on subsidiary development and the link between subsidiary autonomy and performance indicators. The empirical analysis of the paper is based on a survey carried out in 433 firms from five CEE countries under the European Union’s Fifth Framework Project “EU Integration and the Prospects for Catch-Up Development in Central and Eastern European countries (CEEC): The Determinants of the Productivity Gap”.
This paper is structured as follows: the first section deals with the theoretical framework, including the development of the research hypotheses. In the second section, the research method and data are described. This is followed, in the third section, by the empirical analyses of the autonomy of subsidiaries using principal component factor analysis. In the last section of the paper the link between various performance indicators, measured by the growth of productivity and export shares, improvements in the technological level of production equipment and product quality, and different dimensions of the autonomy of subsidiaries are analyzed. As control variables, country-, industry- and firm-specific variables (size, ownership, year of establishment as foreign investment enterprise) were also used. Finally, conclusions about the impact of autonomy on the performance of subsidiaries are drawn and in the last section implications and future research plans are discussed.
1. Theoretical framework
Autonomy and the role of subsidiaries in the development of MNCs
There exists a substantial body of literature concerned with various aspects of multinational subsidiary management (for example Birkinshaw et al.,1995; Poynter et al.,1985; Roth et al., 1992; Taggart, 1997). According to Paterson and Brock (2002), research on subsidiaries has evolved over time. The focus in the beginning was on structure and strategy; the research later became concerned with headquarter-subsidiary relationships and subsidiary roles. Recently researchers have been increasingly interested in the subsidiary itself, its capacities and development. Following Birkinshaw (1997), the (foreign) subsidiary4 is defined here as an operational unit controlled by the MNC and situated outside the home country. Two distinct views of the role of the subsidiary could be discerned: the first approach involves the role for the subsidiary assigned by the parent MNC; another approach is that the role may be assumed through the subsidiary’s own behaviour (Birkinshaw, 2000). Referring to Taggart (1997), autonomy may be regarded as a decision-based process that evolves through bargaining between centre and periphery in an organization. Thus, the autonomy of the subsidiary lies in its position in relation to the parent company across all business activities. A simpler definition has given by Björkman (2003), who defines subsidiary autonomy in the context of an MNC as the extent to which decision-making is taking place in the subsidiary without interference from the headquarters.
Previous studies have attempted to explain variations in subsidiary autonomy, which can be divided into: MNC characteristics, subsidiary characteristics and environmental factors (see Björkman 2003). Usually, the studies on MNC characteristics look at the size of the MNC and the effect of parent nationality on the subsidiary. The results for the impact of MNC characteristics have been mixed and there is no clear understanding about it. On the other hand the studies on subsidiary characteristics are richer and show a little more consistency than those on MNC characteristics. The most recent literature overview and discussion about gaps in research in this area has been given by Young and Tavares (2004). Much less has been analyzed concerning the impact of environmental factors on autonomy, especially the host country role in providing opportunities for the subsidiary to develop external networks and increase autonomy
through capability-building. In the following theoretical part, only some of the most important factors influencing the autonomy of a subsidiary will be discussed and hypotheses for the empirical research established.
Subsidiary development and creation of firm-specific advantages
Subsidiary initiative or development has been a major research area in this general field (Birkinshaw, 1997; Birkinshaw et al., 1998). Subsidiary initiative is ‘undertaken with a view to expanding the subsidiary’s scope of responsibility’ (Birkinshaw, 2000: 8). The final aim of subsidiary development is to build subsidiary-specific advantages, which may involve production-related assets like technological, productive or marketing know-how, or be associated with the organizational capability to co-ordinate and control efficiently the MNC’s asset base (Rugman et al., 2001).
In the process of subsidiary development different roles can be taken on in order to create and leverage their firm’s specific advantages. It is important for the multinational to determine the proper combination of centralization and autonomy under which foreign subsidiaries could maximize their value-creating roles (Hewett et al., 2003). In earlier works, Birkinshaw (1996; 1997) identified several forms of subsidiary initiative – local, internal, global and hybrid market initiatives – and also indicated conditions for these to be executed. According to Birkinshaw high autonomy appeared important for local and global market initiatives, but low autonomy was associated with internal market and hybrid initiatives. High parent-subsidiary communication was associated with internal market and hybrid initiatives, while the reverse was true of local and global market initiatives.
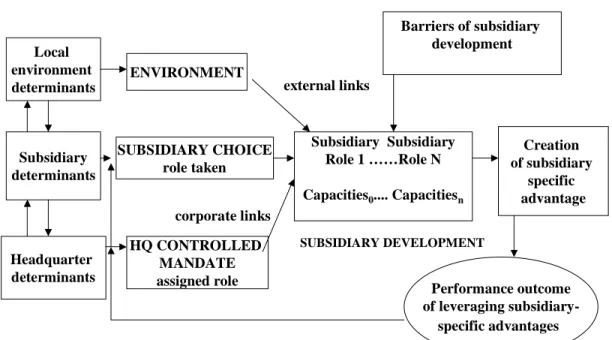
The following Figure 1 describes the general framework of subsidiary development, creation of firm-specific advantages and links with performance. Birkinshaw and Hood (1998b) identified three interacting drivers of subsidiary evolution and capability creation: head-office assignment, subsidiary choice and local environment determinism. Later associations were more precisely identified with subsidiary initiatives derived from subsidiary management factors (leadership and entrepreneurial culture), parent-subsidiary relationships (subsidiary autonomy and subsidiary-parent communication) and the business environment (local competition and industry
globalization). Several authors tried also to determine links between subsidiary initiative and specialized resources (see Andersson et al., 2001; Rugman and Verbeke, 2001).
Subsidiary initiative is closely linked with power creation and autonomy. Power is something that can be given (assigned by delegation) or taken. The power can be gained by having ability or a capability or by possessing something with which it is possible to control somebody else. Firms differ in their ability to accumulate competencies and capabilities which are rare, valuable, non-substitutable and difficult to imitate. Abilities and capabilities can be acquired and lost over time and hence power is a dynamic concept (Björkman, 2003).
A subsidiary that is important to the MNC as a whole will have the potential to negotiate more with the headquarters than subsidiaries of lesser importance. Hence using its negotiating power the important subsidiary could be more autonomous than its less important counterparts. Furthermore, continuing the argument, subsidiaries that are able to outperform their corporate and local counterparts might have a higher degree of negotiating power than counterparts with weaker performance. The reason for this is that the MNC as a whole will be, at least to some degree, more dependent upon the well-performing subsidiary for its performance. The better the subsidiary is performing in comparison to other corporate units and local counterparts, the higher its autonomy will be. But for our framework this result is too general as we would like to resolve hypotheses about the connection between different dimensions of autonomy and performance.
Local environment determinants Subsidiary determinants Headquarter determinants ENVIRONMENT SUBSIDIARY CHOICE role taken HQ CONTROLLED MANDATE assigned role Creation of subsidiary specific advantage Subsidiary Subsidiary Role 1 ……Role N Capacities0.... Capacitiesn Performance outcome of leveraging subsidiary-specific advantages SUBSIDIARY DEVELOPMENT Barriers of subsidiary development external links corporate links
Figure 1. The framework of subsidiary development and performance (using ideas from Birkinshaw and Hood, 1998; Rugman, 2001; Paterson and Brock, 2002)
In the process of subsidiary development a central role is played by absorptive capacity creation and realization. In the seminal work of Cohen and Levinthal (1990), absorptive capacity was defined as the ability to recognize the value of new external information, assimilate and commercialize it. They stressed that such a capacity is something that develops over time, is path-dependent and therefore builds on prior knowledge of the capacity of other organizations. This ability is assumed to be crucial for the firm’s competitive advantage. Firms learn from other firms, and the efficiency of such a learning process is dependent on the characteristics of the relationships the focal organization has with other organizations (Andersson et al., 2001).
Lane and Lubatkin (1998) distinguished two types of learning among organizations. Passive learning means acquiring objective and observable facts of the other firm’s capability. This learning occurs at arm’s-length and only the most visible parts of another firm’s knowledge can
be acquired. Active learning means also acquiring tacit knowledge, embedded in a firm’s social context and therefore also more difficult to imitate by others. From that Andersson et al. (2001) concluded that: “if we assume that acquiring of tacit, non-imitable knowledge is crucial for a firm’s competitive advantage, we can state that the quality of the relationships with other firms are of decisive importance. In order to be competitive, the firm needs at least some links with other organizations, which are more important than other links in terms of the characteristics above.” This outcome had actually been mentioned already in earlier works. For example, Gupta and Govindarajan (2000) found that the absorptive capacity of the receiving unit is the most significant determinant of internal knowledge transfer in the MNC.
Consequently when subsidiaries differ in their absorptive capacity, this affects the level of knowledge transfer, not only from the mother company but also from other MNC units. In paper by Mahnke et al. (2003) the link between higher absorptive capacity and growth of knowledge flows was analysed. In contrast to prior empirical studies, they were interested in intra-firm knowledge flows between MNC subsidiaries. Accordingly they conceptualized a subsidiary’s absorptive capacity and developed measures to capture the ability and motivation of employees to learn from other units in the MNC.
Further interest was to discover more deeply the process of the absorptive capacity building. An interesting paper by Minbaeva et al. (2001) suggested that absorptive capacity should be conceptualized as being comprised of two dimensions—ability and motivation. Further, their results indicated that the interaction of ability and motivation significantly facilitated transfer of knowledge from other parts of the MNC.
Consequently in order to create absorptive capacity of subsidiary both sides are needed – motivation and ability. The motivation is closely linked with the role assigned to the subsidiary in the corporate network. On the other hand the ability itself is critically dependent on the environment in which the subsidiary is located (Rosenzweig and Singh, 1991). In Figure 1 this dimension is marked as the external link between subsidiary and environment. Therefore analysis of environmental parameters (market growth, sophistication of national innovation system, quality of local managers, etc.) plays an important role in the process of opening the potential for the capacity-building process of subsidiaries.
From the previous discussion we could reach the conclusion that the growth of the absorptive capacity of the subsidiary increases the knowledge inflows and helps to create firm-specific advantages which are reflected in better performance indicators (productivity, product quality, export propensity).
Corporate and external networks and technological autonomy of subsidiaries
In order to formulate the research hypotheses we have to figure out the mechanism by which autonomy and capacity building are connected. This requires discussion of the link between subsidiary capacity development and the concept of embeddedness, which was initially used by sociologists (Granovetter, 1985). The major idea of the concept is emphasising that economic transactions between two actors are embedded in a social and cultural context. This concept has been used intensively in discussions about the link between the environment and subsidiary-headquarters relationships in MNCs (Andersson and Forsgren, 1996; Andersson et al., 2001). The link between the embeddedness and the absorptive capacity of the subsidiary was implied by Cohen and Levinthal’s (1990) notions, that such a capacity develops over time, is path-dependent and therefore builds on prior knowledge of the other organization’s capacity. An excellent overview of the literature using the embeddedness concept in this area was presented in Andersson et al. (2001).
Using the concept of embeddedness, Andersson and Forsgren (1996) distinguished between external and corporate networks and relationships. They showed that the more embedded the subsidiary was within its external relationships via local demand, sourcing and links with the local system of innovation, the lower was the control from the MNC. On the other hand a stronger embeddedness within corporate relationships suggested greater MNC control over the subsidiary (see for example the results of Hedlund, 1981; Garnier, 1982; Harzing, 1999). This was found to be especially so in the case of the technological embeddedness of the subsidiary as this provides the subsidiary with external, tacit knowledge about new technology, and this in turn was found to be a key factor for the growth and creation of firm-specific advantages. In their work Andersson et al. (2001) established the hypothesis that technological embeddedness is positively related to the subsidiary’s market performance and organizational performance. Market performance was defined as the performance in the marketplace where the subsidiary competes with all other companies, while organizational performance is that in the political
process inside the MNC, where the subsidiary aims to influence strategic decisions of relevance for the subsidiary. These analyses supported their hypothesis according to which the subsidiary’s technological embeddedness is positively related to its market performance. Interestingly good market performance by subsidiaries did not lead to a high level of organizational performance. Combining the results from the preceding literature discussion about the high level of technological embeddedness requiring a relatively high autonomy of the subsidiary allows us to formulate the following hypothesis:
Hypothesis 1: High autonomy of the subsidiary in technology indicates a strong technological embeddedness and is positively related to economic performance
Autonomy in marketing and performance
Marketing activities are another important area where corporate networks play an important role. The coordination of roles between headquarters and subsidiaries in marketing activities within MNCs is not deeply analyzed. Garnier (1982) and Harzing (1999) established that local market-oriented subsidiaries tend to have greater autonomy. This was explained by the need of MNCs to adapt their marketing to local market needs, which requires flexibility and greater autonomy of the subsidiaries. Taggart and Hood (1999) found that globally integrated subsidiaries tend to have low autonomy, and a significant negative link was found between export propensity and autonomy of the subsidiary. This outcome is in line with the results of Holm and Pedersen (2000) who claimed that an increasing role of corporate internal links would reduce the autonomy of the subsidiary (from Young, 2004, p.221).
In a recent paper, Hewett et al. (2003) set the goal of establishing the extent to which conditions internal and external to the subsidiary affect the relationship between these roles in marketing activities, and how that is related to product performance. Their findings suggested that the more closely headquarters and subsidiary roles in marketing activities are aligned with relational, industry and market conditions, the greater the market share tends to be. In other words they concluded that the more embedded is the subsidiary in external networks, the better is the performance. On the other hand this means that the more the firm is integrated into corporate export networks, the lower is the autonomy. From that a further conclusion is that the higher is
the market autonomy the lower should be the subsidiaries’ propensity to export. Based on that, the following hypothesis was proposed:
Hypothesis 2: A higher autonomy in marketing is reflected in a lower level of export propensity of the subsidiary
Subsidiary autonomy across business functions
The autonomy of subsidiaries according to business functions is a rather complicated area of research, which has produced conflicting views (see for detailed discussion Björkman, 2003). Hedlund (1981) stressed the idea that headquarters centralize issues of a strategic nature and leave operational issues in the hands of the subsidiary. More specifically, Hedlund found that finance is the most strategic issue, while most operational issues are about organization and personnel. A similar point had been made earlier by Garnier, Osborn, Galicia and Lecon (1979), but in addition they discovered that subsidiary autonomy tends to be highest in marketing issues. Results from the Young et al. (1985) study of 152 foreign subsidiaries in the UK indicated that decision areas that were most centralized were primarily financial (target ROI, dividend and royalty policies), together with marketing decisions concerning markets supplied and entering new foreign markets, and R&D and technology choices.
Edwards, Ahmad and Moss (2002) explained this outcome rather convincingly by stating that integrated issues are highly centralized whereas locally responsive issues are more decentralized. Financial issues are highly integrated and relevant to the whole MNC. Marketing is often directed towards the local market and hence marketing issues could be decentralized. Personnel management is dependent on local legislation and consequently requires local operation, which gives higher autonomy to the subsidiary in these matters. Several other authors like Martinez and Jarillo (1991) and Harzing (1999) discovered that local market-oriented subsidiaries tend to have greater autonomy. In general subsidiaries have greater autonomy over decisions where they have superior information.
The conclusion drawn from the preceding discussion is that the functional autonomy of subsidiaries is lowest in strategic issues like finance and highest in operational areas including domestic marketing and personnel management. Consequently if the subsidiary has reached a power position in the MNC, where it has obtained high autonomy in strategic issues like finance,
the subsidiary should have strong subsidiary-specific advantages and perform better than its counterparts.
Hypothesis 3: Subsidiaries with high autonomy in strategic areas (finance, strategic management) have better economic performance
Environment is another important factor that plays a role in the creation of the capabilities of subsidiaries and allows obtaining subsidiary-specific advantages. The literature shows that the more developed is the country in which the subsidiary is located, in the sense of demand, existence of potential sourcing partners and level of the national innovation system, the higher is the likelihood that the subsidiary could develop an extensive external network, improve different capacities, and finally gain more autonomy.
The majority of papers on the subject deal with the development of subsidiaries and their links with headquarters in the advanced market economies. Significantly less research has been undertaken into the subsidiaries of MNCs that are operating in emerging economies and in transition economies. On the other hand the emerging and transforming markets are economically fast-growing and structurally volatile. Consequently the external networks of subsidiaries in these countries are quickly changing, providing bases for much more rapid change in the capacities and also in their role in internal (corporate) networks (Hoskisson et al., 2000). This is especially true where the MNC internal network mainly consists of subsidiaries that are located in countries with a stable economic environment.
According to this approach we may assume that those Central and East European countries that started the transition process earlier (e.g. Hungary, Slovenia) succeeded in providing more opportunities for subsidiaries to create external networks and they should have more autonomous subsidiaries than those countries that started transition later (for instance Estonia and Slovakia). In the framework of our analysis this allows advancing the following hypothesis about the country level effect on autonomy:
Hypothesis 4: Subsidiaries located in the less developed transition countries have limited opportunities to develop extensive external networks and therefore possess a lower level of autonomy than in more developed countries
In the high-technology industries, corporate or internal embeddedness in the forms of intense, close and frequent relationships with suppliers, customers and R&D units might be expected to play a more important role than in low-technology industries. If this were the case, it would be logical to predict that in these industries the autonomy of subsidiaries is smaller. But based on the literature we may assume that the behaviour of high-tech subsidiaries in industrialized developed countries and in the transition countries may differ. Birkinshaw and Hood (2000) found surprisingly that subsidiaries of leading-edge industries located in industrialized countries were more autonomous and highly embedded in the local cluster than subsidiaries in other industrial sectors. But a rather different result was obtained in earlier work by Garnier (1982), who found that US subsidiaries located in Mexico were more autonomous than their counterparts in France. Furthermore, he found that different factors affected subsidiary autonomy in those countries. The major factor affecting subsidiary autonomy in France was the degree of integration into the corporate network. It turned out that high cooperation especially in the area of technology caused low autonomy in France. The high autonomy of Mexican affiliates indicated a much lower level of cooperation in the technology area.
This outcome could be explained by the strategy of MNCs to encourage subsidiaries to use knowledge flows from the rich host country environment in developed national innovation systems. But we assume that in the transition countries with relatively weak national innovation systems the knowledge acquisition of local subsidiaries from external networks is much more complicated. Based on previous discussion the following hypothesis is proposed:
Hypothesis 5: Subsidiaries from high-tech industries located in transition countries are more closely engaged in corporate networks and have lower autonomy than subsidiaries in low-tech industries
Autonomy and the size of MNC and subsidiary
The impact of the size of the MNC on the autonomy of subsidiaries has produced mixed results. Garnier (1982) found that the headquarters of large MNCs tend to give less autonomy to subsidiaries. More detailed analyses were executed by Gates and Egelhoff (1986), who found that a large MNC tends to grant less autonomy to subsidiaries in marketing issues, but more in financial issues.
On the other hand the size of the subsidiary might have a curvilinear (Hedlund, 1981) or a mixed (Young et al., 1985; Gates and Egelhoff, 1986) effect on subsidiary autonomy. In the former case the subsidiary has a lower level of autonomy at its foundation, then gains autonomy until a certain size and afterwards starts to lose autonomy again. Young et al. (1985) found that autonomy was lower in large subsidiaries and those with significant levels of exports to other group facilities. Gates and Egelhoff (1986) discovered that a subsidiary tends to gain manufacturing autonomy but lose marketing autonomy as it matures. In addition, they found that subsidiary age was positively related to its autonomy. However, Garnier (1982) found little support for age and size.
Hypothesis 6: More autonomous subsidiaries are to be found among large firms compared to small and medium-sized firms
2. Research method
Sample description and representativeness
The following analysis is based on the database created as the result of work on the EU Fifth Framework Project: “EU Integration and the Prospects for Catch-Up Development in Central and Eastern European countries (CEECs): The Determinants of the Productivity Gap”. A special questionnaire for Foreign Investment Enterprises (FIEs) was undertaken in 2001-2002. The target group was manufacturing enterprises with foreign ownership in Estonia, Hungary, Poland, Slovakia and Slovenia. The return rate was 19.7% or 433 questionnaires. The biggest number of responses (35.5% of the total) came from Poland, followed by Hungary with 18%, Slovakia 16.6%, Slovenia 16.6% and Estonia 11.5%. By industries, the biggest share in the total sample of responses was in the electrical and optical equipment branch (16.4% of the total), followed by metals and metal products (14.1%), food, beverages and tobacco (10.2%), non-metal mineral products (9.0%), chemicals and man-made fibres (8.5%), rubber and plastic products (6.9%), clothing and textiles (6.5%). Of all firms in the sample only 14.5% are minority foreign-owned (see detailed information about the sample in Männik et al., 2004).
The representativeness of the sample was analyzed according to size, ownership and industry position. Distribution of the firms by size is rather well balanced (see the comparative tables and
detailed explanations in Männik et al., 2004). Only the structures of Polish and Hungarian sample differ from other countries. The share of firms with more than 500 employees is around 25% in both countries. Small firms with less than 100 employees prevail in Estonia: the size of a country obviously has a major role in firm size. A comparison of mean ranks of the number of employees in the sample of FIEs by using the Mann-Whitney test (see Majcen et al., 2003) shows statistically significant differences of individual countries from the total sample average in the case of Slovenia and Hungary. Slovenian firms are significantly smaller and Hungarian firms significantly larger than total sample firms. A comparison of manufacturing sectors shows a significantly higher than average number of employees per company only in food, beverages and tobacco and transport equipment. In all other manufacturing sectors there are no statistically significant differences in the number of employees.
The sample is also quite well balanced by the distribution between industries and by the share of foreign ownership (see Table 4 in Männik et al.,2004). Poland is most strongly represented both in number of firms and in employment, which is in accordance with the high share of Poland in the total stock of FDI in manufacturing. Slovenia and Estonia are moderately over-represented and Hungary slightly under-represented. In addition representativeness could also be evaluated by comparing the number of firms included in the sample with the total number of firms with FDI in individual countries. From that point of view, sample firms represent 4.9% of all FIEs in the analyzed countries. The highest share (23.8%) is in Slovenia, followed by Estonia with 12.4%, Poland with 3.5% and Hungary with 2.1%.
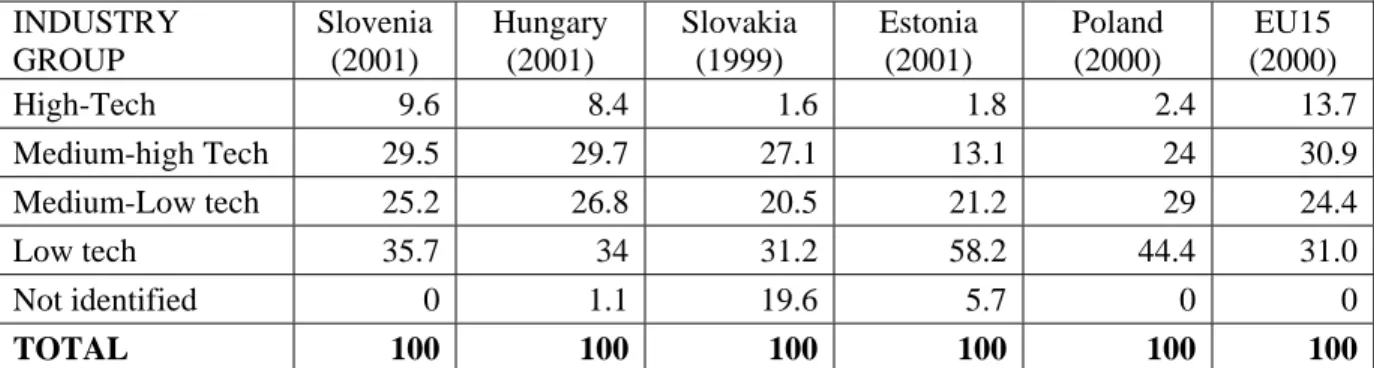
As the following analysis also requires some proxy for the development level of these five sample countries and differences between the types of the industry sectors (see the explanation in the next section), the value-added (as a % of total value-added in Table 1) and the productivity level is shown by country and by industry group (see Table 2). The structure of manufacturing industries of the countries analyzed in the paper is very different. The role of high-tech industries in producing manufacturing value-added varies from 9.6% in Slovenia down to 1.8% in Estonia and 1.6% in Slovakia. At the other end, the low-tech sectors were contributing 58% of value-added in Estonia or 44% in Poland. The structure of value-value-added in the manufacturing sectors in Slovenia and Hungary are much more like that of the EU15 than for the other three countries.
Table 1 The role of industrial sectors in the creation of the total manufacturing value-added
(as a % of total value-added)5 INDUSTRY GROUP Slovenia (2001) Hungary (2001) Slovakia (1999) Estonia (2001) Poland (2000) EU15 (2000) High-Tech 9.6 8.4 1.6 1.8 2.4 13.7 Medium-high Tech 29.5 29.7 27.1 13.1 24 30.9 Medium-Low tech 25.2 26.8 20.5 21.2 29 24.4 Low tech 35.7 34 31.2 58.2 44.4 31.0 Not identified 0 1.1 19.6 5.7 0 0 TOTAL 100 100 100 100 100 100
Source: Authors’ calculations based on UNIDO Statistical database
(http://www.unido.org/geodoc.cfm?cc=POL) and Slovenian National Statistics; Eurostat 2003
Table 2 presents a brief overview of the productivity of manufacturing industries of the analyzed countries based on the UNIDO database. It should be taken into consideration that all results are converted into USD. However even this comparison indicates clearly that Slovenia and Hungary are leading by value-added per employee in all categories of industries. The result is also in accord with the level of GDP per capita: Slovenian PPP-based GDP per capita was 74% of the EU average in 2002, Hungary 57%, Slovakia 47%, Estonia 42% and Poland 39% (Eurostat 2003).
Table 2 Value-added per employee in the manufacturing industries of five accession countries (in
USD annually) INDUSTRY GROUP Slovenia (2001) Hungary (2001) Slovakia (1999) Estonia (2001) Poland (2000) High-Tech 18849 14750 5290 6897 20508
Medium -High Tech 23485 30446 8395 10198 13360
Medium-Low Tech 18210 18383 8029 9746 14954
Low Tech 15870 10128 6970 7334 12063
TOTAL 18993 18753 7687 8263 13451
Source: Authors’ calculations based on UNIDO Statistical database
(http://www.unido.org/geodoc.cfm?cc=POL) and Slovenian National Statistics
5
Interesting results are obtained from Table 2, which indicate that medium-high industries have much higher productivity than high-tech industries. In the case of Hungary, the difference is 2.1 times and in Slovenia 1.2 times (a similar pattern was also found in Slovakia and Estonia). Poland was the only country where the high-tech sectors had the highest productivity. Another interesting result concerns the bigger dispersion of productivity levels between low, medium-low and medium-high tech industries in Slovenia and Hungary. In other countries there were only minor differences in productivity levels.
The analysed countries also differed by the speed of creating themselves as attractive locations for FDI inflow. Slovenia enjoyed a very early inflow of FDI, as in 1990 the stock of FDI was already USD 666m (UNCTAD, 2004). Hungary was another country that started to attract FDI at an early stage, with an extremely rapid increase between 1990 and 1994, when the stock of FDI in Hungary increased 21 times from USD 569m up to 11919m (UNCTAD, 2004). On the other hand Estonia and Slovakia received their first FDI only in 1991, and rapid growth started only during the second half of the 1990s.
Analysis method and variables
In the current paper the autonomy of subsidiaries is measured by business functions. The survey asked about the decision-making processes between the local affiliate and the parent company. The question asked was: Which business functions are being undertaken: a) on your own only, (b) mainly on your own, (c) mainly by your foreign owner, or (d) by your foreign owner only? From the survey answers were received about 13 business functions: product development, process engineering, determining the product price, supply and logistics, accounting and finance operations, investment finance, market research, distribution and sales, after-sales services, advertising, marketing, operational management, and strategic management of planning. Answers to questions were later standardized so that 0 indicated full autonomy in decision-making (taken on your own only) and 1 complete lack of autonomy.
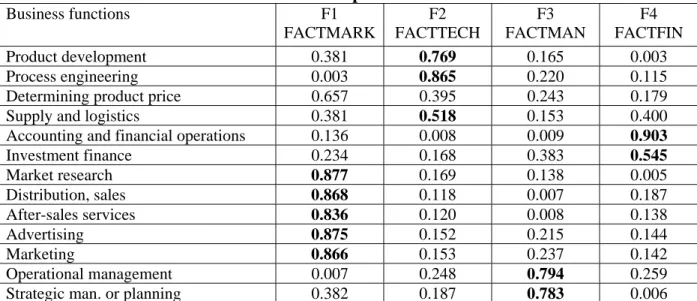
The analysis was carried out in three stages. Because the business functions used in the survey were closely interrelated it was necessary to use methods that allowed creating statistically independent factors describing the internal structure of autonomy. Therefore the first stage of analysis involved principal component factor analysis to group the 13 business functions.
Proceeding from the latter approach, we received four new statistically independent factors, identified as: FACTMARK – related to the following business functions: determining the product price, market research, distribution and sales, after-sales services, advertising, marketing; FACTTECH – including product development, process engineering, supply and logistics; FACTMAN – including operational management, strategic management or planning; and FACTFIN – including accounting and finance of operations, investment finance (see Table 3).
Table 3 Rotated Component Matrix
Business functions F1 FACTMARK F2 FACTTECH F3 FACTMAN F4 FACTFIN Product development 0.381 0.769 0.165 0.003 Process engineering 0.003 0.865 0.220 0.115
Determining product price 0.657 0.395 0.243 0.179
Supply and logistics 0.381 0.518 0.153 0.400
Accounting and financial operations 0.136 0.008 0.009 0.903
Investment finance 0.234 0.168 0.383 0.545 Market research 0.877 0.169 0.138 0.005 Distribution, sales 0.868 0.118 0.007 0.187 After-sales services 0.836 0.120 0.008 0.138 Advertising 0.875 0.152 0.215 0.144 Marketing 0.866 0.153 0.237 0.142 Operational management 0.007 0.248 0.794 0.259
Strategic man. or planning 0.382 0.187 0.783 0.006
At the following stage the impact of four factor components reflecting different dimensions of autonomy on the level of the subsidiary performance was measured by using ordered regression models. This model was used as it is specially designed for cases where the dependent variable is measured by surveys and has values which are in growing or declining order. In the survey we asked companies to evaluate the magnitude of the changes of four categories: share of exports, productivity level in production, technology level of production equipment and level of product quality, once the explored manufacturing companies had received foreign investment involvement (becoming a foreign investment enterprise). In answering the following options were allowed: considerable reduction, reduction, no change, increase or considerable increase during the examined period. Answers were scaled between 0 and 1.
Through the ordered regression we can finally see the impact of four different types of the autonomy (technology, marketing, management, financing) on the performance of subsidiaries. In the analysis two types of the ordered regression models were performed, of which one was executed only for the four factor clusters and the other included in addition control variables in the form of categorical variables about countries (DCOUNTRY), industry type (DACTIVITY), firm size (DEMPLOY), foreign ownership (DEQUITY) and the year of establishment on the subsidiary (DESTBL). In the following discussion the results of the latter regression models are presented. Where reasonable the results of the first model are commented on in parallel with these other results.
Industries were grouped into four types of sectors: high-tech, high-tech, and medium-low-tech and medium-low-tech, using the 3-digit NACE level classification of manufacturing industries according to OECD classification (see footnote 5). By size firms were divided into two groups: small and medium size enterprises (below 250), and large enterprises (250 or more employees). Foreign ownership was distinguished by minority (below 50%) and majority (equal to or above 50%). The ANOVA test was performed individually for each categorical variables and a MANOVA test in a compound way (all variables taken into the test) across all four factors. The full results of the analyses are presented in the paper by Männik et al., 2004.
3. Results and discussion
Change in productivity level in production
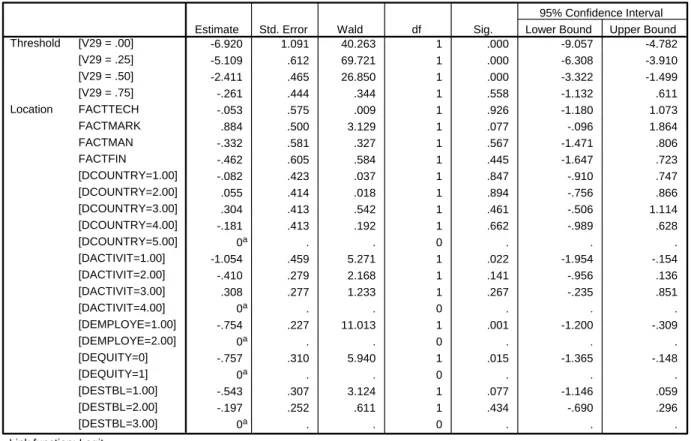
We first estimate the impact of the four components of autonomy on the change in levels of productivity (see Table 4), technology and product quality in manufacturing companies in the five CEE countries. Those three performance measures could give us some significant indicators of the technology upgrading and innovation potential in the economies under discussion.
Earlier the four aspects of autonomy were measured in such a way that increase of the value of the factor component means a reduction of autonomy. Therefore regression estimates of the ordered regression result should be read in the way that shows the impact of the reduction of this aspect of autonomy on the dependent variable. In the case of analyzing the impact of the four components of autonomy on the change of productivity level, only the marketing autonomy
component FACTMARK turned out to be statistically significant. Consequently from Table 4 one can read that, for an increase of the FACTMARK by 1 unit (which means a reduction of marketing autonomy), the productivity level grows by 0.884 units. Hence there is a positive impact of lower marketing autonomy on the level of productivity in production (parameter estimate=0.884, p-value=0.077). The lower the marketing autonomy the higher the growth in productivity level in the foreign subsidiaries. This outcome is valid for the group of all subsidiaries across the five countries. Country control variables were not statistically significant (see DCOUNTRY in Table 4). The result means that subsidiaries that were given high autonomy in marketing were actually not supported by the parent company in creating subsidiary-specific advantages and their technological capacity should be low. But this will be analyzed further by the other indicators of performance, reflecting more directly the technological change in subsidiaries.
Table 4 Results of ordered regression (dependent variable – change in level of productivity in
production)6 Parameter Estimates -6.920 1.091 40.263 1 .000 -9.057 -4.782 -5.109 .612 69.721 1 .000 -6.308 -3.910 -2.411 .465 26.850 1 .000 -3.322 -1.499 -.261 .444 .344 1 .558 -1.132 .611 -.053 .575 .009 1 .926 -1.180 1.073 .884 .500 3.129 1 .077 -.096 1.864 -.332 .581 .327 1 .567 -1.471 .806 -.462 .605 .584 1 .445 -1.647 .723 -.082 .423 .037 1 .847 -.910 .747 .055 .414 .018 1 .894 -.756 .866 .304 .413 .542 1 .461 -.506 1.114 -.181 .413 .192 1 .662 -.989 .628 0a . . 0 . . . -1.054 .459 5.271 1 .022 -1.954 -.154 -.410 .279 2.168 1 .141 -.956 .136 .308 .277 1.233 1 .267 -.235 .851 0a . . 0 . . . -.754 .227 11.013 1 .001 -1.200 -.309 0a . . 0 . . . -.757 .310 5.940 1 .015 -1.365 -.148 0a . . 0 . . . -.543 .307 3.124 1 .077 -1.146 .059 -.197 .252 .611 1 .434 -.690 .296 0a . . 0 . . . [V29 = .00] [V29 = .25] [V29 = .50] [V29 = .75] Threshold FACTTECH FACTMARK FACTMAN FACTFIN [DCOUNTRY=1.00] [DCOUNTRY=2.00] [DCOUNTRY=3.00] [DCOUNTRY=4.00] [DCOUNTRY=5.00] [DACTIVIT=1.00] [DACTIVIT=2.00] [DACTIVIT=3.00] [DACTIVIT=4.00] [DEMPLOYE=1.00] [DEMPLOYE=2.00] [DEQUITY=0] [DEQUITY=1] [DESTBL=1.00] [DESTBL=2.00] [DESTBL=3.00] Location
Estimate Std. Error Wald df Sig. Lower Bound Upper Bound
95% Confidence Interval
Link function: Logit.
This parameter is set to zero because it is redundant. a.
From Table 4 the role of control variables on the change of the productivity level in production can also be distinguished. The results are given in the form of a benchmark indicator (for example DACTIVIT=4 or low-tech industries being compared with others). Consequently we could argue that subsidiaries in the high-tech sector (DACTIVIT=1) have a significantly smaller contribution to the growth of the productivity level compared to low-tech industry (parameter estimate=-1.054, p-value=0.022). We know already from the previous analysis that high-tech industries in CEE countries are less productive (measured by value-added, see Table 2)
6
Independent categorical variables for Tables 4-8: dcountry (1 – Slovenia, 2 – Poland, 3 – Hungary, 4 – Slovakia, 5 – Estonia), dactivit (1 – high-tech industry, 2 – medium high-tech industry, 3 – medium tech industry, 4 – low-tech industry), demploye (1 – SME, 2 – large firm), dequity (0 – minority foreign ownership, 1 – majority foreign ownership), destbl (1 – before 1990, 2 – between 1991-1995, 3 – after 1996); model fitting (chi-square 40.562, sig. 0.000); goodness-of-fit (Pearson chi-square 1570.587, sig. 0.000).
compared to medium-high, medium-low or even low-tech industries (except in Poland). The result from the ordered regression model supports this rather surprising fact.
Going further, large firms seem to have bigger productivity capabilities, as well as majority-owned foreign subsidiaries and those firms with a year of registration as a foreign investment enterprise after 1996. Therefore, from the perspective of the host economy, the establishment of new foreign investment enterprises (FIEs) should be stimulated, as well as those larger in number of employees and foreign involvement. Concerning the year of establishment of the subsidiary, the productivity indicator is the only performance measure where it does show a clear effect.
Change in technology level of production equipment
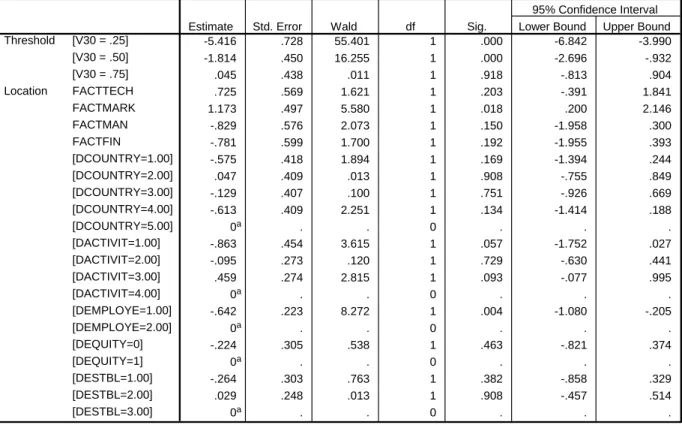
Table 5 below shows that in terms of change in technological level of production equipment, this was statistically significantly affected only by marketing autonomy (FACTMARK). The lower the autonomy in marketing the bigger the improvement in the technology level of the production equipment (parameter estimate=1.173, p-value=0.018). This supports our results from the previous analyses and indicates that in subsidiaries with a low autonomy in marketing the whole technological capacity creation process is stronger. Low autonomy in marketing is associated with positive changes both in the technological improvement of production equipment and also in the productivity level. The financial and managerial autonomy of the subsidiary (FACTFIN, FACTMAN) affects positively the change in the technological level of production equipment, but it is still not statistically significant. A bigger technological autonomy (FACTTECH) affects negatively the change in the technological level of production equipment, but is also not statistically significant. This sign of the estimate fits with the discussion about the important role of the local environment on the technological autonomy offered by the parent company. In the transition countries with weakly developed national innovation systems and relatively low technology level competitors, high technological autonomy actually means that the subsidiary could not use corporate networks as channels for creating subsidiary-specific capacities in technology, and this ends up as a lesser improvement in performance indicators.
improvement in technology of production equipment (parameter estimate= -0.863, p-value=0.057) and subsidiaries in medium-low-tech sectors experienced higher improvement in production technology (.459, 0.093). The result is surprising from the perspective of an expected bigger technological intensity in high-tech sectors in comparison with low-tech sectors. This means that the high-tech sector in those economies does not support rapid productivity growth, nor does it experience the most rapid improvements in the technologies of production. This could be explained by the much lower level of production technology in the low and middle-high tech industries, which could therefore achieve much more rapid growth in the technology of production over time. But it may also indicate that foreign firms have used much more new technology in the production of low and middle-tech products, reaping benefits of factor cost differentials in labor costs. Therefore they did not invest intensively in technological change in the high-tech industries of the analyzed countries. Another explanation could be that external links of subsidiaries in the technology area could be weak. The inflow of technological knowledge from the mother company is weak because it is taken to be a misuse of resources to invest in these subsidiaries in the environment of underdeveloped national innovation systems. As expected, the level of production technology improvement in large firms is bigger compared to SMEs.
Table 5 Results of ordered regression (dependent variable – change in level of technology of
production equipment)7 Parameter Estimates -5.416 .728 55.401 1 .000 -6.842 -3.990 -1.814 .450 16.255 1 .000 -2.696 -.932 .045 .438 .011 1 .918 -.813 .904 .725 .569 1.621 1 .203 -.391 1.841 1.173 .497 5.580 1 .018 .200 2.146 -.829 .576 2.073 1 .150 -1.958 .300 -.781 .599 1.700 1 .192 -1.955 .393 -.575 .418 1.894 1 .169 -1.394 .244 .047 .409 .013 1 .908 -.755 .849 -.129 .407 .100 1 .751 -.926 .669 -.613 .409 2.251 1 .134 -1.414 .188 0a . . 0 . . . -.863 .454 3.615 1 .057 -1.752 .027 -.095 .273 .120 1 .729 -.630 .441 .459 .274 2.815 1 .093 -.077 .995 0a . . 0 . . . -.642 .223 8.272 1 .004 -1.080 -.205 0a . . 0 . . . -.224 .305 .538 1 .463 -.821 .374 0a . . 0 . . . -.264 .303 .763 1 .382 -.858 .329 .029 .248 .013 1 .908 -.457 .514 0a . . 0 . . . [V30 = .25] [V30 = .50] [V30 = .75] Threshold FACTTECH FACTMARK FACTMAN FACTFIN [DCOUNTRY=1.00] [DCOUNTRY=2.00] [DCOUNTRY=3.00] [DCOUNTRY=4.00] [DCOUNTRY=5.00] [DACTIVIT=1.00] [DACTIVIT=2.00] [DACTIVIT=3.00] [DACTIVIT=4.00] [DEMPLOYE=1.00] [DEMPLOYE=2.00] [DEQUITY=0] [DEQUITY=1] [DESTBL=1.00] [DESTBL=2.00] [DESTBL=3.00] Location
Estimate Std. Error Wald df Sig. Lower Bound Upper Bound
95% Confidence Interval
Link function: Logit.
This parameter is set to zero because it is redundant. a.
Change in level of product quality
Based on the above analysis it is not surprising to find that low marketing autonomy and high financing autonomy played a positive role in terms of changes in level of product quality (see respectively parameter estimate=1.284, p-value=0.010; -1.631, 0.007 in Table 6). The smaller the subsidiaries’ autonomy in marketing and the bigger the autonomy in financing, the greater the experienced improvement in the quality level of products. This indicates that bigger financial autonomy reflects a subsidiary that has already obtained a solid level of production technology combined with strong improvements in the quality of products. The received results also indicate that financial and marketing autonomy are somewhat reciprocal to each other. A higher autonomy in marketing indicates that the subsidiary is involved in the production of relatively
low-tech products and the improvement of product quality, but also the production technology is relatively limited. On the other hand, bigger financial autonomy reflects positive improvements in the quality level and technology, and provides better potential for capacity growth.
Country-specific variables were important in this case. In the country effects analyses, Estonia was used as the benchmark (DCOUNTRY=5 as redundant). Statistically significant conclusions are that in Slovenia improvement in the quality of products was weaker compared to Estonia (estimate -1.083). This difference between Slovenia and Estonia could be explained by differences in the development level of the two countries reflected in the different starting position of subsidiaries as foreign-owned firms. In Slovenia the general economic development level and also productivity level were much higher than in Estonia in the early and mid nineties. Similarly to previous results medium-low-tech firms have contributed more to the level of quality of products compared to other industry sectors, as well as large foreign subsidiaries.
Table 6 Results of ordered regression (dependent variable – change in level of quality of product)8
Parameter Estimates -6.781 1.097 38.186 1 .000 -8.932 -4.630 -1.998 .454 19.394 1 .000 -2.887 -1.109 -.224 .440 .261 1 .610 -1.086 .637 .550 .569 .933 1 .334 -.566 1.665 1.284 .501 6.582 1 .010 .303 2.265 -.781 .579 1.822 1 .177 -1.915 .353 -1.631 .605 7.264 1 .007 -2.818 -.445 -1.083 .421 6.599 1 .010 -1.908 -.257 .089 .410 .047 1 .829 -.715 .892 -.632 .407 2.417 1 .120 -1.429 .165 -.227 .411 .304 1 .581 -1.032 .578 0a . . 0 . . . -.684 .453 2.280 1 .131 -1.572 .204 -.002 .274 .000 1 .995 -.538 .535 .452 .274 2.725 1 .099 -.085 .989 0a . . 0 . . . -.485 .224 4.693 1 .030 -.924 -.046 0a . . 0 . . . -.217 .306 .503 1 .478 -.817 .383 0a . . 0 . . . -.360 .303 1.412 1 .235 -.955 .234 .013 .249 .003 1 .957 -.475 .501 0a . . 0 . . . [V31 = .3] [V31 = .5] [V31 = .8] Threshold FACTTECH FACTMARK FACTMAN FACTFIN [DCOUNTRY=1.00] [DCOUNTRY=2.00] [DCOUNTRY=3.00] [DCOUNTRY=4.00] [DCOUNTRY=5.00] [DACTIVIT=1.00] [DACTIVIT=2.00] [DACTIVIT=3.00] [DACTIVIT=4.00] [DEMPLOYE=1.00] [DEMPLOYE=2.00] [DEQUITY=0] [DEQUITY=1] [DESTBL=1.00] [DESTBL=2.00] [DESTBL=3.00] Location
Estimate Std. Error Wald df Sig. Lower Bound Upper Bound
95% Confidence Interval
Link function: Logit.
This parameter is set to zero because it is redundant. a.
Change in export orientation
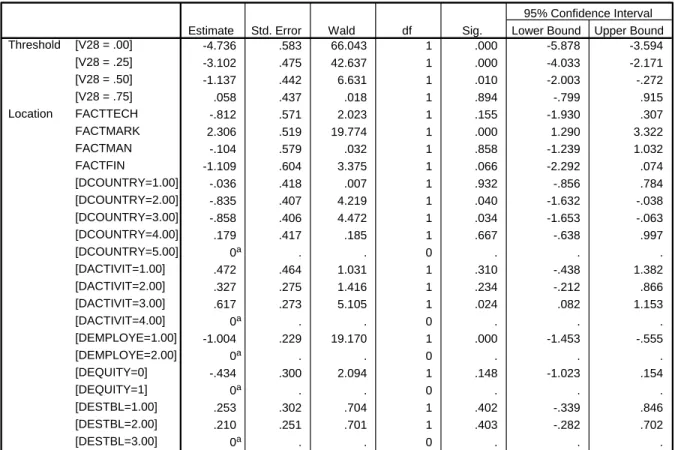
Finally we turn attention to the effects of autonomy on the change in export orientation, measured as the change in the share of exports from output (see Table 7). We can clearly see the differences in autonomy categories. The smaller the marketing autonomy in CEE countries the bigger the growth of export orientation (parameter estimate=2.306, p-value=0.000). This shows clearly that in countries where local subsidiaries were given high autonomy they were mainly oriented toward the domestic market. On the other hand in countries where the local subsidiaries were given less autonomy the export orientation was higher and growing much more rapidly than in high marketing autonomy countries (especially in Poland). The opposite result is received for financing autonomy. Greater autonomy in financing has provided a bigger positive change in the growth of export orientation in the examined countries (-1.109, 0.066). Therefore, high financing
autonomy is beneficial in terms of export orientation growth. If we do not take into account country-, industry- or firm-specific features (running the ordered regression only for factor clusters) then we could also see that higher technology autonomy in subsidiaries had contributed more significantly to increase in the share of exports (-1.097, 0.039). Low mandates in marketing and high mandates in financing or in the technology area are then having positive effects on export orientation in the five CEE countries.
Table 7 Results of ordered regression (dependent variable – share of exports)9
Parameter Estimates -4.736 .583 66.043 1 .000 -5.878 -3.594 -3.102 .475 42.637 1 .000 -4.033 -2.171 -1.137 .442 6.631 1 .010 -2.003 -.272 .058 .437 .018 1 .894 -.799 .915 -.812 .571 2.023 1 .155 -1.930 .307 2.306 .519 19.774 1 .000 1.290 3.322 -.104 .579 .032 1 .858 -1.239 1.032 -1.109 .604 3.375 1 .066 -2.292 .074 -.036 .418 .007 1 .932 -.856 .784 -.835 .407 4.219 1 .040 -1.632 -.038 -.858 .406 4.472 1 .034 -1.653 -.063 .179 .417 .185 1 .667 -.638 .997 0a . . 0 . . . .472 .464 1.031 1 .310 -.438 1.382 .327 .275 1.416 1 .234 -.212 .866 .617 .273 5.105 1 .024 .082 1.153 0a . . 0 . . . -1.004 .229 19.170 1 .000 -1.453 -.555 0a . . 0 . . . -.434 .300 2.094 1 .148 -1.023 .154 0a . . 0 . . . .253 .302 .704 1 .402 -.339 .846 .210 .251 .701 1 .403 -.282 .702 0a . . 0 . . . [V28 = .00] [V28 = .25] [V28 = .50] [V28 = .75] Threshold FACTTECH FACTMARK FACTMAN FACTFIN [DCOUNTRY=1.00] [DCOUNTRY=2.00] [DCOUNTRY=3.00] [DCOUNTRY=4.00] [DCOUNTRY=5.00] [DACTIVIT=1.00] [DACTIVIT=2.00] [DACTIVIT=3.00] [DACTIVIT=4.00] [DEMPLOYE=1.00] [DEMPLOYE=2.00] [DEQUITY=0] [DEQUITY=1] [DESTBL=1.00] [DESTBL=2.00] [DESTBL=3.00] Location
Estimate Std. Error Wald df Sig. Lower Bound Upper Bound
95% Confidence Interval
Link function: Logit.
This parameter is set to zero because it is redundant. a.
Looking at the country characteristics, there is seen to be a smaller change in export orientation in subsidiaries in Poland (parameter estimate=-0.835, p-value=0.040) and in Hungary (-0.858, 0.034) in comparison with Estonia. Next, subsidiaries from the medium-low-tech industry sector have had bigger changes in export share compared to counterparts in low-tech (0.617, 0.024) or
9
even medium-high-tech and high-tech industries. And finally, SMEs had lower growth in export orientation in relation to large firms (-1.004, 0.000).
Taking change in export orientation as the focus, we could clearly show the diversities of the four types of the autonomy and how they influence the performance of subsidiaries in Central and Eastern Europe. From the perspective of the host country, bigger marketing autonomy (as in Polish subsidiaries) decreases the growth of export orientation, bigger financing and technology autonomy increases the growth of export orientation. Larger domestic markets (like in Poland and Hungary) might not stimulate increasing export shares in those countries, which in turn do not get the direct or indirect effects accompanying exports. Export to more developed countries could be taken as one of the factors contributing to the technological level and innovation of the host country.
4. Conclusions
The results obtained supported clearly the basic research idea concerning the heterogeneity of autonomy. Using the technique of component factor analyses and ordered regression we were able to analyze links between four dimensions of autonomy and several indicators of performance of the subsidiary. The results supported the argument that the relationship between autonomy and performance depends on the type of autonomy. Marketing and finance are the most powerful dimensions of autonomy that influence different aspects of the performance of subsidiaries. They are like two ends of autonomy from the viewpoint of their impact on performance.
The higher the autonomy level in marketing activities in the five examined CEE countries the lower the effects either on technology upgrading (productivity level, technology level of production equipment and quality of produce) or on export shares. Marketing autonomy therefore is signaling that the subsidiary is not in a good position to create subsidiary-specific advantages. In addition high autonomy in marketing also indicates that the subsidiary is relatively domestic-market oriented and may be failing to learn from the export process. .
The second most powerful autonomy type is financing. The analysis shows that the higher the financing autonomy of the foreign subsidiaries the bigger the positive changes in all fields of performance (productivity level, export orientation, technology and product quality
improvements). Technological autonomy played a negative role on the performance of subsidiaries and shows how important it is to maintain deep corporate links for the subsidiaries located in technologically underdeveloped transition countries. This result was statistically significant only in the case of the model without any country-, industry- or firm-specific features. Analyses of control variables also supported the view that the performance of subsidiaries is also country-, industry- and firm-dependent. Basically, majority-owned, large and medium-low-tech foreign subsidiaries have achieved more extensive positive effects on their performance. The most surprising result was obtained for the industry variable. Subsidiaries from high-tech industries showed significantly smaller influences on either the productivity level of production or the improvement of the technological level of their production equipment, as compared to low-tech sectors. By country, differences in size of local market, development level and starting position as a foreign investment enterprise affect the subsidiaries’ performance. Estonia, which is one of the smallest by local market, one of the less developed among the examined CEE countries and one receiving foreign investments later than others, has achieved more significant effects on export orientation compared to Poland and Hungary, and on the improvement of the level of product quality compared to Slovenia. The year of establishment of the firm as a foreign investment enterprise has not generally played a significant role in terms of the subsidiaries’ performance except for the productivity level in production. Subsidiaries established from 1996 onwards compared to those created in or before 1990 have achieved larger productivity levels in production.
5. Implications and further research
The discussion of business implications of subsidiary autonomy leads us to the issue of host country effects of the foreign subsidiary. The higher autonomy of the subsidiary itself does not necessarily mean that the impact on the local economy is positive. For the host country it is much more important how the capacities and resources of the subsidiary are developing and how closely it is linked with host country industrial clusters. The host country should be interested in developing its national innovation system, creating human capital and using other economic policy tools to upgrade the business environment.
At the firm level, the management needs to combine the different areas of autonomy to gain maximally from the relation with headquarters located in some foreign country. There is the question of adapting appropriate tacit knowledge and also material assets to local specifications and of contributing to its own innovation potential (or absorptive capacities) through developmental work. In this development stage of the countries and firms it might be reasonable to have low rates of autonomy in some fields in view of shortages of specific knowledge (for example management in Poland) and higher rates of autonomy in selected fields with already appropriate tacit knowledge (for example marketing in Poland). For example in the analysed CEE countries a lower rate of technology autonomy is assumed to contribute more intensively to cooperation with the headquarters, and may also be useful to the host country.
It can be concluded that, from the perspective of technology and knowledge transfer through FDI and innovation potential, neither excessive dependence on the headquarters nor complete autonomy from headquarters is beneficial, especially in CEE countries today. Excessive dependence impedes the potential for increasing its own absorptive capacity and excessive independence might leave the local unit in a circle of “internationally uncompetitive” knowledge. Therefore, depending on the shortage of requisite knowledge, the managements in subsidiaries should be more or less active in relationships with headquarters. The relatively low technology autonomy in CEE countries is supposed to contribute to the knowledge and technology transfer.
Finally, turning attention to some shortcomings of the current analysis, the problems related to the representativeness of the countries in the sample might be noted. Poland was most strongly represented, Slovenia and Estonia moderately over represented and Hungary under represented. The results might be biased in favour of one or another country features. Secondly, in further research it would be reasonable also to use other measures apart from functional ones for estimating the autonomy in subsidiaries, taking into account the features of countries, industries and firms. Thirdly, it would be appropriate to relate the autonomy and/or performance of subsidiaries to the backward and forward linkages between foreign subsidiaries and domestic firms, in order to search for the existence of spillovers in the manufacturing sector in CEE countries.
References
1. Andersson, U. ‘Managing the transfer of capabilities within multinational corporations: the dual role of the subsidiary’. Scandinavian Journal of Management, Vol. 19, 2003, pp. 425-442.
2. Andersson, U.; Forsgren, M. ‘Subsidiary embeddedness and control in the multinational corporation’. International Business Review, 5(5), 1996. pp. 487-508.
3. Andersson, U.; Forsgren, M.; Pedersen, T. ‘The MNC as a differentiated network: subsidiary technology embeddedness and performance’. Uppsala University, Copenhagen Business School, 1999, 32 p.
4. Andersson, U., Forsgren, M., Pedersen, T. ‘Subsidiary performance in multinational corporations: the importance of technology embeddedness’. International Business Review,
2001, 10(1), 3-23.
5. Bartlett, C.A.; Ghoshal, S. ‘Tap your subsidiaries for global reach’. Harvard Business Review, Vol. 64(6), pp. 87-94.
6. Birkinshaw, J. ‘How multinational subsidiary mandates are gained and lost’. Journal of International Business Studies, Vol. 27, Issue 3, 1996, pp. 467–493.
7. Birkinshaw, J. ‘Entrepreneurship in multinational corporations: the characteristics of subsidiary initiative’. Strategic Management Journal, 18(3), 1997, pp.207-229.
8. Birkinshaw, J.Entrepreneurship in the global firm. London: 2000, Sage Publications. 9. Birkinshaw, J.; Hood, N. ‘An empirical study of development processes in foreign-owned
subsidiaries in Canada and Scotland’. Management International Review, Fourth Quarter, Vol. 37/4, 1997, pp. 339–364.
10.Birkinshaw, J.; Hood, N. ‘Multinational subsidiary evolution: capability and charter change in foreign owned subsidiary companies’. Academy of Management Review, Vol. 23/4, 1998, p. 773, 32 p.
11.Birkinshaw, J.; Hood, N. ‘Characteristics of foreign subsidiaries in industry clusters’.
Journal of International Business Studies, First Quarter 2000, 31, 1, p.141.
12.Birkinshaw, J.; Morrison, A. ‘Configurations of strategy and structure in multinational subsidiaries’. Journal of International Business Studies, Vol. 26/4, 1995, pp. 729–794. 13.Björkman, A. ‘Subsidiary power and autonomy’. 29th Annual EIBA Conference,
Copenhagen, December 11-13, 2003, 25 p.
14.Cohen, W., Levinthal, D. ‘Absorptive capacity: a new perspective on learning and innovation’. Administrative Science Quarterly 1990.
15.Edwards, M.; Ahmad, A.; Moss, S. ‘Subsidiary autonomy: the case of multinational subsidiaries in Malaysia’. Journal of International Business Studies, Vol. 33, No.1, 2002, pp. 183-191.
16.European Innovation Scoreboard 2003. Technical Paper No 4: Sectoral Innovation Scoreboards, European Trend Chart on Innovation, European Commission, November 2003, 60 p.
17.Garnier, G.H. ‘Context and decision-making autonomy in the foreign affiliates of U.S. multinational corporations’. Academy of Management Journal, 25(4), 1982, pp. 693-908 18.Gates, S.R., Egelhoff, W.G. ‘Centralization in headquarters-subsidiary relationships’.
Journal of International Business Studies, 17(2), 1986, pp. 71-92.
19.Ghoshal, S., Bartlett, C.A. ‘Creation, adoption and diffusion of innovations by subsidiaries of multinational corporations’. Journal of International Business Studies, 19 (3), 1988, pp. 365–388
20.Granovetter, M. ‘Economic action and social structure: the problem of embeddedness’.
American Journal of Sociology, 1985; 91(3): 481-510.
21.Gupta, A.K; Govindarajan, V. ‘Knowledge flows and the structure of control within multinational corporations’. Academy of Management Review, Vol. 16, No. 4, October 1991, pp. 768-792.
22.Gupta, A.K.; Govindarajan, V. ‘Organizing for knowledge flows within MNCs’.
International Business Review, Vol. 3, Issue 4 , December 1994, pp. 443-457.
23.Harzing, A.-W.K. Managing the multinationals: an international study of control mechanisms. Northampton, MA: 1999, Edward Elgar.
24.Hedlund, G. ‘Autonomy of subsidiaries and formalization of headquarters-subsidiary relationships in Swedish MNCs’, in L. Otterbeck (ed.) The management of headquarters-subsidiary relationships in multinational corporations (Aldershot, Gower, 1981).
25.Hewett, K., Roth, M.S., Roth, K. ‘Conditions influencing headquarters and foreign subsidiary roles in marketing activities and their effects on performance’. Journal of International Business Studies (2003) 34, 567–585.
26. Hoskisson, R.E., Eden, L., Lau, C., Wright, M. ‘Strategy in emerging economies’.
Academy of Management Journal, 2000, 43(3): 249–267.
27.Hunya, G. ‘Foreign direct investment in Central and Eastern Europe: a challenge of globalization and factor of stabilisation’. Club of Rome Symposium “How to Ride the Global Wave”, Bucharest, September 1999, 21 p.
28.Lane, P.J.; Lubatkin, M. ‘Relative absorptive capacity and interorganizational learning’.
Strategic Management Journal, 1998, 19: 461-478.
29.Luo, Y. ‘Capability exploitation and building in a foreign market: implications for multinational enterprises’. Organization Science, 2002, 13(1) pp. 48–63
30.Luo, Y. ‘Market-seeking MNEs in an emerging market: how parent–subsidiary links shape overseas success’. Journal of International Business Studies, 2003, 34, 290–309
31.Majcen, B., Radosevic, S., Rojec, M. ‘FDI subsidiaries and industrial integration of Central Europe: conceptual and empirical results’. Working paper, Ljubljana 2003.
32.Manhke, V.; Pedersen, T.; Verzin, M. ’The impact of knowledge management on MNC subsidiary performance: the role of absorptive capacity’. 29th Annual EIBA Conference, CBS, Dec 2003.
33.Marin, A., Bell, M. ‘Technology spillovers from direct investment (FDI): an exploration of the active role of MNC subsidiaries in the case of Argentina in the 1990s’ SPRU – Science and Technology Policy Research, University of Sussex. SPRU 2004.
34.Martínez, J.I.; Jarillo,J.C. ‘Coordination demands of international strategies’. Journal of International Business Studies, 22 (3), 1991, pp. 429-44.
35.Minbaeva, D., Pedersen, T., Björkman, I., Frey, C., Park, H.J. ‘MNC knowledge transfer, subsidiary absorptive capacity and HRM’. Working paper 14, Copenhagen Business School, December 2001
36.Männik, K.; Hannula, H.; Varblane, U. ‘Country, industry and firm size effects on foreign subsidiary strategy: an example of five CEE countries’. University of Tartu, Faculty of Economics and Business Administration, Working Paper Series, No. 27, 2004, 63 p.
37.Paterson, S.L.; Brock, D.M. ‘The development of subsidiary management research: review and theoretical analysis’. International Business Review, Vol. 11, 2002, pp.