Research Report for Office of Manpower Economics (OME)
Open Call for Research on Public Sector Pay and Workforces 2018
Understanding the Gender Pay Gap within the UK Public Sector
Melanie Jones
†*and Ezgi Kaya
††
Cardiff Business School, Cardiff University
*
IZA, Bonn
Final Report, August 2019
JEL classifications: J16; J31; J21; J24; J45; J48.
Keywords: Public sector, Pay Review Bodies, gender pay gap, pay discrimination, decomposition analysis, Annual Survey of Hours and Earnings, Quarterly Labour Force Survey.
Acknowledgements:
We gratefully acknowledge funding from the OME who supported this project under their 2018 Open Call for Research on Public Sector Pay and Workforces. The OME is an independent organisation that provides impartial secretariat support to the independent Pay Review Bodies. The work described in this report was carried out under contract as a part of OME’s research programme. The views and judgements expressed in this report are therefore those of the contractor and do not necessarily reflect those of the OME. We thank Nicola Allison, Andy Dickerson, Alex Bryson and Karen Mumford, and participants at OME’s Research Conference (March 2019) for useful comments on an earlier version of this report. Material from the Annual Survey of Hours and Earnings and the Quarterly Labour Force Survey is Crown Copyright, has been made available from the Office for National Statistics (ONS) through the UK Data Archive and has been used by permission. Although all efforts are made to ensure the quality of the materials, neither the original data creators, depositors or copyright holders, the funders of the data collections, nor the UK Data Archive, nor the UK Data Service bear any responsibility for the accuracy or comprehensiveness of these materials. This work uses research datasets which may not exactly reproduce National Statistics aggregates.
Executive Summary
Aims and approach
By applying established regression and decomposition methods to secondary data from the 2018 Annual Survey of Hours and Earnings (ASHE) and the 2016-2018 Quarterly Labour Force Survey (QLFS) this report aims to enhance our understanding of the drivers of the contemporary gender pay gap (GPG) within the UK public sector. This is done in several stages, including through comparisons between the public and private sector, and within the public sector on the basis of occupations covered by Pay Review Bodies (PRBs). In both cases we consider GPGs at the mean and then across the earnings distribution. Throughout our analysis we separate the raw hourly GPG into two elements to better understand its drivers. The first element is that part of the raw gap which can be explained by differences in observable personal and work-related characteristics between men and women, such as job tenure or contract type. The second element is that part of the raw gap which is not explained by the observable characteristics in our model and is closer to a measure of unequal treatment on the basis of similar characteristics. Evidence of the latter, or what we refer to as an unexplained GPG, is of particular interest given the remit of PRBs in relation to anti-discrimination legislation under the Equality Act (2010).
Key results and implications
Confirming previous evidence, our analysis of ASHE confirms that the raw GPG in the UK in 2018 is narrower within the public (19 per cent) than the private (21 per cent) sector. However, and in contrast to earlier studies, the unexplained component estimated using the Oaxaca–Blinder decomposition method is found to be at least as large within the public sector as the private sector. This questions the extent to which, as has previously been claimed, the public sector remains a ‘beacon of good practice’ in terms of gender equality and suggests renewed emphasis might be required.
Further exploration of the GPG across the distribution highlights a prominent ‘glass ceiling’ in the public, but not in the private sector. That is, the unexplained GPG is particularly pronounced towards the top end of the wage distribution in the public sector, where it accounts for most of the GPG.This suggests that, despite evidence of a compressed wage distribution, public sector employers need to pay particular attention to gender inequality among higher earners.
Comparisons within the public sector indicate that, on average, there is a narrower GPG in occupations covered by the five PRBs considered here, than those occupations that are not covered by PRBs. However, the GPG in PRB occupations is largely unexplained. As a result, the unexplained GPG is actually at least as large in PRB occupations as in non-PRB occupations, despite the remit of the PRBs. This reinforces the important distinction between the GPG as a measure of the average wage gap and the adjusted or unexplained GPG as a measure of earnings inequality. Analysis across the wage distribution also indicates a pronounced ‘glass ceiling’ in PRB occupations, confirming the need for attention beyond the mean GPG, and particularly towards the top end of the earnings distribution, within PRBs. There is, however, considerable heterogeneity identified across the five PRB occupations analysed, consistent with the increasing emphasis on within occupation analysis of the GPG and highlighting the need for greater recognition and exploration of differences within the public sector. The largest raw GPG is within the Review Body on Doctors’ and Dentists’ Remuneration (DDRB) (20 per cent) and it is narrowest in the NHS Pay Review Body (NHSPRB) (5 per cent) and Police Remuneration Review Body (PRRB) (8 per cent). The extent to which these can be explained by gender differences in productivity-related characteristics is relatively small and, as such, an unexplained GPG exists across all of the
PRBs. The magnitude of the unexplained GPG continues to vary across PRBs and is largest within the DDRB (15 per cent) suggesting the current review of the GPG in medicine is particularly timely.
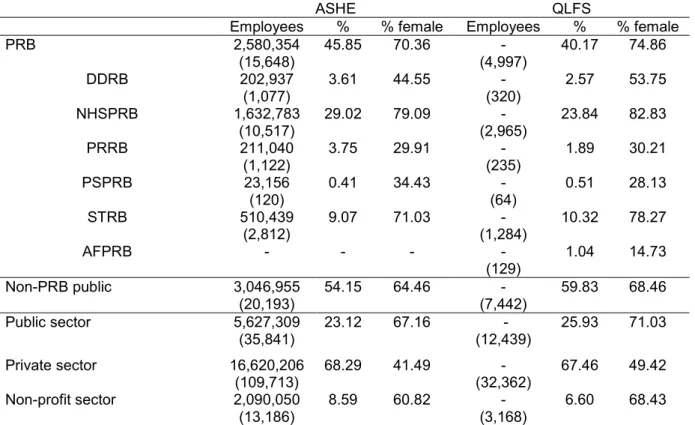
Although the analysis highlights substantial and largely unexplained gender differences in workforce composition across PRBs, including in the NHSPRB which is predominately female (nearly 80 per cent) and the PSPRB and PRRB which are predominately male (about 65-70 per cent), the contribution of gender differences in the allocation of women into and across PRBs within the public sector is found to play a relatively minor role in determining the public sector GPG. Indeed, while the raw public sector GPG would be 15 per cent if there was no gender difference in the probability of working across PRBs, it would only be 4 per cent if there were no GPGs within public sector occupations.
Although Performance Related Pay (PRP) is much less prevalent in the public than the private sector and, within PRBs in particular, there is evidence of an unexplained gender gap in the probability of receipt of PRP, with females less likely to receive PRP, particularly in the public sector. Conditional on receipt of PRP, there is also a gender gap in the amount of PRP, but this is considerably larger within the private sector. On this basis, future plans to introduce PRP in the public sector should pay particular attention to the potential drivers of the observed gender gap in receipt of PRP, that is, who receives PRP.
Limitations and extensions
The availability of reliable information on pay, and personal and work-related characteristics in our data is key to separating the explained and unexplained components of the GPG. Nevertheless, despite the comprehensiveness of the approach which combines analysis of ASHE and the QLFS, there will inevitably be important productivity-related characteristics which are unobserved (e.g. personality) or only partially captured within our analysis (e.g. actual labour market experience). As such, the unexplained gap can only ever be a proxy for wage inequality, and we cannot directly measure unequal pay or discrimination within this analysis. We further condition on the observable characteristics of workers in different sectors and occupations without accounting for the complex selection processes that determine who is in work and where they work, and the role of the employer, through for example occupational barriers, in such outcomes. More detailed analysis of gender differences in the probability of working across PRBs, which takes into account the complex relationships with subject choice and parental occupation, may be useful in this regard. The use of large scale, nationally representative, secondary data permits analysis across the public and private sector and facilitates comparison across PRBs. Nevertheless, to enhance the depth of analysis within specific PRB occupations it should be supplemented by further examination of specific occupations, including those within PRBs not covered by this report. This would be best achieved by using organisational administrative payroll data and a census of workers, rather than the relatively small samples available within these specific occupations in broader surveys. This would also facilitate a more detailed understanding of the role of the nature of pay scales and pay awards to gender pay equality, aligned to recent requirements in terms of reporting organisational GPGs.
Contents Page
List of tables 5
List of figures 7
Abbreviations 8
1. Introduction 9
1.1 Motivation and background 9
1.2 Research aims 11
2. Literature Review 13
2.1 Introduction 13
2.2 An overview of GPG theory 13
2.2.1 Human capital theory 13
2.2.2 Discrimination theories 14
2.3 Evidence 15
2.3.1 Drivers of the UK GPG 16
2.3.2 UK GPG across the earnings distribution 21
2.3.3 The role of the public sector 21
2.3.4 The role of occupation 23
2.3.5 PRP 25
3. Data and Methodology 27
3.1 Data sources and measures 27
3.2 Statistical methodology 33 4. Results 39 4.1 Descriptive statistics 39 4.1.1 Employment 39 4.1.2 Hourly pay 40 4.1.3 PRP 44 4.2 Econometric analysis 45
4.2.1 Between sector regression and decomposition analysis 45 4.2.2 Within public sector regression and decomposition analysis 51
4.2.3 PRP regression analysis 61
5. Conclusion 65
5.1 Key findings 65
5.2 Limitations and extensions 67
References 69
List of tables Page Table 1a. Sample statistics for explanatory variables, by sector 30
Table 1b. Sample statistics for explanatory variables, within the public sector 31
Table 2. Total number of employees and percentage female, by sector and within the
public sector 39
Table 3. Mean gross hourly pay (£), by sector and within the public sector 40
Table 4a. Incidence of PRP (per cent), by sector and within the public sector 45
Table 4b. Average amount of annual PRP conditional on receipt, by sector and within
the public sector 45
Table 5. OLS pay regression results, public and private sector 46
Table 6. Decomposition of the GPG, public and private sector 48
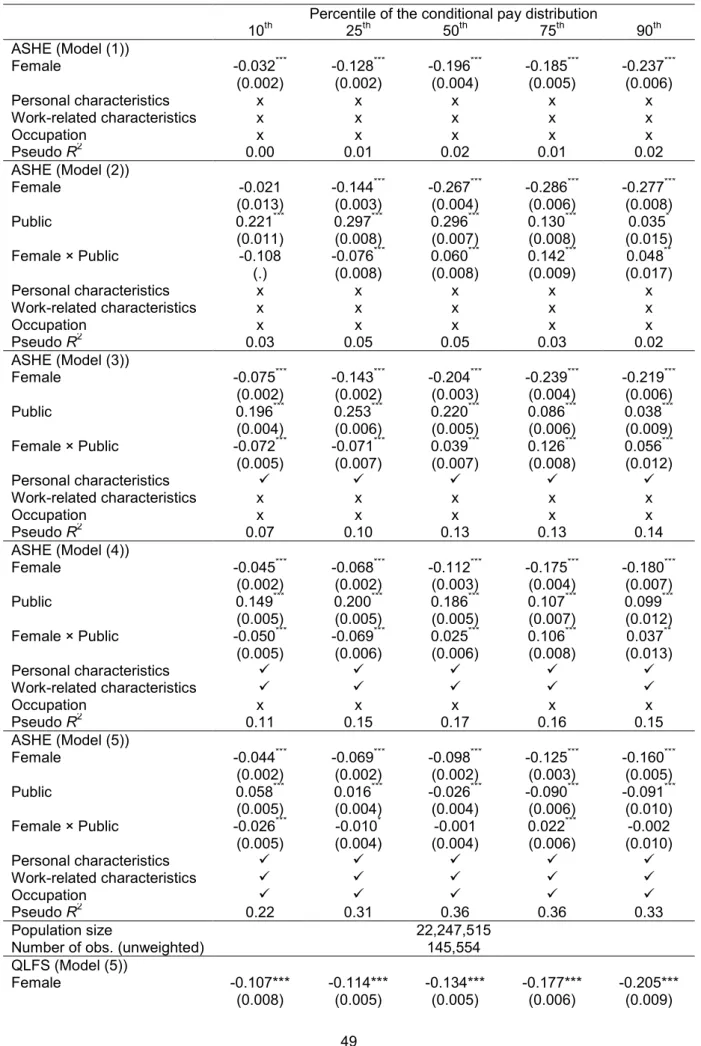
Table 7. Quantile pay regression results, public and private sector 49
Table 8. OLS pay regression results, public sector 52
Table 9. Decomposition of the GPG, public sector 53
Table 10. Quantile pay regression results, public sector 54
Table 11. OLS pay regression results, within the public sector 57
Table 12. GPG within the public sector, by PRBs 59
Table 13. Public sector occupational choice model (multinomial logit marginal effects) 60
Table 14. Within and between decomposition of the public sector GPG 61
Table 15a. Gender gap in the incidence of PRP, public and private sector (probit
model) 62
Table 15b. GPG in PRP, public and private sector (OLS regression results) 63
Table 16a. Gender gap in the incidence of PRP within the public sector (probit
model) 64
Table 16b. GPG in PRP within the public sector (OLS regression results) 64
Appendix
Table A.1. Defining PRB occupations 81
Table A.2. QLFS sample statistics for explanatory variables, by sector 83
Table A.3. QLFS Sample statistics for explanatory variables, within the public sector 85
Table A.4. Gross hourly pay (£) at selected percentiles, by sector 86
Table A.5. Gross hourly pay (£) at selected percentiles, public sector 86
Table A.6. Full ASHE OLS pay regression results, public and private sector 87
Table A.7. Full ASHE OLS pay regression results, public sector 89
Table A.8. Decomposition of the GPG, public and private sector, sensitivity analysis
Table A.9. Decomposition of the GPG, public and private sector, sensitivity analysis 92
Table A.10. Decomposition of the GPG, public sector, sensitivity analysis to hourly
pay measures 94
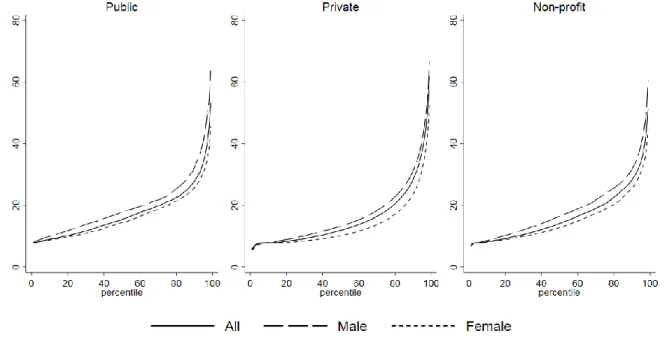
List of figures Page Figure 1a. Gross hourly pay (£) across the distribution, by sector 41
Figure 1b. Gross hourly pay (£) across the distribution, within the public sector 41
Figure 2a. Age-earning profiles, by sector 43
Figure 2b. Age-earning profiles, within the public sector 44
Figure 2c. Age-earning profiles, selected PRBs 44
Figure 3. Decomposition of the GPG across the distribution, public and private sector 51
Figure 4. Decomposition of the GPG across the distribution, public sector 56
Appendix
Figure A.1. QLFS decomposition of the GPG across the distribution, public and private
sector (Model (6)) 93
Figure A.2. QLFS decomposition of the GPG across the distribution, public sector
Abbreviations
AFPRB Armed Forces’ Pay Review Body AMEs Average Marginal Effects
ASHE Annual Survey of Hours and Earnings BHPS British Household Panel Study
DDRB Review Body on Doctors’ and Dentists’ Remuneration
GPG Gender Pay Gap
IDBR Inter-Departmental Business Register
NCARRB National Crime Agency Remuneration Review Body
NHSPRB NHS Pay Review Body
NMW National Minimum Wage
OLS Ordinary Least Squares
OME Office of Manpower Economics ONS Office for National Statistics
PRBs Pay Review Bodies
PRP Performance Related Pay
PRRB Police Remuneration Review Body PSPRB Prison Service Pay Review Body QLFS Quarterly Labour Force Survey SDS Secure Data Service
SIC Standard Industrial Classification SOC Standard Occupational Classification SSRB Senior Salaries Review Body
STRB School Teachers’ Review Body
UKDA UK Data Archive
USoc Understanding Society
1. Introduction
1.1 Motivation and background
The gender pay gap (hereinafter, GPG) has attracted increasing policy attention in the UK since the then Prime Minister announced his aim to “end the gender pay gap in a generation” (David Cameron, October 2015). The introduction of GPG reporting requirements for large organisations in 2017 formed part of a strategy to make GPGs more transparent and encourage employers to explore and address the drivers of their GPG. The publication in April 2018 of over 10,000 organisational GPGs, across both the public and private sector, and the associated media attention, together with the GPG among high paid employees at the BBC which emerged as a result of a requirement to disclose individual salaries, has further raised public, legal and media attention on the issue of gender inequality in the UK.1
The new reporting requirements extend the obligations of public sector organisations in England and statistical evidence confirms a consistent GPG in favour of men but also one that varies considerably across public sector organisations and has failed to narrow over time.2 Nevertheless, as a whole, the public sector has been found to have a narrowing
influence on the UK GPG, particularly through a lower within sector GPG but also through a relative concentration of women in the public sector, which on average offers a pay premium relative to the private sector (Jones et al., 2018). This report aims to provide an in-depth exploration of the contemporary drivers of the public sector GPG, focusing in particular on specific occupations within the public sector, principally those covered by the Pay Review Bodies (hereinafter, PRBs).3
The GPG, the difference in the average wage between men and women, is distinct from unequal pay or pay discrimination. The former is determined in part by unequal pay but is also a function of the distribution of women and men within the labour market (e.g. in terms of occupation), and their productive characteristics (e.g. education and work experience), often referred to as structural features of the labour market. In contrast, the latter is the pay gap that exists between comparable men and women, that is, after adjusting for differences in personal and work-related characteristics. The existence of an adjusted or ‘unexplained’ GPG, that is, between men and women with similar characteristics is aligned to the principle of ‘equal pay for work of equal value’ explicit within the NHS PRB Terms of Reference and the requirement across PRBs to take account of the broader legal environment in terms of anti-discrimination legislation under the Equality Act (2010). Nevertheless, information on the magnitude of the GPG and, that part which can be explained, or is due to differences in characteristics, remains important, with the government arguing GPG transparency informs female career choices in particular (Business in the Community, 2015).
In terms of academic research there has been considerable interest in quantifying the size of the public-private pay differential and tracking its movements over time, with a consistent
1 See, for example, public including campaigns such as #PayMeToo.
2 See for example,
https://www.theguardian.com/society/2018/mar/30/nine-out-of-10-public-sector-bodies-pay-men-more-than-women, https://www.channel4.com/news/public-sector-reveals-gender-pay-gap,
https://www.theguardian.com/world/2019/mar/31/gender-pay-gap-widens-public-sector-women-men and https://www.theguardian.com/society/2019/apr/03/nhs-trusts-gender-pay-gap-public-sector.
3 The OME provides the secretariat to eight PRBs which make recommendations on the pay of about 2.5 million workers or 45
per cent of public sector employees: Armed Forces’ Pay Review Body (hereinafter, AFPRB), Review Body on Doctors’ and Dentists’ Remuneration (hereinafter, DDRB), NHS Pay Review Body (hereinafter, NHSPRB), Prison Service Pay Review Body (hereinafter, PSPRB), School Teachers’ Review Body (hereinafter, STRB), Senior Salaries Review Body (hereinafter, SSRB), Police Remuneration Review Body (hereinafter, PRRB), National Crime Agency Remuneration Review Body (hereinafter, NCARRB). Due to data restrictions this report considers six of these, which we collectively refer to as PRBs throughout. We are unable to consider either the NCARRB or SSRB due to their limited coverage and occupational composition and we are only able to consider the AFPRB within our supplementary (Quarterly Labour Force Survey) datadue to the exclusion of the Armed Forces from the Annual Survey of Hours and Earnings. As such, our attention tends to focus on five PRBs.
finding being a greater raw and adjusted public sector pay premium for women (Blackaby et al., 2012; Cribb et al., 2014a). Consistent with this, analysis of the GPG by sector finds smaller gaps within the public than the private sector (see Chatterji et al., 2011; Stewart, 2014a; Jones et al., 2018). Moreover, such analysis finds that, although smaller in magnitude, a significant ‘unexplained’ pay gap exists within the public sector, a potential indicator of gender pay inequality. In contrast to the narrowing trend in the GPG since the 1970s, Jones et al. (2018) find that the raw GPG has been unchanged since 2010 across both sectors and this has been attributed to a stalling of the long-term narrowing of the ‘explained’ gender gap, or that women’s characteristics are no longer converging with men. Future narrowing might, therefore, require a more proactive approach, with particular attention on the unexplained pay gap, which has been largely flat in the public sector, despite the introduction of a range of equality initiatives, including most recently, the Public Sector Equality Duty 2011.
Occupational segregation by gender is a key feature of the UK labour market and an established determinant of the GPG (Blau and Kahn, 2000), with women being concentrated in lower paying occupations such as caring, leisure and other services. Within the public sector, PRBs cover occupations with pronounced gender segregation (e.g. nurses and the armed forces) and substantial variation in pay (e.g. nurses compared to medical practitioners). Such segregation is reflected in concerns about workforce diversity in selected PRBs such as the armed forces (AFPRB, 2017), where targets have been set to increase female recruits.4 However, recent analysis by Stewart (2015) shows that, in Britain, about
half of the GPG can be attributed to differences in the GPG within occupations and, occupations such as medical practitioners and prison service officers, both covered by PRBs, are among the twenty occupations found to have the highest GPG. The more disaggregated within occupation focus of this report is also aligned to recent attention within specific government departments.5
Although policy and public attention on the GPG tends to focus at the middle of the earnings distribution, making comparisons between the average man and woman, academic evidence is increasingly concerned with the entire pay distribution (see, for example, Arulampalam et al., 2007). Indeed, how the GPG and its unexplained and explained components vary across the distribution has the potential to enhance our understanding of the drivers of the GPG, including in relation to ‘glass ceilings’ and ‘sticky floors’ i.e. barriers for women at the top and bottom of the earnings distribution respectively. Such evidence is therefore important to inform and more effectively target government policies and PRB practices.
While the majority of evidence on the GPG examines a measure of usual hourly pay, recent organisational reporting highlights that gender bonus gaps are pronounced, consistent with bonuses being a less transparent form of pay. Although it remains relatively limited (Bryson
et al., 2017), there is increasing emphasis on performance related pay (hereinafter, PRP) in
the public sector, which has seen a movement from automatic progression to PRP as an incentive for effort. In exploring gender differences in the prevalence of PRP and providing some initial evidence in relation to the PRP GPG in the public sector, this project will provide insights on the potential implications of different payment systems for gender equality.6
4 Although we are unable to consider this explicitly, workforce diversity is a strategic priority for the SSRB, motivated by the
need to be more representative of society and the workforces for which they have responsibility (SSRB, 2017). Particular concerns are raised in relation to gender diversity among senior police officers and officers in the armed forces.
5 For example, in May 2018 the Secretary of State for Health and Social Care Jeremy Hunt promised to “eradicate the GPG in
medicine”. For further information see: https://www.rcplondon.ac.uk/news/rcp-president-professor-jane-dacre-lead-nhs-pay-gap-review.
6 Equality concerns have, for example, been raised in relation to pay progression and performance awards in the Prison
1.2 Research aims
This project aims to comprehensively explore the contemporary GPG in the UK public sector. It will quantify the size and determinants of the GPG across the public and private sector and within the public sector, in particular distinguishing between the influence of other personal and work-related characteristics to identify the unexplained pay gap which exists among otherwise comparable workers. In doing so, it will address the OME’s research interest in the ‘drivers of GPGs in public sector workforces’ but will also contribute to understanding gender diversity within individual PRB occupations. The analysis will be enhanced by consideration of the pay distribution and PRP.
The specific objectives of the research are as follows:
1. To measure and model the contemporary GPG in the public and private sector, at the mean and across the earnings distribution. To identify and distinguish between explained and unexplained components of the GPG to form an estimate of wage inequality and identify gender differences in personal and work-related characteristics which are important drivers of the public sector GPG.
2. To estimate the contribution of ‘within’ and ‘between’ occupation GPGs to the public sector GPG and to provide comparable evidence of GPGs between PRB and non-PRB occupations, and across PRB occupations. To further quantify pay inequality within PRB occupations and distinguish this from other drivers of PRB occupation GPGs.
3. To identify gender differences in the probability of working within PRB occupations and to examine the extent to which these differences are a result of gender differences in personal characteristics.
4. To further explore public sector gender gaps in rewards in relation to PRP and provide estimates of gender inequality in PRP as appropriate.
These aims will be achieved through undertaking econometric analysis of secondary data, predominately from the Annual Survey of Hours and Earnings (hereinafter, ASHE), a nationally representative and reliable source of earnings information in the UK. These data, which are based on mandatory reporting by employers to ONS, cover a 1 per cent sample of employee jobs from HMRC’s PAYE system, are made available annually and contain accurate information to identify sector and occupation, as well as a range of other personal and work-related characteristics which determine pay. Supplementary analysis will be performed on the Quarterly Labour Force Survey (hereinafter, QLFS), the largest household survey in the UK, which collects information on pay, sector and a comprehensive set of personal and work-related characteristics, but from individuals themselves. ASHE provides the ONS headline measure of the GPG but both data sources have been extensively used to explore public sector pay (see, for example, Bryson and Forth, 2017; Stewart, 2014a; Cribb
et al., 2014a; and Blackaby et al., 2012).
The analysis will have three core elements. First, analysis of the GPG will be undertaken between the public and private sector to explore the determinants of public sector GPG across the distribution and in comparison to the private sector. This will be followed by a more detailed analysis of the drivers of the GPG within the public sector and across PRB occupations in particular. In both cases the focus will be on quantifying the determinants of the GPG at the mean and across the earnings distribution through established regression and decomposition based approaches (Oaxaca, 1973; Blinder, 1973; Machado and Mata, 2005), which isolate the contribution of observable characteristics of workers and their jobs from unobserved influences, where the latter will include unequal treatment in the labour market. In addition to exploring the individual GPG for each PRB occupation, we also
quantify and model gender differences in the probability of working in different PRB occupations, allowing us to separate the role of ‘within’ and ‘between’ occupation GPGs to the overall public sector GPG.
Achieving these objectives will provide the following high quality and timely evidence relevant to government policy and the PRBs:
1. It will provide contemporary evidence after a period of public sector wage restraint in an era of austerity on differences in the size and drivers of the GPG across the earnings distribution and quantify the role of gender differences in characteristics and gender inequality in public sector GPGs. Further, understanding both explained and unexplained pay gaps will help to identify potentially effective levers for government policy in narrowing the UK GPG.
2. By providing the first evidence on GPGs within particular PRB occupations it will facilitate comparisons within the public sector and fill evidence gaps recognised by the PRBs (e.g. in relation to unexplained GPGs), in order to identify and inform areas in need of greater policy action, including in which occupations pay inequality appears to be most pronounced.7
Assessing the size of unexplained occupation GPGs will be particularly important in ensuring PRBs can evidence their commitment to relevant legal anti-discrimination obligations.8 At the
organisational level, this information could be used to inform the development of proactive action plans to address departmental GPGs as part of annual GPG reporting. Further, in comparing PRB occupations to the rest of the public sector, where pay is determined by collective bargaining, the analysis will also provide more general insights into differences within the public sector.
3. By providing the first consistent evidence on the scale and drivers of gender segregation within PRB occupations it will facilitate comparisons across PRBs and enhance OME understanding of workforce diversity within PRBs. This will be useful in predicting the impact of structural change and differential investment across government departments and in considering issues of recruitment and retention in relation to gender. Further, in using this information to identify that part of the public sector GPG which is driven by the allocation of men and women across PRBs, rather than that which is due to GPGs within PRBs, it will provide further evidence on the drivers of the public sector GPG.
4. By providing the first evidence on GPGs in PRP by sector, and within the public sector, the analysis will provide insights into the impact of different pay systems on pay inequality. The remainder of the report is structured as follows. Chapter two provides an overview of relevant economic theory and summarises the extensive empirical evidence in this area, focusing particularly on the UK. Chapter three outlines the principal data source, ASHE, in detail and explains the use of supplementary data from the QLFS. It also describes and discusses the measures and introduces the statistical methods employed. Chapter four presents and discusses the results. Chapter five concludes and provides some areas for future research.
7 The analysis will be complementary to specialised and occupation specific evidence, for example, that arising from the
recently commissioned review of the GPG in medicine which will use data based on departmental pay records.
8 The NCARRB (2018) explicitly recognise and are making efforts to address risks of equal pay litigation. The STRB (2019) also
2. Literature Review 2.1 Introduction
In what follows, we briefly summarise the main theories that have been commonly used in the literature to explain the GPG, namely human capital and discrimination theories. Then, based on findings from previous empirical research, we discuss the main drivers of the UK GPG. These include productivity-related characteristics (e.g. education and work experience) and pay discrimination, but also the distribution of women and men within the labour market (e.g. occupation and public/private sector) and other institutional factors. Then we review the findings of the existing literature on the sectoral and occupational differences in workforce composition and the GPG with a particular attention to the UK public sector and PRB occupations. Finally, we present the findings of previous studies on gender differences in PRP.
2.2 An overview of GPG theory
Several economic theories have been put forward to explain the GPG in the labour market. The main explanations can be classified into two general perspectives: The first one, human capital theory, explains the GPG based on the gender differences in observed productivity-related characteristics, and the second one attributes the pay differential to the unequal treatment of women in the labour market – discrimination theories. In this section, we outline these two theories and look at the findings of the empirical literature in relation to these.
2.2.1 Human capital theory
Human capital is a term that is used to refer to a person’s knowledge, skills or experience, which determine individual’s productivity in the labour market (see Schultz, 1960, 1961; Becker, 1964; Ben-Porath, 1967; Mincer, 1958, 1974). According to human capital theory, individual earnings depend on productivity and this is influenced by human capital which can be enhanced through investments in formal education and on-the-job training. This approach to the GPG suggests that women are paid less than men as a result of their lower human capital (Mincer and Polachek, 1974; Becker, 1985). According to this theory, traditional gender division of labour within the household results in women accumulating less human capital than men as women put less time and effort into market work or choose careers that are compatible with family responsibilities but for which on-the-job-training is less important (Mincer and Polachek, 1974; Becker, 1985). Women might also anticipate more interruptions in employment, mainly due to having children and, as a result, they have lower incentives to invest in formal education and on-the-job training (Becker, 1985). Moreover, interruptions in employment involve foregone time that could be used for further human capital accumulation and might result in depreciation of existing human capital (Mincer and Polachek, 1974; Sandell and Shapiro, 1980; Mincer and Ofek, 1982). Men, on the other hand, invest their time and effort in the labour market, enhancing their human capital and productivity, widening the gap between genders.
Historically human capital theory has been the most common approach to explaining gender differences in pay. One prominent method used in the literature to identify the role of human capital on the GPG has been the Oaxaca–Blinder decomposition, a regression-based decomposition method, which separates differences in average pay into a part that is explained by differences in human capital (e.g. education and work experience) and an unexplained component that is taken to reflect inequality in treatment (Oaxaca, 1973; Blinder, 1973). Using this type of decomposition analysis, recent studies show that, over the last few decades, human capital has become much less important in explaining the GPG. This is mainly due to the convergence between men and women in human capital investments, in particular to the increase in women’s relative education and work experience
(Goldin, 2014; Blau and Kahn, 2017).9 Previous studies for the UK also show that gender
differences in human capital explain a shrinking proportion of the GPG (see, for example, Grimshaw and Rubery, 2007; Joshi et al., 2007; Makepeace et al., 2004; Manning and Swaffield, 2008; Olsen et al., 2010). Indeed, a recent contribution by Jones et al. (2018) find that the downward trend in the explained differential has stalled since 2010 and that women’s human capital characteristics are no longer converging with men.
2.2.2 Discrimination theories
The fact that the GPG persists despite the women’s relative improvements in human capital suggests that the remaining unexplained difference in pay between men and women may be driven at least partially by the persistence of discrimination (Brynin, 2017). Labour market discrimination is defined as “a situation in which persons who provide labour market services and who are equally productive in a physical or material sense are treated unequally in a way that is related to an observable characteristic such as race, ethnicity, or gender” (Altonji and Black, 1999). Economic theories put forward a number of reasons why labour market discrimination may arise. The first, by Becker (1957), is personal prejudice or ‘taste-based discrimination’. Becker’s taste-based discrimination model argues that differences in the treatment of men and women in the labour market arise if at least some employers, workers or customers prefer or dislike interacting with members of a particular group and if they are willing to pay a price, such as by sacrificing profits, to avoid this interaction. For example, employers who are prejudiced against women may act as if female workers are more expensive to hire than they truly are and, as such, hire men at a higher wage than they would actually need to pay for an equally productive woman. On the other hand, the source of discrimination might be employees, who are prejudiced against members of a particular group and demand a wage premium to work alongside them, or it might be customers who get lower utility from purchasing services if they have to interact with the members of a particular group of workers. According to Becker’s taste-based discrimination model, these preferences will create incentives for segregation in the labour market. An implication of this is that, in the absence of costs associated with segregation, workplace/firm segregation of workers will reduce the effect of taste-based discrimination on wage differentials.
As noted by Becker (1957) and later articulated by Arrow (1973), the taste-based discrimination model predicts the elimination of discrimination through competitive forces in the long run as prejudiced employers, who are willing to sacrifice profits by discriminating, will be driven out of business. This contrasts to the evidence of the existence and persistence of unexplained gender pay differentials. Subsequent research, however, has pointed out that Becker’s taste-based discrimination model is in fact consistent with the evidence in the presence of imperfect information in the labour market about the location and preferences of customers, employees and employers (see Altonji and Black, 1999 for a review of this strand of the literature).
The second leading theory by Arrow (1973) and Phelps (1972), ‘statistical discrimination’ suggests that discrimination by employers may in fact be rational and not driven by prejudice. The presence of imperfect information in the labour market about workers’ productivity leads employers to discriminate on the basis of predicted or actual differences between the average man and woman, i.e. stereotyping. In fact, as pointed out by earlier
9 The literature highlights several factors as contributors to this convergence, such as increased control over fertility via the
introduction of oral contraceptives (Goldin and Katz, 2002; Bailey, 2006); the introduction of new and improved household technologies (Greenwood et al., 2005); the introduction of bottle feeding and the medical advances that improved maternal health (Albanesi and Olivetti, 2016); gender biased technological change (Goldin, 1990; Galor and Weil, 1996) and the expansion of service sector (Ngai and Petrongolo, 2017) that increased demand to skills that women have a comparative advantage; decrease in child care costs (Attanasio et al., 2008); and cultural factors (Fernández et al., 2004; Fernández and Fogli, 2009; Fernández, 2013).
research, employers face uncertainty about worker productivity implying that statistical discrimination is plausible (Altonji and Blank, 1999; Blau and Kahn, 2017). Although it is an empirical challenge to quantify labour market discrimination and disentangle the effects of taste-based and statistical discrimination, the empirical evidence finds support for both theories (see, for reviews, Altonji and Blank, 1999; Blau and Kahn, 2017).
What taste-based discrimination and statistical discrimination models have in common is that they begin by assuming discrimination arises due to agents acting individually or in other words in a competitive framework. Instead, in the monopsonistic discrimination model developed by Robinson (1933) imperfect competition in the labour market is the mechanism that drives the GPG. According to this model, a single employer, a monopsonist, can set wages below the productivity of their workers to obtain higher profits and if the labour supply of women is less sensitive to wage changes, then they may earn less than men even if they have the same productivity. A recent literature that builds on the monopsonistic discrimination model argues that women are less likely to leave their employer in response to changes in firm and market conditions (Barth and Dale-Olsen, 2009; Hirsch et al., 2010; Ransom and Oaxaca, 2010), as they may have different valuations for employer-provided amenities or face smaller effective labour markets due to limited geographic mobility or higher commuting costs caused by domestic responsibilities (see, for a review, Hirsch, 2016; Manning, 2011). Collective models, on the other hand, assume that discrimination in the labour market arises if one group acts against another. For instance, in Bergmann's (1974) overcrowding model, exclusion of women from certain occupations can result in women crowding into a small number of occupations, depressing wages there for otherwise equally productive workers. Consistent with this, previous research finds evidence that both men and women employed in occupations where women are over-represented tend to earn lower wages (see, for example, Blau and Kahn, 2017; Goldin, 2014; Levanon et al., 2009). It is, however, important to note that collective action is only one possible explanation of overcrowding of women in certain occupations which is also consistent with employer discrimination and human capital theories (see Altonji and Blank, 1999 for a discussion). For example, women’s concentration in certain occupations may be a result of the existence of more severe employer discrimination in other occupations. On the other hand, gender differences in pre-labour market human capital investments (e.g. subject choice) may lead to gender differences in comparative advantage across occupations and occupational crowding. Additionally, individual preferences for the characteristics of occupations may differ between comparable men and women.
2.3 Evidence
Although the UK GPG has decreased in recent decades, on average women still earn less than men (ONS, 2018). For instance, in April 2017, the overall GPG was 18.4 per cent, which is higher than the GPG for full-time employees (9.1 per cent) as well as that for part-time employees (-5.1 per cent).10 This section reviews the existing evidence regarding the
UK GPG. We start with an overview of the recent empirical findings on the drivers of the GPG at the mean and across the earnings distribution. Then, we summarise the findings of previous studies on the sectoral and occupational differences in workforce composition and the GPG with a particular attention to public sector and PRB occupations. Finally, we present the findings of the existing studies on gender differences in PRP.
10 Although the overall GPG may therefore appear surprising, it is explained by the prevalence of part-time work among women
which tends to pay less per hour than full-time work (see discussion below). Latest ONS figures show that around 40 per cent of female employees work part-time compared to 12 per cent of men or, around 77 per cent of part-time jobs are held by female employees (see ONS Labour Market bulletin, October 2018).
2.3.1 Drivers of the UK GPG
Work experience
Gender differences in work experience and labour force attachment are important contributors to the GPG. Historically, women have had lower labour force participation rates, and conditional on participation they work fewer hours and/or experience more career interruptions than men (Blau and Kahn, 2017). Consequently, they have less years of work experience and general training, and as a result, accumulate less human capital than men. Moreover, human capital depreciation during career interruptions further lower women’s wages upon their return to the labour market. In fact, there is considerable evidence that gender differences in work experience account for a significant portion of the GPG (see, for a review, Blau and Kahn, 2017). For the UK, using regression-based decomposition techniques discussed above, the evidence suggests that up to 56 per cent of the UK GPG can be attributed to work experience if detailed work-life history variables, such as prior experience of full-time and part-time work as well as years spent in unpaid care work are considered (Olsen et al., 2018). Consistently, Swaffield (2007) finds that the unexplained portion of the GPG reduces by almost 40 per cent if more detailed work history measures are used.11
Educational qualifications
Another important determinant of human capital, formal educational qualifications, have a substantial impact on pay, but is found to be relatively unimportant in explaining the contemporary UK GPG. Olsen and Walby (2004), using data from the British Household Panel Study (hereinafter, BHPS), find that only 8 per cent of the GPG can be explained by the level of education. Nevertheless, recent studies stress that differences in the quality or type of education may be an important factor in explaining the GPG, in particular among college graduates. For example, for UK graduates in their early career, the difference between subject of study by men and women has been found to have an impact on the GPG (e.g. Machin and Puhani, 2003; Chevalier, 2002, 2007). This is mainly driven by the fact that subjects studied by women are associated with higher risk of unemployment and lower pay in general, while men dominate subjects offering the greatest prospects after graduation (Chevalier, 2002). An important question is then, why gender differences in subject choice emerge and whether they arise from personal choice, reflecting underlying gender differences in preferences, or inequality in access, through for example, pre-labour market discrimination.
Other personal characteristics
The GPG also varies significantly by age. In the UK, the gap is found to be insignificant at school-leaving age, becomes positive but narrower for women in their 20s or 30s, then rises to a peak pay gap level for women at the age of 45 and then declines slightly (Olsen et al., 2010). One possible explanation for this pattern is the differences across cohorts. Younger cohorts of women are not only more educated than older counterparts (Blau and Kahn, 2017), but also, they “begin their career in a more gender-equal world” (Wharton, 2009). Alternatively, it might also be that the GPG increases with age because women are less likely than men to get training (Manning and Swaffield, 2008) or be promoted in their careers (Harkness, 2005; Brynin, 2017). Consistent with the former, historical British evidence showed that women are less likely to receive work-related training than men (see, for example, Blundell et al., 1996), while more recent evidence suggests that this trend has
11 In the absence of actual work experience, most of the empirical literature relies on proxies such as age or potential work
experience, that is age minus years of formal education (minus the school starting age). However, these measures potentially overstate women’s actual labour market experience as women experience more interruptions in employment than men.
been reversed, with women now being more likely to receive any training, on- and off the-job training, and off-the-job training with an employer contribution (Jones et al., 2008). Regarding gender differences in promotions, the empirical evidence indicates that women in Britain actually have higher promotion rates than men, but they receive a lower wage reward to promotion, and the gender difference in these rewards increases by age (Booth et al., 2003a).
An alternative explanation of the increase in the GPG with age is that the events that take place over the lifecycle, such as marriage and childbearing, might have different impact on women’s and men’s pay (Harkness, 2005; Rubery, 2008). It is well-documented that men experience a ‘marriage premium’ (see, for recent reviews, Ribar, 2004; Rodgers and Stratton, 2010).12,13 On the other hand, there is less consensus in the literature regarding the
effect of marital status on women’s pay.14 The findings of empirical studies for the UK are
mixed, and even sometimes contradictory (see, for example, Dolton and Makepeace, 1987; Waldfogel, 1997; 1998; Budig and England, 2001). However, empirical studies tend to agree that the impact of marriage on women’s pay, if there is any, is at least partly connected to having children. In fact, the presence/the number of dependent children itself has previously been identified as one of the key contributors to the UK GPG (e.g. Waldfogel, 1998; Joshi et al., 1999; Viitanen, 2014). A potential explanation is that women move out of paid work after childbirth, which results in depreciation of human capital during this period. Consistent with this argument, a recent study by Costa Dias et al. (2018), using data from the BHPS and the Understanding Society (hereinafter, USoc), shows that until the arrival of the first child, the GPG is relatively small and fairly stable (around 7-12 per cent), but gradually increases over the following years, until it reaches around 33 per cent. Costa Dias et al. (2018) also find that the steady increase in the gap after childbirth is not only driven by women’s tendency to move out of paid work but also to move to part-time work. Differences in cumulative work-experience therefore provide an important explanation for the increasing GPG over the lifecycle.
Previous research has also shown that other personal characteristics, such as ethnicity also play a role in determining a worker’s pay. The evidence for the UK suggests that, with only few exceptions, on average, men from ethnic minorities tend to earn less, overall, than White men, while women in ethnic minorities do not to face a double disadvantage in the labour market from gender and ethnicity (Longhi and Brynin, 2017). In fact, using the QLFS data for the period 2002-2014, Longhi and Brynin (2017) find that many ethnic minority women actually experience a pay advantage relative to White British women and men of the same ethnicity, and this is mainly due to higher qualifications of ethnic minority women as well as their concentration in occupations and regions, where pay is comparatively higher.
Although most of the empirical studies on the GPG account for regional differences in earnings, only few explicitly deal with its regional dimension. Notable exceptions include Phimister (2005) who studies differences in urban wage premia by gender and Robinson (2005) who analyses the effect of the National Minimum Wage (NMW) on the GPG across
12 The explanations put forward to explain the marriage premium for men include positive selection of men into marriage on the
basis of wages or wage enhancing characteristics (Becker, 1981; Cornwell and Rupert, 1997), employer favouritism (Hill, 1979; Bartlett and Callahan, 1984) and the argument that marriage makes men more productive (Becker, 1981; Korenman and Neumark, 1991; Loh, 1996; Ginther and Zavodny, 2001).
13 Cross-sectional evidence for men in Britain reports a ‘marriage premium’ ranging from 10 per cent to 14 per cent (see, for a
review, Bardasi and Taylor, 2008). On the other hand, using panel data from the BHPS, covering the period 1991-2003, Bardasi and Taylor (2008) find that more than half of the ‘marriage premium’ for men in Britain is explained by unobserved individual-specific heterogeneity and/or selection effects. Nevertheless, a small but statistically significant marriage premium remains even after controlling for a wide range of characteristics including time-invariant individual specific unobserved characteristics. Their further analysis suggests that intra-household specialisation is in fact an important explanation of the wage premium observed for married men in Britain.
14 See, for example, Ginther and Sundström (2008), Hill (1979), Korenman and Neumark (1991), Killewald and Gough (2013)
regions. A more recent example is the paper by Stewart (2014b) which investigates the geographic variation in GPGs by focusing on the difference between London (or the south-eastern corner more generally) and the rest of Great Britain. Stewart (2014b) uses region of employment information from the 2012 ASHE data and finds that London has a higher GPG compared to the rest of Great Britain in the upper half of the wage distribution. At the median the entire regional difference in GPG is due to differences in individual and work-related characteristics between London and the rest of Great Britain, and it is only in the top one-third of the wage distribution that the higher GPG in London is not a consequence of characteristics. Using region of residence and 1995-1997 and 2004-2007 BHPS data, Olsen
et al. (2010) also show that inner and outer London and the South East have larger GPGs.
Their findings, however, suggest that the contribution of the regional differences on the size of the overall GPG is negligible.
The empirical evidence for the UK consistently suggests that disabled workers experience a pay penalty relative their non-disabled counterparts (see, for a review, Jones, 2008). Moreover, evidence suggests that gender and disability, when combined, create a double pay disadvantage for disabled women. Further, using data from the QLFS and focusing on gender differences in disability effects, Jones et al. (2006) find that the gender gap in 2003 was larger for the disabled compared with 1997, indicating the worsening position of disabled women in the UK labour market. Using regression-based decomposition techniques discussed above, they also find that the ‘unexplained’ component of the GPG was greatest for those whose disability is work-limiting. Using data from the QLFS between 2004-2007, Longhi and Platt (2008) also show that disabled men and disabled women are disadvantaged compared to non-disabled men. They find that disabled men (women) had a pay gap of 11 (22) per cent relative to non-disabled men.15
Recent studies also highlight the role of gender differences in individual characteristics that are not usually available in standard datasets, such as personality traits, including labour market motivation, attitudes and aspirations, on pay gaps. Gender differences in personality traits may arise due to perceptions of men and women with respect to gender roles shaped by cultural values, which may be imposed by society and reflect a form of pre-labour market discrimination. There is some evidence suggesting that differences in perceptions of gender roles influence the negotiation skills of men and women which are crucial in determining the starting salaries and pay rises (Babcock and Laschever, 2003). In the UK, although earlier studies find an effect of personality traits on GPG (Chevalier, 2002; Chevalier, 2007; Swaffield, 2000), Manning and Swaffield (2008) highlight that this effect is only marginal. Swaffield (2007) also shows that although the differences between women in gender role values have an impact on female wages, these attitudes are not a main component of the UK GPG.
Work-related characteristics
Pay is not entirely determined by personal characteristics but has also been found to depend on the characteristics of the individual’s job and employer. Previous research has consistently demonstrated that part-time employment in the UK is associated with lower pay and inferior quality work relative to full-time jobs (e.g. Connolly and Gregory, 2008; Grimshaw and Rubery, 2007; Manning and Petrongolo, 2008). As such, part-time employment contributes to occupational downgrading and occupational segregation (see below). Moreover, due to difference in hours of work, over the same period of employment, part-time workers accumulate less human capital through work experience than full-time workers (Kunze, 2018). There is also evidence that part-time work experience has either no
15 There is a further literature on wage gaps relating to sexual orientation which find the results vary by gender (see, for
or even a negative effect on pay (Joshi et al., 2007; Olsen and Walby, 2004) and it is only full-time work experience that has substantial benefits in terms of human capital accumulation (Costa Dias et al., 2018). On the other hand, recent evidence by Olsen et al. (2018) suggests that part-time experience may be a new protective factor of the GPG in the UK, as they find that part-time work experience decreases the GPG. They partly attribute this to an increasing proportion of female workers having negotiated part-time employment as a form of job retention with more comparable job quality to that of their previously full-time positions.
In addition to full-time/part-time employment, the type of employment contract is also found to play a role on determining a worker’s pay, with workers on temporary contracts earning less than their counterparts in permanent employment. As argued by Arulampalam et al. (2007), if the prevalence of temporary contracts varies between men and women, it could be an important determinant of the GPG. In fact, for Britain, there is evidence that women are more likely than men to be on temporary contracts, and workers on temporary contracts receive lower wages than their permanent counterparts (Booth et al., 2002, 2003b). However, although temporary work affects the pay of men and women negatively and the effect is much larger on men than women (Booth et al., 2003b), it has only a small effect on the overall GPG (Brynin, 2017).
In addition to general skills acquired through work experience, firm-specific skills also have a positive impact on pay and promotion opportunities (see, for an overview, Evertsson, 2004). Tenure, measured by the number of years an employee has been working for the same employer or in the same job, is considered to capture the firm/job specific training of the worker (see, among others, Abraham and Farber, 1987; Altonji and Williams, 2005; Mincer and Jovanovic, 1981; Topel, 1991). Recent evidence for the UK indicates that women have shorter job tenure relative to men, mainly due to child-rearing, however, this has only a small impact on the size of the GPG (Brynin, 2017; Olsen et al., 2018).
Occupational segregation by gender is a key feature of the UK labour market and another established determinant of the GPG (Blau and Kahn, 2000), with women being concentrated in lower paying occupations such as caring, leisure and other service occupations. Although there is much debate over whether to control for occupation in estimating the GPG, most empirical studies include occupational dummies in order to take into account occupational segregation.16 On the other hand, Mumford and Smith (2007) suggest a more direct
measure of occupational segregation based on the number of females in any given occupation, known as the ‘femaleness’ of the occupation.17 In fact, using a similar measure
(the percentage of males in the occupation), Olsen et al. (2010) find that occupational segregation, accounted for 15 per cent of the GPG in 1997, 17 per cent in 2007, and 19 per cent in 2014/2015 (Olsen et al., 2018) while Mumford and Smith (2009) show that combined with workplace segregation (see below for further discussion), occupational segregation, makes a significant contribution to the GPG between male and female part-time employees but not for full-time workers.
Gender differences in the type of tasks performed within occupations, and work responsibilities may also influence the GPG. In relation to the former, evidence for the UK shows that gender inequality with respect to tasks remains substantial within occupations (Lindley, 2012). Using data from the UK Skills Surveys and the EU KLEMS database, Lindley (2012) finds that within broad industries men undertake a range of numeracy tasks
16 As occupational segregation itself might be partly due to discrimination, controlling for it will underestimate the unexplained
component of the GPG that is taken to reflect inequality in treatment. On the other hand, if occupational segregation is driven by individual choices, not controlling for it will overstate discrimination (see, for a further discussion, Blau and Kahn, 2000).
17 As noted by Mumford and Smith (2007), the impact of occupation on the GPG might be wider than the one captured by the
that are positively correlated with the technical change, while women do not. Similarly, Felstead et al. (2002) show that in Britain men are more likely to work in jobs that require complex and advanced computer applications than women. Regarding responsibilities, Drolet (2011) argues that if men have more opportunities than women to undertake managerial or supervisory responsibilities or work-related tasks such as budgeting and/or staffing decisions, or if men receive higher returns to these responsibilities and tasks than women, then the GPG will persist.
Similar to gender differences in occupational distribution, there exist significant differences in the concentration of women and men across industries. By controlling for broad categories of industry in wage regressions, Olsen et al. (2018) find that 29 per cent of the UK GPG in 2014/2015 could be attributed to the industry allocation of men and women, while the contribution of specific industries to the gap ranged from 0.6 per cent (financial sector) to 16.8 per cent (manufacturing). The variation across industries is mainly driven by gender segregation, with females dominating industries where the pay is lower (e.g. human, health and social work). However, similar to occupation (see discussion above), including controls for industry in analysing the GPG is debated as it is not obvious whether gender segregation by industry is a result of individual choices or discrimination (Blau and Kahn, 2000).
It is well-established in the empirical literature that working in large firms leads to a significant wage premium (see, for a review, Troske, 1999), however, the link between firm size and GPG is less clear. In relation to the latter, the empirical evidence is mixed, and even sometimes contradictory (see, Mitra, 2003 for the US; Akar et al., 2013 for Turkey; Heinze and Wolf, 2010 for Germany). For Britain, using data from three different sources (the BHPS of 1991, the General Household Survey of 1983, and the establishment-level Workplace Industrial Relations Surveys of 1984 and 1990), Green et al. (1996) find that there are larger firm size effects for women in the private sector than men, and in particular the wage penalty for working in smaller establishments is much larger for women.
Working in the public sector and being a trade union member are two institutional factors that are considered to favour women (Olsen et al., 2010). In relation to the former, the probability of working in the public sector is higher for women (Jones et al., 2018). It is also well established that there exists a public sector wage premium which is greater for women (Blackaby et al., 2012; Bozio and Disney, 2011). As a result, the GPG, both raw and unexplained, is lower in the public sector (see, for example, Olsen et al., 2010; Chatterji et al., 2011; Jones et al., 2018). Recent evidence by Jones et al. (2018) also shows that the main determinant of the national GPG is within sector gender pay differentials rather than the different gender sector allocations. In fact, Jones et al. (2018) find that in the absence of within sector GPGs, women would earn more than men, on average.
In relation to union membership, women now are more likely to be members than men and the membership rates are much higher in the public sector than in the private sector (Chatterji et al., 2011). Similar to the public sector wage premium, the empirical studies for the UK have shown that there exists a union membership wage premium which is around 10 per cent (Bryson, 2014). Although recent studies show that the premium has declined over time (see, for example, Forth and Bryson, 2015), it continues to be sizeable both in the public and private sectors, being much larger in the former than in the latter (Blanchflower and Bryson, 2010). In terms of gender differences, the evidence suggests that the union wage premium in Britain is larger for women than men, and as a result, it narrows the GPG. A recent study by Blanchflower and Bryson (2010) also confirms that unions have a larger positive impact on pay for women, both in the public and private sector. However, its role in determining the overall GPG is found to be relatively small (Olsen et al., 2010, 2018).
Workplace characteristics
While previous studies focus mainly on personal and work-related characteristics, the availability of nationally representative linked employee-employer datasets, has shifted the attention to the role of firm and workplace in driving the GPG. In relation to the workplace, Chatterji et al. (2011) use data from the British Workplace Employee Relations Survey (hereinafter, WERS) 2004 and show that characteristics, including the presence of PRP schemes, company pension schemes and family-friendly work policies play an important role in the determination of individual earnings. However, their results indicate that the major component of the earnings gap between full-time male and female employees in Britain remains unexplained even after accounting for workplace in addition to individual and work-related characteristics. Similarly, a recent study by Jewell et al. (2018) uses data from the ASHE and explores how much of the UK GPG between years 2002-2016 was due to the distribution of workers across firms, i.e. which workers were employed by which firms. However, their findings suggest that the contribution of the differences between men and women in whom they work for on GPG is small (less than 1 percentage point), pointing to the importance of within-firm gender wage inequality. Interestingly, they also find that despite the significant variation across occupations in terms of pay, the contribution of gender-occupational segregation was only 1 percentage point to the overall UK GPG. Consistent with this result, Mumford and Smith (2009) find that segregation at the workplace level is in fact even more important than occupational segregation in determining the GPG in Britain. Their analysis of the WERS data suggest that only 2.6 per cent of the GPG in 1998 was related to occupational segregation, compared to the 29.1 per cent that was related to workplace segregation.
2.3.2 UK GPG across the earnings distribution
Although attention on the GPG tends to focus at the middle of the earnings distribution, making comparisons between the average man and woman, international evidence is increasingly concerned with the entire distribution (see Albrecht et al., 2003 for Sweden; de la Rica et al., 2008 for Spain; Jellal et al., 2008 for France; Arulampalam et al., 2007 for a comparison of eleven European countries including Britain).
In the UK, Olsen et al. (2010) show that male and female wages diverge over the pay distribution. Although the drivers of the GPG are found to be largely similar over the distribution, their results show that education has a larger positive effect on pay at the top of the wage distribution. Based on the latter, they argue that, women’s relative improvements in education will have a more equalising effects on the GPG at the middle or top of the pay distribution. A recent study by Chzhen and Mumford (2011) also find that the GPG increases across the pay distribution indicating the presence of a ‘glass ceiling’ effect, or vertical segregation, among British full-time employees. They show that high skilled, white-collar occupations and carrying out managerial duties are strongly associated with the glass ceiling effect. Another recent contribution by Fortin et al. (2017) documents the under-representation of women at the top of the annual earnings distribution using data from the ASHE. Their further analysis based on the QLFS reveal that under-representation of women among top earners accounts for the half of the average hourly GPG in 2015. Focusing at the other end of the wage distribution, Bargain et al. (2018) find surprisingly little impact of the NMW on the UK GPG.
2.3.3 The role of the public sector
There has been considerable interest in quantifying the size of the UK public-private pay differential and tracking its movements over time, with a consistent finding being a greater public sector pay premium for women (see, for example, Blackaby, et al. 2012; Cribb et al.,