2013-14 Materials Management
Program Information Update
January 2015
Last Updated: 1/29/15 By: Cheryl Grabham
Land Quality Division Solid Waste 811 SW 6th Avenue Portland, OR 97204 Phone: (503) 229-5696 (800) 452-4011 Fax: (503) 229-6977 Contact: Cheryl Grabham www.oregon.gov/DEQ DEQ is a leader in restoring, maintaining and enhancing the quality of Oregon’s air, land and water.
This report prepared by:
Oregon Department of Environmental Quality 811 SW 6th Avenue Portland, OR 97204 1-800-452-4011 www.oregon.gov/deq Contact: Cheryl Grabham (503) 229-6434
Oregon Department of Environmental Quality 2013-2014 Materials Management Program Information Update
Accessibility information
DEQ is committed to accommodating people with disabilities. Please notify DEQ of any
special physical or language accommodations or if you need information in large print,
Braille or another format.
To make these arrangements, call 503-229-5696 or call toll-free in Oregon at
800-452-4011; fax to 503-229-6762; or email
.
Oregon Department of Environmental Quality 2013-2014 Materials Management Program Information Update
Table of Contents
Executive Summary ...1
1. Purpose ...3
2. Materials Management Programs ...4
A. Materials Management in Oregon: 2050 Vision and Framework for Action ...4
B. Waste Prevention...5
C. Waste Recovery Programs ...8
D. Household Hazardous Waste ...12
E. Disposal Facility Regulation ...14
F. Metro’s Waste Reduction Program: Compliance with State Requirements ...17
3. Waste Generation, Recovery and Disposal Data ...19
A. Waste Generation ...19
B. Recovery Rates ...20
C. Disposal Data ...23
4. DEQ Materials Management Program Funding ...25
Appendix 1. Oregon E-Cycles Program Performance, Implementation and Collection Site
Map ...26
Oregon Department of Environmental Quality 2013-2014 Materials Management Program Information Update
Executive Summary
This report fulfills DEQ’s reporting requirements for the statewide solid waste management plan, electronics recycling in Oregon and information related to California’s standards for mercury content in fluorescent lamps. Oregon’s Statewide Integrated Solid Waste Management Plan was updated in 2012 as Materials Management in Oregon: 2050 Vision and Framework for Action. This report also describes Materials Management in Oregon: 2050 Vision and Framework for
Action and its implementation: waste prevention, waste recovery including product stewardship
programs, household hazardous waste, disposal facility regulation and Metro’s waste reduction program. It includes data on Oregon waste generation and waste recovery and energy savings and greenhouse gas reductions resulting from waste recovery. The report uses 2013 data (the most recent available), as well as historical trend information. Finally, this report provides information about Materials Management Program funding.
The full 2013-14 DEQ Solid Waste Management Program Information Update report and related information is available through the DEQ Materials Management Program’s web page at
www.oregon.gov/deq/LQ/Pages/SW/MaterialsManagement.aspx.
Program Directions
Materials Management policies and programs continue to evolve in response to growing awareness about the significant environmental impacts materials and products have throughout their life cycles – from resource extraction and production, to transport, use and disposal. For many products, impacts from production are much greater than impacts from disposal. The Oregon Environmental Quality Commission adopted the 2050 Vision and Framework for
Action to guide materials management in Oregon and help shift focus from managing wastes at
the end of life, or time of discard, to identifying the most significant impacts occurring over the full life cycle of products and actions to reduce them.
To help establish a solid foundation for action, DEQ initiated several high priority projects in 2013-14. DEQ conducted an in-depth stakeholder process to develop legislation for 2015 that would provide adequate program funding and update waste recovery and waste prevention programs and goals. As a result, Senate Bills 245 and 263 were introduced in January 2015. The Materials Management Program also collaborated with public and private partners on
foundational research and analysis that will help inform future waste prevention efforts and maximize the benefits of material recovery. DEQ continues to regulate solid waste disposal facilities and oversee waste recovery efforts, including product stewardship programs such as Oregon E-Cycles and paint product stewardship. Through these combined efforts, DEQ will continue to make steady progress toward addressing the most significant environmental impacts related to materials and products.
Trends in Waste Generation and Management
Waste generation is the sum of the tons of municipal post-consumer waste disposed and tons recovered through recycling, reuse and energy recovery. In 2013, Oregon narrowly missed the state’s goal for no increase in total waste generation, but did have no increase in per-capita generation. The state continued a five-year trend of no or negligible increases in total or per-capita waste generation, in sharp contrast to much of the 1990s and early 2000s, when waste generation rose steeply. The per-capita waste generation rate for 2009-2013 is the lowest it’s been in Oregon since 1996. The following are highlights on management of waste generated in 2013.Oregon Department of Environmental Quality 2013-2014 Materials Management Program Information Update The total amount of waste generated in Oregon for disposal and recovery remained relatively
steady. In 2013, total generation was 4,838,471 tons, a 0.5 percent increase over 2012. This equates to 2,469 pounds per person for 2013, a 0.5 percent decrease in per-capita waste generation from 2012, and 20 percent less than the peak per-capita generation of 3,105 pounds per person in 2006.
o Waste recovery for recycling and other uses increased slightly. In 2013, the state met its waste recovery goal with a rate of 54.0 percent, an increase over the 2012 rate of 53.4 percent. The recovery rate includes materials recycled by households and businesses or sent offsite for composting and some materials burned for energy recovery.
o Amount of material sent to landfill for disposal declined to the lowest level measured in Oregon in two decades. Annual disposal of Oregon municipal solid waste was 1,232 pounds per person, 30 percent below the peak of 1,754 pounds per person disposed in 2006.
Oregon continues to receive a large amount of landfill-bound waste generated outside the state, and waste imports from outside the state increased substantially between 2011 and 2013. In 2013, about 42 percent of the waste disposed of in Oregon’s municipal solid waste facilities was from outside the state, compared to 36 percent in 2011.
o This changing dynamic explains why solid waste disposed at municipal solid waste facilities in Oregon increased from 5.35 million tons in 2011 to 5.86 million tons in 2013, even as disposal rates within the state fell. For context, however, disposal of waste from outside the state, contaminated soil and other special wastes at Oregon municipal solid waste facilities is still less than a high of 6.78 million tons in 2007.
Oregon exports only a small fraction of its waste for disposal in other states. In 2013, only 1.9 percent of Oregon’s municipal solid waste went to landfills outside the state.
Energy savings and greenhouse gas reductions from recycling, composting and energy recovery are significant. Energy savings in 2013 equaled roughly 3.4 percent of total energy used in 2013 by all sectors of Oregon’s economy, or 33 trillion British thermal units. Estimated greenhouse gas reductions equaled roughly 4.5 percent of the estimated statewide greenhouse gas emissions in 2013, or 3.0 million metric tons of carbon dioxide.
Materials Management Program Funding
Revenue for the DEQ Materials Management Program comes primarily from two sources – solid waste tipping fees and permit fees – both assessed on tons of waste disposed in Oregon. Revenue has declined sharply since 2008 with declines in disposal. At the same time, operating costs have increased and fees have not changed since 1994. Without fee increases, DEQ must continue to cut staff and programs. As noted later in the report, Senate Bill 245 would increase and stabilize program funding.
Oregon Department of Environmental Quality 2013-2014 Materials Management Program Information Update
1.
Purpose
This report fulfills DEQ’s requirement to report biennially to the Oregon Legislature on Oregon’s Integrated Solid Waste Management Plan (ORS 459A.015 and 459A.020), updated in 2012 as
Materials Management in Oregon: 2050 Vision and Framework for Action. DEQ’s Solid Waste
Program is now called the Materials Management Program to more accurately reflect the focus on addressing environmental impacts across their full life-cycle of materials, not only at end of life.
In addition, this report fulfills requirements to report to the Legislature on fluorescent lamp mercury content standards (ORS 646A.566) and on operations of Oregon E-Cycles under Oregon’s Electronics Recycling Law (ORS 459A.340(8)). The Materials Management Program encompasses both mercury reduction and the Oregon E-Cycles programs.
Oregon Department of Environmental Quality 2013-2014 Materials Management Program Information Update
2.
Materials Management Programs
A. Materials Management in Oregon: 2050 Vision
and Framework for Action
Materials Management in Oregon: 2050 Vision and Framework for Action was adopted by the
Oregon Environmental Quality Commission in December 2012 to update the State Integrated
Resource and Solid Waste Management Plan (1995-2005). The 2050 Vision is available at
www.deq.state.or.us/lq/pubs/docs/sw/2050vision/MaterialsManagementinOregon.pdf.
Many environmental challenges facing Oregon and the world, such as depletion of resources and increasing pollution and greenhouse gas emissions, are related to how materials are produced, used and managed. To effectively address evolving challenges and opportunities, Oregon must look more broadly, and systematically consider environmental impacts and actions to address them across the full life of materials – starting with design and continuing through raw materials extraction, manufacture, transport, consumption, use, reuse and recycling, recovery and disposal. The vast majority of environmental impacts from materials result from decisions made in design, production and consumption, not end-of-life management. The 2050 Vision and Framework for
Action adopt thisholistic “materials management” approach.
Systematically considering impacts across the full life cycle of materials can help Oregonians make smarter decisions – ones that are good for the environment, economy and society. For example, in many cases looking upstream – at design, production and consumption – uncovers more effective opportunities to protect the environment. And conversely, focusing on just one stage of the life cycle such as production, packaging, transport or disposal can lead to decisions that are penny-wise and pound foolish. The 2050 Vision and Framework for Action reflects the already-changing nature of materials management work and provides a solid framework to guide state policy and programs and achieve the best environmental results at the lowest cost to society. In 2011 DEQ convened a diverse workgroup of stakeholders to help develop the 2050 Vision and
Framework for Action. DEQ applied the process of “backcasting” – starting with a future vision
and then looking back to identify steps needed to achieve that vision. To support the workgroup, DEQ staff conducted significant research and wrote 14 background papers available at
www.deq.state.or.us/lq/sw/materialsmgmtplanbkgrddocs.htm.
Materials Management in Oregon: 2050 Vision and Framework for Action envisions a future where
“Oregonians produce and use materials responsibly: conserving resources – protecting the environment – living well.” In this future, producers make products sustainably, so every option is a sustainable option; people live well and consume sustainably; and materials have the most useful life possible before and after discard.
The 2050 Vision identifies about 50 actions to help reach that vision, including a need to establish
new goals and outcome measures and secure new resources as needed. Stakeholders involved in the visioning process recognized that these foundational actions are essential to move Oregon toward the 2050 Vision.
Oregon Department of Environmental Quality 2013-2014 Materials Management Program Information Update In the fall of 2013, DEQ convened
stakeholders for the Materials Management Workgroup and three focused sub-groups to engage stakeholders, solicit input and gain support for key actions needed to implement priority actions in the 2050 Vision. The Workgroup aimed to develop solutions that engender broad stakeholder and agency support, and translate them into legislative proposals as needed. The three subgroups focused on goals and measures, sustainable funding, and recycling opportunities. More than 100 stakeholders met during 22 meetings held over 14 months. The resulting Senate Bills 245 and 263 for the 2015 Legislative session would provide adequate, stable funding for materials management work and update waste prevention and recycling requirements and goals. If passed, these bills would guide state, local and private actions to help Oregon conserve resources, reduce pollution, and achieve its 2050 vision for materials management.
B.Waste Prevention
It has long been Oregon’s policy that prevention and reuse, which both reduce waste generation, have priority over recycling, composting, energy recovery and landfilling as methods of
managing solid waste. The 2001 Legislature set Oregon’s first statutory waste prevention goals, noting that: “There are limits to Oregon’s natural resources and the capacity of the state’s environment to absorb the impacts of increasing consumption of resources, including waste generation and increasing solid waste disposal.... It is in the best interests of the people of Oregon to conserve resources and energy by developing an economy that encourages waste prevention and recycling.” The goals are:
For the calendar year 2005 and subsequent years, no annual increase in per-capita municipal solid waste generation; and
For the calendar year 2009 and subsequent years, no annual increase in total municipal solid waste generation.
These goals were recommended by DEQ’s Waste Policy Leadership Group (2000), which emphasized the importance of reducing and stabilizing overall (total) waste generation. No increase in total waste generation implies that per-capita generation will steadily fall (assuming that population continues to grow). The 2005 – 2008 goals of stabilized per-capita generation were promoted as interim, or “bridge” goals.
These existing goals have helped DEQ and partners focus programs on prevention and reuse, the most preferred methods of managing wastes in Oregon’s statutory policy. The goals have been met in some years and not in others, as described later in this report.
Oregon Department of Environmental Quality 2013-2014 Materials Management Program Information Update In 2014 DEQ worked with stakeholders to evaluate whether these goals are adequate to help
Oregon achieve its 2050 Vision. These existing goals – while helpful – can be interpreted in several different ways, which leads to confusion. In addition, they aim to simply keep waste generation from growing, without consideration as to whether current (or baseline) levels of waste generation are sustainable or aligned with the 2050 Vision. Developed with stakeholder input, Senate Bill 263 for the 2015 Legislative session would clarify and update these waste generation goals.
Green Building
Choices about building design, materials, construction and remodeling practices all have significant bearing on Oregonians’ overall environmental impacts, including waste generation. Since buildings are long lasting, design choices made today will affect the environment for decades.
In 2010, DEQ and its partners completed a groundbreaking report that evaluates and compares the environmental benefits of a wide range of waste prevention practices in residential buildings. The report was prepared in partnership with Earth Advantage, the Oregon Home Builders Association, architects, builders, remodelers, deconstruction operators and related organizations. Study results are helping these partners, DEQ and other agencies and organizations understand the environmental impacts of material selection and waste prevention practices, and prioritize efforts that offer the most potential for achieving environmental improvements. The report, A Life Cycle Approach to Prioritizing Methods of Preventing Waste from the Residential Construction Sector in the State of Oregon, is available at
www.deq.state.or.us/lq/sw/wasteprevention/greenbuilding.htm.
DEQ collaborates with diverse organizations and several partners to use this research and help inform policy decisions. These efforts have focused primarily on putting the value of building size on par with other green building practices, since reducing house size was the most beneficial practice evaluated. For example in 2011 and 2012, DEQ supported the Oregon Building Codes Division and other stakeholders in incorporating size-based tiers into Oregon’s residential REACH building code. DEQ teamed with Earth Advantage Institute to help recalibrate its rating system to better account for house size. DEQ also collaborated with the Energy Trust of Oregon to better align financial incentives for smaller homes that save both materials and energy. In addition, DEQ worked with many municipal planning programs to share effective zoning and incentive strategies for space-efficient housing.
In 2013-14, DEQ focused on researching and promoting accessory dwelling units (ADU), which are small living spaces that can be added to many single-family residential properties throughout the state. ADUs offer the potential for significant environmental benefits while also providing more affordable housing and creating an alternative housing model that allows families to grow and older Oregonians to age in place. However, homeowners need to become mini developers in order to get ADUs built, which can be a significant barrier to ADU development. DEQ worked with partners such as Metro and City of Portland to survey ADU owners about ADU use, occupancy, and development statistics. This survey highlighted many areas where education and outreach is needed to better support ADU development. DEQ helped organize a successful ADU tour, introductory video, case studies, appraisal guide, and financing guide. The tour received significant news media coverage, further boosting public awareness of ADUs. DEQ also helped educate both realtors and appraisers through a variety of partner events.
Oregon Department of Environmental Quality 2013-2014 Materials Management Program Information Update
Foundational Research and Analysis
Ongoing research and analysis improves the effectiveness of DEQ and others in preventing waste. DEQ continues to build capacity in Oregon around environmental analysis of materials and wastes, particularly evaluation of full life cycle impacts. In the past two years, DEQ worked with public and private partnership to make significant progress in three areas:
Greenhouse Gas Accounting
The conventional method for inventorying greenhouse gas emissions at the state or community level significantly undercounts emissions resulting from waste generation and the “upstream” consumption (and production) of goods. In 2013, DEQ completed an update (for calendar year 2010) to the state’s “consumption-based” greenhouse gas inventory. This inventory estimates the globally-distributed emissions associated with satisfying consumption (economic final demand) by Oregon. It was published as part of a new multi-agency greenhouse gas emissions report that brings together multiple accounting frameworks used by DEQ and other agencies. The full report is available at www.oregon.gov/DEQ/AQ/Pages/Greenhouse-Gas-Inventory-Report.aspx. Specific to waste prevention, the consumption-based emissions inventory has value in
demonstrating not only the magnitude of emissions associated with material consumption, but also the significant differences in emissions between different types of commodities. This information will be useful for prioritizing future waste prevention initiatives, to focus more on material and waste types that have higher greenhouse gas (and other environmental) impacts.
Environmental Footprinting of Products and Materials
Every product has an environmental “footprint” – the resources used and pollutants released over the life of the product, including supply chain, production, use, and management at end-of-life. “Carbon footprint” is the most common type of footprint, but businesses are exploring other types of footprints as well, addressing issues such as the water used to make products, or the toxic chemicals released over their life. Brand owners increasingly turn to product footprints as a way to better understand and manage environmental impacts, to uncover opportunities to reduce costs and risk, and to increase market share. Large retailers are increasingly requesting information about product-level environmental impacts, and some other nations are discussing requiring footprints of products sold into their markets, which could affect Oregon businesses.
In 2014, DEQ worked with the State of Washington, the Oregon Sustainability Board and an advisory group of stakeholders from across Oregon and Washington to evaluate the potential benefits and challenges inherent in product-level environmental footprinting. The project surveyed 115 businesses and conducted 16 in-depth interviews with companies that have footprinting experience and those that are interested but haven’t pursued product footprinting. The research results revealed that product environmental footprinting has both environmental and financial benefits and leads companies to take well-informed actions to reduce the environmental footprint of their products. DEQ also learned that product footprinting presents some major challenges and would benefit from third-party support in a broad range of areas. In 2015, DEQ will work with the Oregon Sustainability Board and Washington Department of Ecology to identify a project that can help support businesses interested in product environmental footprinting.
Waste Prevention and Government Purchasing
In 2014 DEQ began contributing to the development of a “low carbon purchasing toolkit,” containing resources that state and local government and other public agencies can use to reduce
Oregon Department of Environmental Quality 2013-2014 Materials Management Program Information Update the greenhouse gas emissions associated with goods and materials they purchase. The toolkit is
being developed under the auspices of the West Coast Forum on Climate and Materials Management, an EPA-convened partnership of states and local governments that develops and shares ways to integrate lifecycle materials management policies and practices into climate, sustainability and solid waste plans. DEQ is one of several partners contributing content to this toolkit.
Other Waste Prevention
DEQ staff provides information and guidance to individuals, private businesses and local
governments on many aspects of waste prevention and recovery. Waste prevention information is available on DEQ’s website. DEQ staff also provides numerous presentations on waste
prevention and the environmental considerations of materials selection and purchasing to audiences such as individual businesses, industry groups and Master Recycler organizations.
C. Waste Recovery Programs
Opportunity to Recycle
Oregon's ground-breaking Opportunity to Recycle legislation from 1983 assures that Oregonians at least have the opportunity to recycle, whether they choose to use it or not. Cities of 4,000 or more population must ensure that regular recycling collection, or an acceptable alternative program, is provided to all garbage service customers. Counties are also responsible for insuring these services are provided within areas outside city limits but within the urban growth boundary of the cities. In addition, these cities and counties must choose and implement between three and five recycling programs, depending on the city’s size, from a list of nine recycling program elements.
There are 88 cities in Oregon required to provide these services. All 88 are in compliance, with 84 providing regular curbside collection and 4 four implementing alternatives. The cities and counties are also implementing required recycling program elements, with the large majority of cities implementing more recycling program elements than are required by law. For the past year, DEQ has worked with stakeholders to examine existing law and recycling programs, to develop recommendations for updating the recycling laws in 2015. The outcome of these discussions is Senate Bill 263 for the 2015 Legislative session.
Product Stewardship
Product stewardship refers to actions that minimize environmental, health, safety and social impacts while maximizing economic benefits of a product and its packaging throughout all life cycle stages. Product stewardship shifts primary responsibility for impacts over the life of a product to the producers of the product. The producer has the greatest ability to minimize adverse impacts, but other stakeholders such as suppliers, retailers and consumers also play a role. Stewardship can be either voluntary or required by law. The three product stewardship programs required by law in Oregon are for electronics, leftover paint, and beverage containers.
Oregon E-Cycles
Oregon’s Electronics Recycling Law, adopted in 2007, established a product stewardship program for electronics – Oregon E-Cycles. The law requires electronics manufacturers to provide free, convenient, statewide recycling for computers, monitors and TVs.Amendments in 2011 (Senate Bill 82) added printers and computer peripherals such as keyboards and mice
Oregon Department of Environmental Quality 2013-2014 Materials Management Program Information Update beginning in 2015. Manufacturers whose devices are sold in or into Oregon must register their
brands with DEQ and join either the state contractor or a manufacturer-run recycling program. Each recycling program operates under a plan approved by DEQ and is funded by its
participating manufacturers.1
Only registered brands of manufacturers in compliance with the law may be sold in or into Oregon. Retailers must also inform consumers about recycling opportunities under Oregon E-Cycles.
The law also bans computers, monitors and TVs from disposal at solid waste disposal facilities. Oregon E-Cycles has produced significant environmental benefits since operations began in 2009. Each year the weight of devices recycled and the number reused has increased and met or exceeded annual, statewide collection goals. In 2013 collections totaled 27.7 million pounds of devices recycled and another 38,038 units dedicated to reuse. Preliminary figures for 2014 demonstrate that Oregon will meet the goal of 29.2 million pounds through actual collections or with the use of credits. Between 2009 and 2013, Oregon E-Cycles recycling has saved
approximately 1,870 billion British thermal units of energy, which equals approximately 14 million gallons of gasoline. DEQ estimates that net greenhouse gas reductions amount to 141,500 metric tons of carbon dioxide equivalent, comparable to the benefit of eliminating tailpipe emissions from approximately 30,500 average passenger cars per year. Appendix 1 provides a summary table of the program’s performance, a narrative of program implementation, and a statewide collection site map for 2014.
Currently three recycling programs comprise Oregon E-Cycles: a state contractor program operated by a private entity under contract with DEQ, and two manufacturer-run recycling programs. Combined, these three programs include more than 150 manufacturers and have established a stable collection, transportation and recycling infrastructure with more than 280 collection sites and additional collection events statewide.
Each recycling program must ensure that the collectors and recyclers in its network comply with approved standards and practices. The programs must verify that devices are managed
appropriately from initial collection through the point at which materials are processed into single-stream commodities, regardless where that occurs. In its oversight role, DEQ reviews program reports, visits collectors and recyclers across the state and addresses any issues with the recycling programs.
Oregon E-Cycles is a successful product stewardship program where stakeholders have worked cooperatively to provide convenient, responsible recycling for the growing electronics waste stream. The program has significantly expanded opportunities for Oregonians to recycle electronic wastes and has shifted responsibility and costs for managing this waste from rate payers and local governments to product manufacturers.
1 Manufacturers in the state contractor program pay recycling fees to DEQ to cover that program’s recycling costs. Manufacturers in manufacturer-run programs pay recycling fees according to their program agreements.
Oregon Department of Environmental Quality 2013-2014 Materials Management Program Information Update
Paint Product Stewardship Program
Oregon’s Paint Product Stewardship Law, adopted in 2009, established the nation’s first statewide product stewardship program for managing leftover latex and oil-based architectural paints, stains and coatings. A pilot program began in July 2010, and the Legislature made the program permanent in July 2013 (HB 2048). The 2013 amendments established clear standards, goals and procedures for the permanent program to benefit consumers buying paint, the paint industry, Oregon’s environment and DEQ.
An estimated 10 percent of paint sold each year in the United States is unused. Leftover paint is often the largest component of materials delivered to household hazardous waste collection programs, and managing it is expensive for local governments. Paint waste can be captured for reuse, recycling, energy recovery or safe disposal.
PaintCare, an industry-run product stewardship organization implements the program on behalf of architectural paint manufacturers under a Plan approved by DEQ, who oversees the program. Although Oregon’s was the first state paint product stewardship program, PaintCare now operates programs in eight states. Oregon’s program is supported by a fee assessed on each can of paint purchased in Oregon. From 2010 to December 2013, the Oregon Paint Product Stewardship Program:
Established over 120 permanent collection sites, mostly at retail locations, but also including many local government and franchised hauler facilities
Collected nearly 2 million gallons of leftover paint
Recycled about two-thirds of the latex paint collected back into latex paint Shifted much of the cost of paint recycling from local governments to those who
purchase paint. Metro reported that the paint product stewardship program saved the regional government more than $1 million annually during this period. Oregon counties that operate household hazardous waste programs reported cost savings on paint disposal, but most still pay for the cost of collecting paint, which increases as volume of paint collected increases.
More information on the program's performance is available at
www.deq.state.or.us/lq/sw/prodstewardship/paint.htm.
Bottle Bill
Legislation passed in 2011 added all beverage containers to the Oregon Bottle Bill except containers for distilled liquor, wine, dairy and plant-based milk and infant formula, effective Jan. 1, 2018. The refund value could also double to 10 cents per container by Jan. 1, 2017, or any subsequent date, if the return rate for beverage containers remains under 80 percent for two consecutive years. Primary responsibility for the implementation of the Bottle Bill law rests with Oregon Liquor Control Commission, with DEQ providing policy and technical assistance. Since 2012, beverage distributors and distributor cooperatives are required to report their sales and returns to the Oregon Liquor Control Commission each year. The redemption rates were 70.95 percent and 70.97 percent for 2012 and 2013, respectively. To try to raise the return rate, the Oregon Beverage Recycling Cooperative has been working with local grocery stores to try to increase recovery by establishing stand-alone redemption centers to provide convenient return services to customers. There are now 10 such stand-alone redemption centers operating in
Oregon Department of Environmental Quality 2013-2014 Materials Management Program Information Update Oregon, all with great success and high return volumes. It will take substantial efforts, however,
to raise the beverage return rate to the 80 percent goal before January 2016, and thus not trigger the 10-cent refund value in 2017.
Foundational Research and Analysis
A key foundational activity called for in Materials Management in Oregon: 2050 Vision and
Framework for Action is to determine how to maximize benefits of recovery and reduce life cycle
impacts for specific materials. DEQ developed a list of priority materials for discards with potentially high environmental impacts by evaluating their relative impacts on key environmental measures including climate and energy. Plastics and food waste were identified as such high impact materials. In 2014, with funding from Metro, DEQ conducted two assessments to better understand options for plastics recycling and organic waste treatment.
Plastics Recycling Assessment
DEQ conducted a year-long assessment of the potential to increase plastic recycling in Oregon. A diverse group of stakeholders and experts in Oregon and nationally contributed to this effort. The study will be completed in early 2015. Preliminary findings indicate that some of the best
opportunities for increasing plastic recycling in Oregon include increased recovery of rigid plastics from grocery stores, restaurants, and other businesses; increased recovery of film plastic from businesses; increased drop-off and take-back programs for residential plastic bags and film plastic; and potentially expanding recycling collection programs to accept other rigid plastics including large plastic products. The last item would require substantial change to Oregon's recycling collection systems – something that would require significant time and work with collectors and stakeholders to implement.
Increased recovery of plastics could also benefit greatly by increasing the local capacity of plastics recyclers to accept a wider range of plastic items and sort and prepare them into marketable grades of resin that can be used directly by plastics manufacturers. DEQ plans to work with plastics recyclers and collectors to explore ways to efficiently boost the local sorting and processing capacity for plastics recycling.
Organic Waste Treatment Assessment
DEQ commissioned a study to identify the preferred use of food that is not recovered for use by humans or livestock. Several stakeholders representing organizations and industries that manage food waste participated in the project. The study included a systematic literature review of life cycle assessment (LCA) studies that cover one or more of four targeted food waste treatments:
Aerobic composting Anaerobic digestion
In-sink grinding via a food waste disposer, and managed with other sewage at a wastewater treatment plant
Landfill
The reviewers assessed climate, energy and soil productivity impacts for each of the food waste treatments. In addition to inventorying greenhouse gas (GHG) emissions and energy use for these treatments, the assessment also noted potential benefits for each treatment including energy displacements (for example, electricity from anaerobic digestion or landfill methane combustion replacing Oregon grid electricity) and potential soil productivity benefits from soil carbon sequestration, fertilizer replacement, water conservation and yield increase.
Oregon Department of Environmental Quality 2013-2014 Materials Management Program Information Update Figure 1 below shows rankings for the four organic waste treatments with their potential climate,
energy, and soil productivity impacts. The rankings use 1 for best and 4 for worst. Each treatment’s rankings vary depending on impact category. Aerobic composting and anaerobic digestion always rank first or second, except that aerobic composting ranks last on energy impacts. This occurs because aerobic composting does not produce an electric power output whereas the other three do. Landfill always ranks last, except for energy where it ranks third, ahead of aerobic composting. In-sink grinding is always third except for energy where it ranks first.
Figure 1. Impact Rankings for Food Waste Treatments
Potential Soil Productivity Benefits
Treatment Climate Impact Energy Impact Soil Carbon Fertilizer Replacement Water Conservation Yield Increase Aerobic composting 2 4 1 2 1 1 (tie) Anaerobic digestion 1 2 2 1 2 1 (tie) In-sink grinding 3 1 3 3 3 3 Landfill 4 3 4 4 4 4
Impacts are reported on a relative scale, with 1 = best, and 4 = worst
These results may help inform local governments’ planning efforts to determine what food waste recovery program will provide the best environmental performance. The full study, "Evaluation of Climate, Energy and Soils Impacts of Selected Food Discards Management Systems" is available at www.oregon.gov/deq/LQ/Pages/SW/foodwaste.aspx.
D.Household Hazardous Waste
Many local governments continued to provide opportunities to safely dispose of household hazardous waste in 2013 and 2014. Given declines in revenue from solid waste disposal fees, DEQ has suspended most of its Household Hazardous Waste programs. If passed, Senate Bill 245 in the 2015 Legislative session would provide adequate funding for the Materials Management Program, enabling DEQ to update its Household Hazardous Waste Plan. In updating the plan, DEQ would incorporate stakeholder input to identify high priority Household Hazardous Waste projects.
DEQ-Sponsored Household Hazardous Waste Programs
Mercury Collection from Homeowners
DEQ continued to offer a program to collect elemental (liquid) mercury from homeowners who had large quantities of mercury, but increased the minimum amount eligible for collection from three pounds to 10 pounds.
Oregon Department of Environmental Quality 2013-2014 Materials Management Program Information Update
School Lab Cleanout Program
DEQ continued the school lab cleanout program, but with most program costs paid by local governments. Under this program, a school lab specialist funded by DEQ visited participating schools and identified unneeded and unsafe chemicals, which were removed and managed as hazardous waste. In most cases local governments paid for disposal. The lab specialist also provided training for teachers on safer chemicals and chemical management practices to use in the future. In 2013 and 2014, 34 school labs in eight counties were cleaned out and more than 6,200pounds of unneeded school lab chemicals were collected and safely disposed.
Household Hazardous Waste Prevention
DEQ continued to distribute two educational resources via Internet and hard copy to help
Oregonians reduce their use of toxic substances at home: Natural Gardening and The Hazardless
Home Handbook.
DEQ severely curtailed the grant program for local household hazardous waste planning and collection facilities and suspended the mercury thermometer exchange program and funding for household hazardous waste collection events, which collected household hazardous waste in counties with no other household hazardous waste services.
Local Government Household Hazardous Waste Collection Programs
In 2013, 71 percent of Oregonians had access to local facilities that collected household hazardous waste on multiple days throughout the year. Another 17 percent of residents had convenient access to at least one special household hazardous waste collection event. Eleven Oregon counties had no household hazardous waste collection facilities or events in 2013.Fluorescent Lamps
Exposures to mercury can affect human health. The 2012 Oregon Legislature passed Mercury in Lighting Products legislation (ORS 646A.560 – ORS 646A.566) to set standards for the amount of mercury that may be contained in general purpose lamps, and prohibited manufacturers from selling lamps in Oregon that contain mercury in an amount exceeding the mercury content standards. It established state procurement guidelines to ensure the state evaluates the full range of lighting issues including mercury content, energy use and lamp lifetime. The content standards in the law are the result of negotiations between lamp manufacturers, represented by the National Electrical Manufacturers Association, Oregon DEQ and Metro.
The law requires DEQ to report once to the Legislature after Jan. 1, 2015, on whether the State of California has adopted, in whole, or in part, the mercury content standards for compact
fluorescent lamps contained in the RoHS 2 Directive, adopted by the European Parliament and the Council of the European Union on June 8, 2011. California has not adopted these standards. Also required is an update about whether changes have been proposed in the European Union to amend mercury standards in the RoHS 2 Directive. Although some changes have been proposed, no changes have been adopted to-date. Finally, DEQ is directed to recommend whether the Oregon Legislature should change the amount of mercury allowed under the mercury content standards established by ORS 646A.564. DEQ does not recommend changes to the Oregon standards at this time.
Oregon Department of Environmental Quality 2013-2014 Materials Management Program Information Update
E. Disposal Facility Regulation
Many DEQ program staff still dedicate the majority of their time to regulating solid waste disposal sites.
Municipal Disposal Facilities and Permits
Oregon has 27 operating municipal solid waste landfills and one municipal solid waste energy recovery facility. More than 90 Oregon landfills were closed in the past two decades, and must be monitored to ensure they do not leak contamination. The need for regulatory oversight continues well beyond the date at which a facility stops accepting waste for disposal. Continued monitoring of groundwater and methane gas levels may be necessary for decades after a facility closes. Many landfills that remain open are larger facilities that accept waste from regional rather than local areas. Some of these landfills are among the nation’s largest, providing Oregon with sufficient disposal capacity for many years to come.
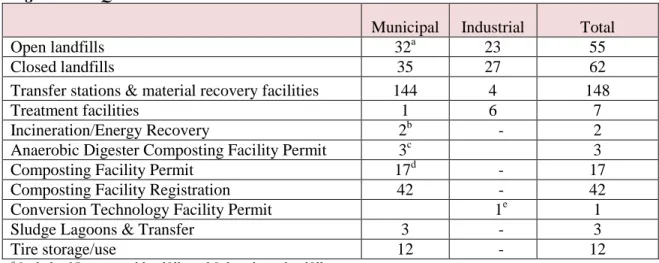
The DEQ Materials Management Program currently oversees 348 disposal site permits and 17 tire carrier permits statewide. The numbers of permits in each major category appear in Figure 2 below. These numbers do not include short-term disposal permits or beneficial use
determinations. In addition to existing permits, DEQ receives 10 to15 new permit applications each year.
Figure 2. DEQ Solid Waste Permits
Municipal Industrial Total
Open landfills 32a 23 55
Closed landfills 35 27 62
Transfer stations & material recovery facilities 144 4 148
Treatment facilities 1 6 7
Incineration/Energy Recovery 2b - 2
Anaerobic Digester Composting Facility Permit 3c 3
Composting Facility Permit 17d - 17
Composting Facility Registration 42 - 42
Conversion Technology Facility Permit 1e 1
Sludge Lagoons & Transfer 3 - 3
Tire storage/use 12 - 12
a Includes 27 municipal landfills and 5 demolition landfills.
b Includes one incinerator that closed in 2012.
c Includes two permits pending issuance in spring 2015.
d Includes two permits pending issuance in spring 2015.
e Includes one permit pending issuance spring 2015.
A list of current active permitted facilities (including municipal solid waste disposal landfills, transfer stations, and compost, material recovery, waste tire and household hazardous waste facilities) is available at www.deq.state.or.us/lq/sw/disposal/permittedfacilities.htm.
The trends in Figure 3 show that the introduction of new federal regulations in 1991, increasing the environmental protection of landfills, had the desired outcome of reducing the number of small, unlined landfills in favor of establishing transfer stations where solid waste is collected and transferred to larger, lined landfills. DEQ activities that support the permitting program include issuing new, renewed or modified permits, plan review, technical assistance and inspections and
Oregon Department of Environmental Quality 2013-2014 Materials Management Program Information Update enforcement. The Materials Management Program shares resources statewide to stay current with
issuing permits.
Figure 3. Open Municipal and Demolition Landfills 1983-2012
Short-term Disposal Permits and Beneficial Use Determinations
In addition to permitting solid waste disposal sites, DEQ works with businesses, local governments, the Oregon Department of Transportation, Army Corps of Engineers, ports and others to permit one-time or short-term disposal of slightly contaminated soil or sediment at locations where environmental impacts can be addressed by how the material is disposed and covered. DEQ also reviews applications to beneficially use waste in ways that protect human health and the environment. Expensive and unnecessary disposal costs can be avoided when waste materials are beneficially used. Through these efforts, DEQ provides ways to allow redevelopment of contaminated sites or brownfields and construction of roads and otherinfrastructure to take place in a more cost-effective manner. These options also allow waste to be reused as fill or to make new products. DEQ receives five to 15 authorization requests per year and two to five beneficial use applications per year. To date, DEQ has issued 16 Beneficial Use Determinations which are listed at
www.deq.state.or.us/lq/sw/disposal/beneficialusedeterminations.htm.
Solid Waste Orphan Account
Local governments, both cities and counties, throughout Oregon have owned and operated landfills for many decades to serve their residents. In some cases local governments have contracted with privately owned landfills. Many old, abandoned landfills in Oregon were poorly sited and unlined, often operated without permits, and were closed without adequate caps or controls. In 1989 the Oregon Legislature created the Solid Waste Orphan Site Account to help local governments fund the cleanup of hazardous substances releases from these sites, and also to cover cleanup costs at privately owned orphan sites.
20 40 60 80 100 120 1983 1987 1991 1995 1999 2003 2007 2011 Number of Landfills
Oregon Department of Environmental Quality 2013-2014 Materials Management Program Information Update Since 1993, DEQ has collected $0.13/ton of all domestic solid waste disposed in Oregon or
transported out-of-state for disposal. This solid waste orphan site fee funds the Solid Waste Orphan Site Account. Funds can be used for cleanup of hazardous substances at solid waste disposal sites owned or operated by a local government and at privately owned or operated sites that have received domestic solid waste where the responsible party is unknown, unwilling or unable to undertake the cleanup. The statute also includes requirements for matching funding from local governments to access the account and caps their liability.
In 2013-14 DEQ awarded grants of up to $100,000 to local governments to help cover site investigation costs, including City of Astoria for Astoria Landfill, City of Baker City for Baker Sanitary Landfill,City of Portland for Oaks Bottom Landfill and the City of Creswell for DeBerry Landfill.DEQ also used account funds for ongoing expenses to address contamination at two privately-owned orphan landfills that accepted domestic waste: Killingsworth Fast Disposal Landfill in Portland (initially addressed in 1996), and Santosh Landfill in Columbia County (initially addressed in 2003).
Looking forward, Deschutes County is considering grant and loan options from the account to help investigate and clean up the former Deschutes County Demolition Landfill.
Composting Facilities
DEQ began permitting composting facilities in 1999. In 2009, the Environmental Quality Commission adopted new composting facility rules that require all composting facilities to meet performance standards designed to protect surface water and ground water, prevent significant offsite odors and ensure pathogen reduction in finished composted materials. DEQ screens proposed composting facilities to evaluate risks and determine the type of composting permit required. Facilities with low environmental risk are issued a simple registration permit. Facilities that pose potential risks to surface water or groundwater or for creation of odors offensive to neighbors must develop a comprehensive operations plan and are issued a full composting facility permit. In 2013, as part of the conversion technology rulemaking, the Environmental Quality Commission adopted rules to regulate anaerobic digestion as a composting process. The new rules inserted permitting requirements specific to anaerobic digestion into the composting rules. Adequate composting facility processing capacity has become an emerging issue over the past several years, particularly for the Portland metro area, as more cities begin collecting food scraps. By fall 2013, the number of composting facilities accepting food scraps had leveled off at 11 facilities state-wide, with only four accepting commercially-generated food scraps from Portland. These four facilities were unable to handle the growing amount of food scraps generated in the Portland metro area, and a significant amount was trucked to composting facilities in Washington State.
The opening of the DEQ-permitted JC Biomethane Digester in October 2013 has significantly expanded Oregon’s processing capacity. Located in Junction City, it is the first “biogas plant” designed to produce energy from the digestion of post-consumer commercial food scraps. The facility’s 28,000 ton per year processing capacity has allowed the redirection of most food scraps back to Oregon facilities. However, processing capacity for food scraps will again become an issue as Portland and other cities successfully increase collection programs.
Anaerobic digestion and traditional composting produces significant environmental benefits. Composting decreases greenhouse gas emissions by reducing the amount of methane escaping to the atmosphere from the decomposition of organic materials in landfills. Anaerobic digestion eliminates methane escape by capturing all methane generated and converting it to electricity or vehicle fuel. The use of the digestates and composted materials produced also increases soil
Oregon Department of Environmental Quality 2013-2014 Materials Management Program Information Update productivity, increases soil carbon storage, reduces or eliminates the need for chemical fertilizers,
improves soil porosity and water retention, and promotes higher yields of agricultural crops. Along with these benefits, as composting operations have expanded in the Portland metro area, so have concerns from some of their neighbors about offsite odors, vectors and other environmental issues. DEQ will continue to work closely with local governments, compost operators and the public to help ensure that composting facilities meet environmental standards.
In 2013, the Oregon Legislature passed Senate Bill 462, which became effective on June 26, 2013. This bill requires cities and counties to hold a pre-application conference for certain composting facilities before an applicant may submit an application for land use approval. DEQ is required to attend these pre-application meetings. The bill is in response to negative public reaction to odors generated by a large composting facility and legislative concern that public input should be accommodated before the approval of such facilities. As of January 2015, DEQ staff attended two pre-application conferences for new composting facilities, with positive results. Planning staff and the public involved in the process indicated that pre-application and public notification meetings were very useful and provided a forum for addressing concerns early in the process.
Conversion Technology Facilities
Conversion technology facilities use thermal and chemical processes to produce fuels and other potentially useful materials from solid waste. Examples include pyrolysis and gasification facilities that heat waste plastics and tires to high temperatures under low-oxygen conditions to produce fuels and other products. In August 2013, the Oregon Environmental Quality
Commission adopted rules governing conversion technology facility permitting and operation. Key provisions in the new rules include:
Regulation of anaerobic digesters as composting facilities, with appropriate permit requirements
A new permit classification for conversion technology facilities with permit requirements based on the level of environmental and public health risk posed by the facility
A fee schedule appropriate for conversion technology facilities
Exemptions from permit requirements for very low-risk conversion technology facilities Performance standards for all facilities, including those exempt from permit requirements
F. Metro’s Waste Reduction Program: Compliance with
State Requirements
DEQ approved Metro’s Regional Solid Waste Management Plan 2008-2018 update on April 24, 2009. Metro is required by Oregon Revised Statute 459.345 to provide a report to the Oregon Environmental Quality Commission two years after approval. In April 2011 Metro submitted a
Status Report on the Metro Region’s Waste Reduction Programs to the commission. The
Regional Solid Waste Management Plan identifies strategies that Metro and Metro-area local
governments will pursue to increase the recovery of waste to meet the wasteshed’s 64 percent statutory recovery goal. Strategies include targeted efforts in the single-family, multi-family, business and building industry sectors. The plan also identifies strategies to reduce the amount of solid and household hazardous waste generated. Strategies include education on waste prevention and alternatives to household hazardous waste products, product stewardship initiatives and implementation of sustainability measures for the region’s solid waste vehicles and facilities. The
Oregon Department of Environmental Quality 2013-2014 Materials Management Program Information Update report provides information to the Environmental Quality Commission demonstrating how Metro
and local governments work together to ensure that the Metro region’s activities comply with the waste reduction program and waste reduction goals outlined in Metro’s plan.
Metro continues to work with its local government partners to increase recovery. Three areas in particular have been emphasized: construction and demolition debris, businesses discards, and food waste. Metro convened a Solid Waste Alternatives Advisory Committee in early 2014 to engage government, business and citizen stakeholders in development of Metro’s Solid Waste
Roadmap as well as to discuss and advise on other issues affecting solid waste recovery, delivery
of services, community impacts, and costs. The Solid Waste Roadmap is a long-term effort to consider and determine the best approaches to manage the region’s garbage and other discarded materials in the years ahead. This includes a look at transfer system reconfiguration, organics capacity, and fees. Metro will undertake a mid-term review of its Regional Solid Waste Management Plan in early 2015. In 2013, Metro met its legislatively mandated 64 percent recovery goal for the first time.
Oregon Department of Environmental Quality 2013-2014 Materials Management Program Information Update
3.
Waste Generation, Recovery and
Disposal Data
A. Waste Generation
Waste generation is defined as the sum of materials disposed and recovered. It is a rough measure of the total amount of materials discarded by households, businesses, institutions and
governments. It includes garbage as well as materials separated for recycling, energy recovery and off-site composting. Generation is a crude measure of consumption, and for many materials, environmental impacts of production (the corollary of consumption) are many times higher than the impacts of disposal. As such, waste generation is an important indicator of larger
environmental impacts.
Methods to reduce waste generation include:
Waste prevention – Using and wasting less by acquiring fewer items as raw materials, packaging or consumables or by purchasing more durable goods
Reuse – Using something again in its original form (as opposed to recycling which reformulates materials into new products)
Composting on site so that materials don’t enter the solid waste stream
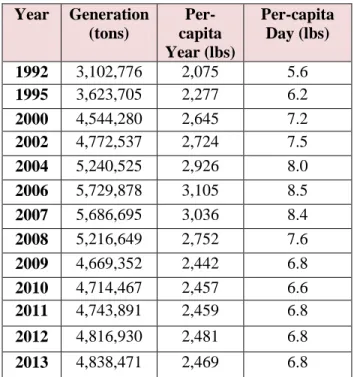
Figure 4 reports the amount of municipal post-consumer waste generated in Oregon. It shows that generation of solid waste in Oregon grew between 1992 and 2006, from 3.1 million to 5.7 million tons/year. While population growth contributed to this increase, Oregonians, including
individuals and businesses, produced on average of 52 percent more discards per capita in 2006 than in 1992.
Figure 4. Solid Waste Generation
Year Generation (tons) Per-capita Year (lbs) Per-capita Day (lbs) 1992 3,102,776 2,075 5.6 1995 3,623,705 2,277 6.2 2000 4,544,280 2,645 7.2 2002 4,772,537 2,724 7.5 2004 5,240,525 2,926 8.0 2006 5,729,878 3,105 8.5 2007 5,686,695 3,036 8.4 2008 5,216,649 2,752 7.6 2009 4,669,352 2,442 6.8 2010 4,714,467 2,457 6.6 2011 4,743,891 2,459 6.8 2012 4,816,930 2,481 6.8 2013 4,838,471 2,469 6.8
Oregon Department of Environmental Quality 2013-2014 Materials Management Program Information Update Beginning in 2007, waste generation decreased slightly then fell sharply through 2009, reaching
4.67 million tons. It has increased slightly each year since 2009.
In 2013, the state met one of its waste generation goals (per-capita waste generation decreased) but missed its other goal (overall waste generation increased).1 Nevertheless, overall and per-capita waste generation has shown very little change over the past five years, in sharp contrast to much of the 1990s and early 2000s, when waste generation rose steeply. The per-capita waste generation rate for 2009-2013 is lower than it has been in Oregon any time since 1996. This suggests that overall use of materials has decreased over the past ten years, and with it, so have energy use, greenhouse gas emissions and other environmental impacts associated with materials. Recent analysis by the U.S. Environmental Protection Agency suggests that roughly 40 percent of the country’s greenhouse gas emissions are associated with the production and transportation of goods.
B. Recovery Rates
The state met its recovery rate goal2 in 2013 with a rate of 54.0 percent, an increase over the 2012 rate of 53.4 percent. The recovery rate includes materials recycled by households and businesses or sent offsite for composting and some materials burned for energy recovery.
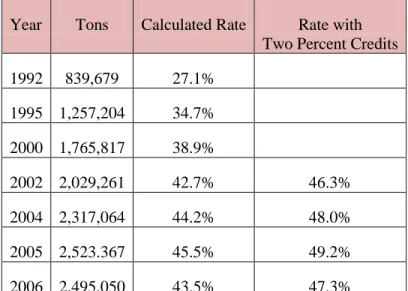
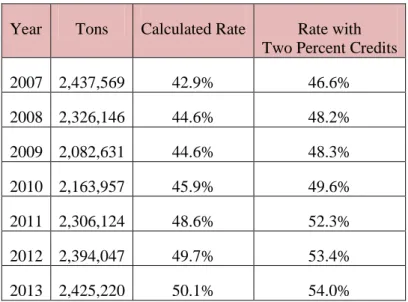
Figure 5 shows that Oregon recovered 2,425,220 tons of materials in 2013, which is an increase of 31,173 tons from 2012. Thus, the state’s calculated recovery rates show an increase in 2013 to 50.1 percent (see Table 3). However, these calculated rates do not include the two percent credits for wastesheds that operate reuse and backyard composting programs. These activities decrease waste generation, but are hard to quantify, so the Legislature created these credits and mandated their inclusion in the state’s official recovery rate, starting in 2001.
Figure 5. Solid Waste Recovery Rates
Year Tons Calculated Rate Rate with Two Percent Credits 1992 839,679 27.1% 1995 1,257,204 34.7% 2000 1,765,817 38.9% 2002 2,029,261 42.7% 46.3% 2004 2,317,064 44.2% 48.0% 2005 2,523.367 45.5% 49.2% 2006 2,495,050 43.5% 47.3%
1 Statutory generation goals (ORS 459A.010) are: no increase in per-capita generation of municipal solid waste in 2005 and subsequent years, and no increase in total generation of municipal solid waste in 2009 and subsequent years.
Oregon Department of Environmental Quality 2013-2014 Materials Management Program Information Update Year Tons Calculated Rate Rate with
Two Percent Credits
2007 2,437,569 42.9% 46.6% 2008 2,326,146 44.6% 48.2% 2009 2,082,631 44.6% 48.3% 2010 2,163,957 45.9% 49.6% 2011 2,306,124 48.6% 52.3% 2012 2,394,047 49.7% 53.4% 2013 2,425,220 50.1% 54.0%
Looking just at materials commonly collected through curbside programs (recyclable paper, most rigid plastic containers, tinned and aluminum cans and glass containers), long-term trends show that recycling programs have been increasingly successful over the years.
Figure 6 shows the amount of these materials that on average each of us recycles or disposes each year. The total generation of these materials remained remarkably constant from 1993 through 2007, before dropping sharply primarily due to the decreased use of paper, particularly for newspapers and magazines. Even as total generation held constant, there was regular movement of recyclable material out of the garbage stream and into the recycling stream. Per-capita disposal of these materials fell from 341 pounds per person per year in 1993 down to 231 pounds per person per year in 2007 and then to 156 pounds per person per year in 2009 (the year of the latest waste composition study). At the same time, per-capita recovery of these materials rose from 361 to 506 pounds per person per year in 2007, before falling back to 417 pounds per person per year in 2009 and remaining essentially flat since then.
Figure 6. Common Recyclable Material Recovery and Disposal Per Capita
0 100 200 300 400 500 600 700 800 1993 1995 1997 1999 2001 2003 2005 2007 2009 2011 2013 Po u n d s p er p er so n p er y ear Disposed Recovered
Oregon Department of Environmental Quality 2013-2014 Materials Management Program Information Update
Materials
Oregon’s 2013 total recovery rate, with credits, of 54.0 percent includes materials collected for recycling or composting as well as some material burned for energy recovery. Major categories of recyclables include:
Metal: The total amount of recovered metals, after decreasing six percent in 2012,
decreased by another six percent in 2013.
Paper (including cardboard): Recovery of paper fibers increased ten percent from
2011-12 and 0.7 percent from 2012-13.
Organic material (wood waste, yard debris, food waste): Overall organics (which
includes wood waste, yard debris, food waste and animal waste/grease) total recovery increased by seven percent in 2013; including a five percent increase in food waste recovery.
Electronics: This material showed a 15 percent decrease in total tons recovered in 2013.
The decrease is likely attributable to lighter weight electronic devices and possibly fewer collections over the year. This includes all electronics - such as microwaves and vacuums - not only those covered by the Oregon E-Cycles program.
Plastic: Total plastics recycling decreased by four percent in 2013. Most of the decline
was for a category called “other rigid plastic.” This decrease is probably related to import restrictions imposed by China in 2013 on mixed plastics contaminated with non-plastic material.
Glass: Glass recovery decreased 0.5 percent in 2013.
Wasteshed recovery rates
Thirteen of the 35 wastesheds increased their total recovery rates in 2013; 15 wastesheds
increased their rates in 2012. Recovery rates in 27 wastesheds remained higher in 2013 than their 2009 recovery rate goals.
Energy savings
Manufacturers save large amounts of energy when they use recycled materials instead of virgin resources. Recycling in Oregon in 2013 (not including composting or energy recovery) saved about 30.6 trillion British thermal units, the equivalent of 245 million gallons of gasoline. That is equivalent to 3.1 percent of 2013 estimated total statewide energy use.
Greenhouse gas reductions
Estimated greenhouse gas reductions from recycling, composting and energy recovery in 2013 are equal to 3.0 million metric tons of carbon dioxide, or the equivalent of reducing the emissions from 690,000 passenger cars. It is also equivalent to reducing approximately 4.5 percent of 2013 estimated statewide greenhouse gas emissions. The greenhouse gas benefits of waste recovery are partly the result of the large energy savings industries gain by using recycled materials in
Oregon Department of Environmental Quality 2013-2014 Materials Management Program Information Update More detailed information on waste generation, material recovery and specific wasteshed
programs can be found in the 2013 Oregon Material Recovery and Waste Generation Report at
www.deq.state.or.us/lq/pubs/docs/sw/2013MRWGRatesReport.pdf.
C. Disposal Data
Solid waste disposed of at municipal solid waste facilities in Oregon, including waste from out-of-state, contaminated soil and other special wastes, increased from 5.35 million tons in 2011 to 5.86 million tons in 2013, down from a high of 6.78 million tons in 2007. Oregon municipal solid waste actually decreased between 2011 and 2013, but waste imports from outside Oregon
increased substantially.
Oregon continues to receive a significant amount of landfill-bound waste generated outside of Oregon. In 2013, about 42 percent of the waste disposed of in Oregon’s municipal solid waste facilities was from outside the state, compared to 36 percent in 2011
Oregon exports only a small fraction of its waste for disposal in other states. In 2013, only 1.9 percent of Oregon’s municipal solid waste went to landfills outside the state.
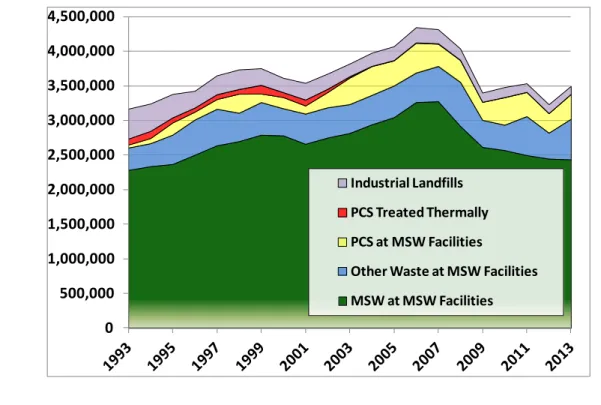
The amount of “counting” solid waste (municipal and construction wastes that "count" towards wasteshed recovery rates) disposed in Oregon in 2013 was 2,413,251 tons or 1,232 pounds per person per year1. This is the lowest per-capita disposal measured in Oregon in more than two decades, and is 18.6 percent below the per-capita disposal rate from 1992. Figure 7 illustrates these trends.
Figure 7. Oregon Wastes Disposed 1993-2013 (tons)
1 “Counting” solid waste includes municipal solid waste, waste tires, construction and demolition debris, animal waste and grease and some inerts such as gypsum. 0 500,000 1,000,000 1,500,000 2,000,000 2,500,000 3,000,000 3,500,000 4,000,000 4,500,000 Industrial Landfills PCS Treated Thermally PCS at MSW Facilities
Other Waste at MSW Facilities MSW at MSW Facilities
Oregon Department of Environmental Quality 2013-2014 Materials Management Program Information Update After years of per-capita disposal amounts rising steadily until 2007, the decreasing per-capita
disposal is a positive sign environmentally. Part of the decline is probably due to economic conditions, but recovery and waste composition data demonstrate that a substantial amount of material has moved out of the disposal stream and into the recycling and composting stream over time.
For detailed information about disposal and amounts and types of waste disposed, see the
Oregon Department of Environmental Quality 2013-2014 Materials Management Program Information Update
4.
DEQ Materials Management
Program Funding
DEQ’s Materials Management Program is funded primarily by revenue from solid waste tipping fees and permit fees assessed per ton of waste disposed in Oregon. The program does not receive general funds. Revenue from these fees has declined sharply since 2008 – to near the same levels as in 2000. This decline mirrors the decline in disposal, since solid waste fees are tied to tons disposed. In addition, these solid waste fees have not changed since 1994. Fees did not need to change as long as increases in disposal tonnage kept pace with increasing costs.
At the same time revenue has been declining, costs of providing services has increased, as costs such as labor and contracting have increased. DEQ has reduced operating expenditures as revenue declined. For example, in the Materials Management Program budget for the 2011-13 biennium, DEQ cut more than 10 full time equivalent positions and over $900,000 in grants and contracts – about half of that in grants to communities for solid waste programs and for
Household Hazardous Waste collection. Simultaneously DEQ has gained efficiencies in its operations and is continuing efforts to work more effectively as it focuses resources on priorities under the 2050 Vision and Framework for Action.
Nevertheless, looking ahead DEQ has determined that without additional revenue from fee increases, the Materials Management Program will need to continue cutting staff and programs to cover costs. As Oregon has recovered from the recession, disposal tonnage has stabilized and begun to increase slightly in recent months. DEQ projects that a small upward trend in disposal will continue, but does not expect disposal tonnage to rebound to pre-recession levels.
Substantially more materials are moving from disposal to recovery and composting, and waste prevention efforts will curb waste generation.
The 2050 Visionand Framework for Action identifies securing adequate program funding as
essential for measureable progress toward achieving the vision. In 2013-14 DEQ worked with stakeholders to evaluate program funding, resulting in Senate Bill 245 for the 2015 Legislative session. Senate Bill 245 would increase tipping fees to provide adequate revenue to restore and enhance programs and grants for household hazardous waste collection, waste prevention and reuse, recycling, composting and waste recovery. DEQ’s separate budget request to increase permit fees by rule would provide sufficient revenue to maintain permitting and oversight work at current levels.
Oregon Department of Environmental Quality 2013-2014 Materials Management Program Information Update
Appendix 1. Oregon E-Cycles
Program Performance,
Implementation and Collection
Site Map
Oregon E-Cycles began collecting and recycling computers, monitors and TVs in January 2009, and completed its fifth year of operations in December 2013. Figure 8 summarizes program performance since 2009.
Figure 8. Oregon E-Cycles Program Performance
2009 2010 2011 2012 2013 Totals
Recycling / Reuse
Statewide recycling goal (millions
of pounds) 12.2 21.5 23 27 28.6 112.3
Total recycled (millions of
pounds)* 19.0 24.2 25.9 28.1
2
29.73 123.5