Multicriteria Classification with unknown categories: a
Clustering-Sorting approach and an application to Conflict
Management
Clara Rocha,
∗†Luis C. Dias,
†‡Isabel Dimas
§¶January 29, 2012
∗Escola Superior de Tecnologia da Sa´ude de Coimbra, Rua 5 de Outubro, S. Martinho do Bispo, Ap. 7006, 3040-162
Coimbra, Portugal, email: clarapr@estescoimbra.pt.
†INESC Coimbra, R. Antero de Quental 199, 3000-033 Coimbra, Portugal.
‡Faculdade de Economia, Universidade de Coimbra, Av. Dias da Silva 165, 3004-512 Coimbra, Portugal, email:
lmcdias@fe.uc.pt.
§Escola Superior de Tecnologia e Gest˜ao de ´Agueda da Universidade de Aveiro, Campus Universit´ario de Santiago
3810-193 Aveiro Portugal, email: isabeldimas@hotmail.com
¶Faculdade de Psicologia e de Ciˆencias da Educa¸c˜ao - Universidade de Coimbra, R. Col´egio Novo 3000 Coimbra, This is the peer reviewed version of the following article: Rocha, C., L.C. Dias, I.
Dimas, “Multicriteria Classification with unknown categories: a Clustering-Sorting approach and an application to Conflict Management", Journal of Multi-Criteria Decision Analysis, Vol. 20, N.º1, pp. 13–27, 2013, which has been published in final form at http://dx.doi.org/10.1002/mcda.1476 . This article may be used for non-commercial purposes in accordance with Wiley Terms and Conditions for Self-Archiving
Abstract
This work proposes an approach to sort a set of alternatives considering multicriteria categories with a partial order structure. It can be considered a heuristic approach since it does not attempt to derive an optimal partial order among all conceivable clusters of alternatives. Rather than this, it intends to be a simple approach that is transparent to the Decision Maker (DM) whose assistance is sought to help shaping the results. The approach proposed arises from the conjugation of traditional Clustering analysis and Mul-ticriteria sorting tools. At the outset, the number of categories and their characteristics is unknown. First we need to detect only the clusters themselves based on a similarity measure independent of the preferences of the DM. Next, we detect potential partial order relations that might exist between them, according to the subjective preferences of the DM. Such preferences are elicited only after the DM has examined the clusters detected and deemed that these categories made sense. The new approach performs very well in a real-world problem of intragroup conflicts and conflict handling strategies.
Keywords: Multicriteria decision aiding (MCDA), classification, outranking methods, ELECTRE, K-Means algorithm, intragroup relations, conflict management.
1
Introduction
In an MCDA context, sorting problems are concerned with evaluating a finite set of alternatives, based on a set of criteria, in order to assign them to pre-defined mutually exclusive categories. In practice, this type of sorting is widely used, namely in finance, economics, marketing, medicine, and human resources management, among others (Doumpos and Zopounidis, 2002).
Another widely referenced technique for classification problems is Clustering. Clustering defines groups in order to include in the same group similar alternatives with respect to some similarity criterion (namely, distance measures). The resulting groups should exhibit high internal homogeneity (within groups) and high external heterogeneity (between groups). Here, contrarily to the usual MCDA sorting problematic (Roy and Bouyssou, 1993), groups are unknown a priori. In fact, it is important to understand the difference between clustering and supervised classification. In supervised classification, we are provided with a collection of labelled alternatives; the problem is to label a newly encountered, yet unlabelled, alternative. Typically, the given labeled alternatives are used to learn the descriptions of categories which in turn are used to label a new alternative. In the case of clustering, the problem is to group a given collection of unlabeled alternatives into meaningful clusters. In a sense, alternatives are associated with clusters also, but the category labels are data driven; they are obtained solely from the data (Jain et al., 1999).
The complementary nature of Multicriteria sorting and Clustering motivated several investigation streams with the goal of gathering both approaches. The incorporation of preferences in cluster analysis was firstly pointed out by De Smet and Montano (2004). Their basic idea is that all the objects inside the same cluster are similar in the sense that they are preferred, indifferent and incomparable to more or less the same objects (similar profiles).
De Smet and Guzman (2004) and Figueira et al. (2004) have extended the classical K- means in a multicriteria framework. Although the extension of the K-means explicitly uses a preference relation between the actions, there does not exist a relation on the clusters.
Specifically, we are interested in multicriteria clustering problems, and we pursue the following strategy suggested in Cailloux et al. (2007). First, a classical clustering algorithm (K-means algo-rithm) is applied on the data. In a second step, a multicriteria pairwise comparison procedure will be applied in order to come up with an outranking relation on the clusters. The outranking relation computed in ELECTRE (Mousseau and Dias, 2004, Roy and Bouyssou, 1993) will be used for this purpose.
The work developed to multicriteria classification has mainly focused on the assignment of al-ternatives to totally ordered categories. One of the exceptions is the work developed by Nemery (2008), who considered partially ordered classes, but in multicriteria sorting problems rather than clustering. However, there are problems where many alternatives are not comparable. For example, in diagnosing the attention-deficit hyperactivity disorder (ADHD) (Tannock, 1998) in children we can find four groups based on the symptoms of the patients: A) children displaying no relevant symptoms, B) children with ADHD with predominantly inattentive type, C) children with ADHD with predominantly hyperactive-impulsive type, and D) ADHD of combined type (displaying both types of symptoms). While it could be considered that A is preferable to B and C, and the latter
are preferable to D, one could consider that categories B and C are not comparable.
In this paper, we present an approach to sort a set of alternatives considering multicriteria categories with a partial order structure. It can be considered a heuristic approach since it does not attempt to derive an optimal partial order among all conceivable clusters of alternatives. First we detect only the groups themselves and then we detect potential partial order relations that might exist between them. At the outset, the number of categories and their characteristics are unknown. The methodology developed is applied on a real-world problem concerning intragroup conflicts within the workgroup and how they manage them (Dimas, 2007). The motivation to apply this approach to the mentioned problem was the fact there are few studies that apply cluster analysis to group processes. One of the exceptions is the study developed by Munduate et al.(1999) where the au-thors seek to identify the specific combinations of conflict handling styles that result in differentiated patterns of conflict management.
This paper is structured as follows. The next section will introduce the basic notation that will be used. Section 3 presents the Clustering-Sorting approach, which is illustrated using an example from the sorting literature in Section 4. We propose the use of clustering and sorting multicriteria models for a real-world problem of intragroup conflicts and conflict handling strategies in Section 5. Finally some conclusions and topics for future research are presented.
2
Formalization
LetA={a1, ...am}denote a set of alternatives (actions, objects, projects) represented by a vector of evaluations on n criteria. Let G={g1(.), ..., gn(.)} denote the set of criterion function, such that
gt(ai) indicates the evaluation (performance) of the i-th alternative according to the t-th criterion. Without loss of generality, we will assume that the higher the performance value gt(ai), the better the alternative will be. Let C(ai) denote the category to which alternative ai is assigned to.
A partially ordered partition of A in k categories P= {C1, C2, ..., Ck}is defined as follows:
• A=∪i=1,...,kCi
• Ci∩Cj =∅, i̸=j
• The preference relation among categories (which we denote ≻) is asymmetric, transitive and not necessarily complete.
Formally, a classification with partially ordered categories is defined among the categories: a category can be higher or lower ranked in comparison with some categories, whereas it can be considered incomparable with other different categories. “Ci ≻ Cj” denotes that category Ci is better than category Cj and “Ci ⊥Cj” denotes that category Ci is incomparable to Cj.
Ideally, the partitionP should be such that:
• Similar alternatives belong to the same category (Homogeneity condition).
• If alternative ai is incomparable to aj then these alternatives should not belong to the same group (Heterogeneity condition).
• If alternative aj is preferred to ai then aj should not belong to a worse group (Preference
condition)
In very general terms, to obtain such a partition, on a first stage, similar alternatives are as-signed to homogeneous categories, using a traditional clustering algorithm, such as K-means. With clustering we find potential categories such that the alternatives within a given category are more similar to each other than to alternatives in other categories, thus the Homogeneity and Hetero-geneity conditions are addressed. After checking with the DM that categories found make sense, they are ranked based on the preferences of the DM elicited and one of the following two strategies: (A) ranking their centroids, using an ordinal ranking method, such as ELECTRE; (B) through the most common preference relation between alternatives in the categories used an ELECTRE-type outranking relation. The Preference relation is assessed only in this stage.
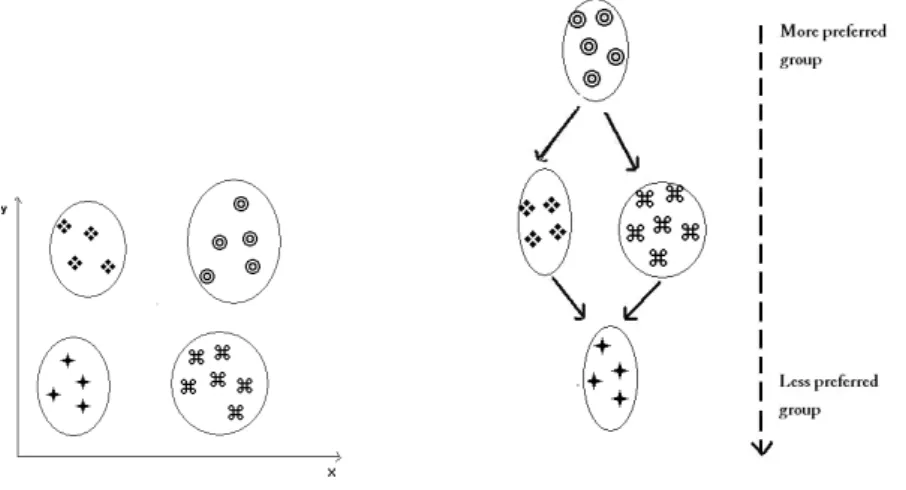
To illustrate graphically this method, let us consider the schema presented in Figure 1. In this case similar alternatives are first grouped into homogeneous categories, and then the resulting categories are partially ranked based on their centroids.
Figure 1: Ilustration of the Clustering-Sorting method.
In this example, four homogeneous categories of alternatives are initially formed: the group of alternatives that display a poor performance in evaluation criteria x and y; the group of alternatives that display a good performance in both criteria; the group of alternatives that display a good behavior for criterion x and a poor behavior for criterion y, and the group of alternatives that display a good behavior for criterion y and a poor behavior for criterion x. Note that if a complete order was required, one might consider the latter two groups as indifferent, that is, one might merge them. However, in the context of this method, such a merger is not warranted. On the second stage, the 4 obtained categories are then ranked based on the DM’s preference model, originating a structure of partially ordered categories (Figure 1): the best category has the group of alternatives with the best performance for both criteria, the worst category has the alternatives with the worst performance for both criteria and the others alternatives are assigned in two incomparable categories.
3
The Clustering-Sorting approach
The Clustering-Sorting approach is divided in four stages:
1. First stage - Clustering: similar alternatives are grouped in homogeneous categories, based on a traditional clustering method and before the preferences of the DM are elicited. The purpose of this stage is to discover natural clusters present in the data regardless of the DM’s evaluation of the alternatives. We will use the K-Means method based on a Euclidean distance. The uncertainty about the number of categories is studied using hierarchical methods (for details see, e.g., Jain et al., 1999).
2. Second stage - elicitation phase: After learning the categories that can be formed, the DM may indicate information about the multicriteria aggregation model, such as criteria weights (we consider in this paper the aggregation according to ELECTRE (Roy and Bouyssou, 1993)). 3. Third stage - Ordinal Sorting: a partial order is sought on the set of the categories obtained
on the first stage: the centroids of the categories obtained on the first stage are compared or the most common preference relation between alternatives in the categories is used. In both cases we used an ELECTRE-type outranking relation.
4. Fourth stage - Consistency checking: the quality of the obtained partition is considered to be the probability of finding a preference inconsistency if a random pair of alternatives is audited.
1.First stage - Clustering
On the first stage the method used is K-Means (Hartigan 1975; Hartigan and Wong 1979), which is applied to the alternatives of A. The K-Means algorithm is a very popular clustering tool used in scientific and industrial applications (Pavel, 2006). Its name comes from representing each of k clusters Ci by the average ϱi of its points, the so-called centroid.
This method produces k clusters by optimizing a criterion function, e.g., the squared error crite-rion, given by the sum of discrepancies between a alternative and its centroid (1)
k ∑ j=1 ∑ ai∈Cj ∥ai−ϱj∥2 (1)
which uses theL2−norm(Euclidean distance) given by the sum of the squares of errors between
the alternatives ai and the corresponding centroidsϱk (2).
∥ai−ϱj∥2 = v u u t∑n j=1 (gj(ai)−gj(ϱk))2 (2)
• Step 1: arbitrary selection of k alternatives to be the initial centroids of the k clusters (k is parameter to be set).
• Step 2: each alternative is associated to a cluster, for which the dissimilarity between the alternative and the cluster’s centroid is smaller than for the remaining ones.
• Step 3: new centroid clusters ϱk are defined as the average of alternatives of the cluster Ck (with mk alternatives): ϱkj = m1
k
∑mk
i=1gj(ai)
• Step 4: return to step 2 until a convergence criterion is met.
It starts with a random initial partition and keeps reassigning the alternatives to clusters based on the similarity between the alternative and the centroid and, as a consequence, new centroids are computed (step 3). This leads to the movement of the centroids in the space. The algorithm is halted either when the centroid movements are insignificant, or there is a residual reallocation of the alternatives between clusters, or the maximum number of iterations is reached, or until another convergence criterion defined by the DM is met.
According to Jain et al. (1999), the first issue that arises in the K-Means method is to know what the value of k should be, i.e., the number of clusters to form. There are some rules-of-thumb to answer this question. The application of hierarchical methods as an exploratory technique that indicates the value of k to use is a good statistical technique (Pavel, 2006).
In hierarchical clustering, to merge or split clusters, the distance between alternatives has to be generalized to the distance between clusters. Such derived proximity measure is called a linkage metric. Major inter-cluster linkage metrics (Murtagh 1985, Olson 1995) include single link, average link, and complete link. The underlying dissimilarity measure (usually, a distance) is computed for every pair of alternatives with one alternative in the first set and another alternative in the second set. A specific operation is applied to pair-wise dissimilarity measures, such as:
• d(Cs, Ct) = minimum {distance (ai, aj) : ai ∈Cs, aj ∈Ct} (Single Link)
• d(Cs, Ct) = average {distance (ai, aj) : ai ∈Cs, aj ∈Ct} (Average Link)
• d(Cs, Ct) = maximum {distance (ai, aj) : ai ∈Cs, aj ∈Ct} (Complete Link)
In this work, we used the complete Linkage method to suggest the number of groups. First, we find the most similar pair of clusters in each clustering (for k=1,2,...). When the slope of the straight line distance between the two clusters is relatively small, we find the number of clusters to hold.
In case we need to complement the information given by the complete linkage method to deter-mine the number of clusters, the R-squared coefficient, often called the coefficient of determination, is used. It is defined as the ratio of the sum of squares explained by a regression model and the ”total“ sum of squares around the mean. This is the measure of how different each group is in each step of the algorithm and refers to the proportion of the variance explained in each step (Johnson and Wichern, 2002).
2. Second stage- Elicitation
When considering multi-criteria decision aiding, as we wish to do in next stage, we also incorporate in the models parameters related to the preferences of the DM. Eliciting parameter values about preferences is therefore necessary to transform the DM value judgments, sometimes expressed through words, in numbers. In this work, the application of an outranking method in next stage requires the DM to specify several parameters, such as indifference, preference and veto thresholds, criteria weights and the cut-off threshold. The role of each of these parameters is described below.
3. Third stage- Ordinal Sorting
On the third stage, to rank categories, we present two possibilities:
(A) ranking the centroids of categories, similarly to what was proposed by Nemery (2008), but without requiring central profiles defined in advance;
(B) establishing the preference relation between all alternatives in all categories, similarly to what was proposed by De Smet and Montano (2004) for ordered clustering.
In both cases, the relations of Preference, Indifference and Incomparability will be expressed by the outranking relation. A valued outranking relation is used by methods such as ELECTRE III (Roy, 1978) and ELECTRE TRI (Yu, 1992, Roy and Bouyssou, 1993) when comparing alternatives. Given any ordered pair (ai, aj)∈ A2, one may compute a credibility degree S(ai, aj) indicating the degree to which ai outranksaj. This degree may then be compared with a cutting level λ, to decide whether the outranking holds or not:
ai outranks aj (denoted aiSaj) ⇔S(ai, aj)≥ λ
In ELECTRE, the word outranking means “is at least as good as”, or “is not worse than”. When comparing S(ai, aj),S(aj, ai), and λ, four situations may occur:
• aiSaj and ¬(ajSai)⇔aiP aj (ai is preferable to aj)
• ¬(aiSaj) and ajSai ⇔ajP ai (aj is preferable toai)
• aiSaj and ajSai ⇔aiIaj (ai is indifferent to aj)
• ¬(aiSaj) and ¬(ajSai)⇔aiRaj (ai is incomparable toaj)
The following paragraphs briefly remind the computation of a credibility degree S(ai, aj) for a given ordered pair (ai, aj) ∈ A2. For justifications and more details see (Mousseau and Dias, 2004; Roy, 1993).
Computation of single-criterion concordance indices. The single-criterion concordance index
ai outranks aj. This index is computed taking into account the difference of performances on the criterion considered, as well as two thresholds: indifference qt and preference pt (0≤qt ≤pt):
ct(ai, aj) = 0 if gt(aj)−gt(ai)≥pt pt−gt(aj)+gt(ai) pt−qt if qt < gt(aj)−gt(ai)< pt 1 if gt(aj)−gt(ai)≤qt (3)
Computation of the global concordance index. A global concordance index c(ai, aj) is com-puted by aggregating the n single-criterion concordance indices obtained before. It represents the level of majority among the criteria in favor of the conclusion that ai outranksaj. The computation
c(ai, aj) takes into account a vector of criteria weights. Each of these weightsαt(t = 1, ..., n) can be interpreted as the voting power of the respective criterion. c(a, b) can be written as follows:
c(ai, aj)= n ∑ t=1 αtct(ai, aj) n ∑ t=1 αt
Usually, the weights are normalized such that ∑nt=1αt= 1, therefore allowing to write:
c(ai, aj) = n
∑
t=1
αt.ct(ai, aj) (4)
Computation of single-criterion discordance indices. The single-criterion discordance index
dt(ai, aj) indicates the degree to which the t-th criterion (t = 1, ..., n) disagrees with the conclusion thatai outranksaj. This index is computed taking into account the difference of performances on the criterion considered, as well as two thresholds: discordance ut and veto vt (pt≤ut ≤vt) (Mousseau and Dias, 2004): dt(ai, aj) = 1 if gt(aj)−gt(ai)≥vt gt(aj)−gt(ai)−ut vt−ut if ut< gt(aj)−gt(ai)< vt 0 if gt(aj)−gt(ai)≤ut (5)
Computation of the credibility degree. The computed global concordance index and single-criterion discordance indices are aggregated into a credibility degree S(ai, aj) indicating the degree to which ai outranks aj. Originally, (Roy, 1978) proposed the following expression:
S(ai, aj) = c(ai, aj). ∏ t∈{1,...,n}: dt(ai,aj)>ct(ai,aj) 1−dt(ai, aj) 1−c(ai, aj) .
Two simpler variants have been proposed afterwards. The paper that introduced the possibility of using a discordance threshold ut different than the preference threshold pt (Mousseau and Dias,
S(ai, aj) = c(ai, aj).
∏
t∈{1,...,n}
[1-dt(ai, aj)], or alternatively,
S(ai, aj)=c(ai, aj)[1-dmax(ai, aj)], with dmax(ai, aj) = max
t∈{1,...,n} dt(ai, aj). In the remainder of this paper we will consider that this latter variant has been chosen.
(A) Ranking the centroids of categories
The centroidsϱi and ϱj of the categories Ci and Cj respectively, are compared pair by pair. For each ordered pair of centroids (ϱi,ϱj), the method decides if the first one outranks the second one (ϱi S ϱj) or not. The preference structure of the partition is defined through the centroid relations
{P, I, R}, and we can obtain the following situations:
Ci ≻Cj if ϱ iP ϱj Ci =Cj if ϱ iIϱj Ci ⊥Cj if ϱ iRϱj (6)
Thus, a categoryCi is preferred to Cj (Ci ≻Cj) if the centroid ϱ
i of categoryCi is preferred to centroid ϱj of category Cj, they are indifferent (Ci =Cj) if their centroids are indifferent and they are incomparable (Ci ⊥Cj) if their centroids are incomparable.
(B) The most common preference relation between alternatives in the categories
The key idea for a second proposal to build the preference structure is to evaluate the most common preference relation between the alternatives in the categories, based on the ELECTRE-type outranking relation. That can be characterized by the concept of θij defined below (definition 3.1).
Definition 3.1. Let Ci, Cj ∈ P. The profile θ
ij of (Ci,Cj) ∈ P2 is defined as being a 4-uple (|Pij|,|Pji|,|Rij|,|Iij|) where:
• Pij ={(as, at)∈(Ci, Cj) :asP at}
• Rji ={(as, at)∈(Ci, Cj) :asRat}
• Iij ={(as, at)∈(Ci, Cj) :asIat}
Thus, the preference structure of final partition is defined as follows:
Ct ≻Cr if max θ ij =|Pij| Cr ≻Ct if max θ ij =|Pji| Ct =Cr if max θ ij =|Iij| Ct ⊥Cr if max θ ij =|Rij| (7)
In the (uncommon) event of ties for obtaining the maximum element of θij, more than one possibility can be kept for future analysis. The final choice will depend on the Quality of the possible solutions (presented in Fourth stage).
If the relation ≻ contains a cycle (e.g.,Ci ≻Cj, Cj ≻Ct and Ct≻Ci), then the final partition obtained is not an order nor a weak form of an order (weak order or partial pre-order). When this happens, one can remove the least credible preference (e.g., according to the credibility degrees), similarly to the ELECTRE IS method (Roy and Bouyssou, 1993). On the other hand, in case there exist indifferent categories, one can either merge those categories or transform the indifference relation in a preference relation by choosing the direction of the largest value of the credibility degrees.
4. Fourth stage - Consistency checking
In this work, to evaluate the Quality of ”Ci ≻Cj ”, we propose ther
ij index given by (8), which indicates the probability that ”Ci ≻ Cj ” is not contested, i.e., the complement of the probability of finding an inconsistency due to Preferences inversions, when a pair of alternatives (one from each category) is chosen randomly.
Definition 3.2. Let Ci, Cj ∈P :Ci ≻Cj .The probability of preference consistency for a randomly
audited pair of alternatives is defined as follows:
rij = 1−P rob(alP am |al∈Cj ∧am ∈Ci) (8)
4
Illustrative Example
We will now revisit an example from Yu (1992), referring to the evaluation of 100 alternatives to be sorted, based on their performances on 7 criteria to be minimized. Yu used ELECTRE TRI to sort the alternatives into predefined ordered categories. We will now show that a clustering-sorting approach can suggest an alternative structure of categories displaying incompatibilities.
1.First stage - Clustering
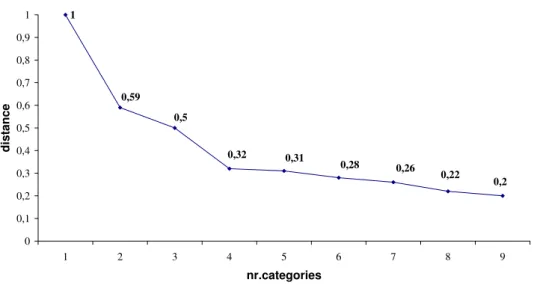
For classifying the alternatives by Clustering - Sorting, on a first stage the alternatives will be grouped using the K-Means method. A distance graphic (obtained with Complete Linkage) can inform the decision about the number of clusters to consider (Figure 2).
As depicted in Figure 2, we should keep at least 4 clusters, since the slope of the line of the distance between clusters is relatively steep until that number. In the continuation we consider k=4. The K-Means algorithm yields four homogeneous groups - C1, C2, C3 and C4 - with 17, 63, 16 and
4 alternatives respectively:
1 0,2 0,22 0,26 0,28 0,31 0,32 0,5 0,59 0 0,1 0,2 0,3 0,4 0,5 0,6 0,7 0,8 0,9 1 1 2 3 4 5 6 7 8 9 nr.categories d is ta n c e
Figure 2: Distance between clusters.
• C2 ={a 1, a2, a3, a4, a6, a7, a8, a9, a10, a11, a12, a13, a14, a15, a16, a17, a26, a27, a28, a29, a30, a31, a32, a33, a34, a35, a36, a37, a38, a39, a40, a41, a42, a43, a44, a45, a46, a47, a48, a49, a51, a52, a53, a54, a55, a56, a57, a58, a59, a60, a61, a62, a63, a66, a67, a68, a69, a70, a71, a76, a78, a79, a83} • C3 ={a90, a91, a77, a80, a84, a85, a88, a92, a93, a94, a95, a96, a97, a98, a99, a100} • C4 ={a 5, a21, a18, a19}.
2. Second stage- Elicitation
On the second stage, we will use the original values (Yu, 1992) for the weights, indifference, preference, discordance, veto thresholds associated with each criterion, indicated in Table 1, and for the threshold cut-off λ (0.86).
g1 g2 g3 g4 g5 g6 g7
qj 0.65 1.7 1.7 1.7 1.7 1.7 2.3
pj 1.31 3.45 3.45 3.45 3.45 3.45 4.7
vj 1.95 10.4 10.4 10.4 10.4 10.5 18.7
kj 0.24 0.12 0.12 0.12 0.12 0.12 0.16
Table 1: Thresholds and weights associated with the criteria.
3. Third stage- Ordinal Sorting
On the third stage, for each of the obtained groups, we computed its centroid, and then ranked the resulting centroids (ϱ1, ϱ2, ϱ3 and ϱ4 ) based on the outranking relation in Table 2, originating
a structure of partially ordered categories (Figure 3). Thus, the final structure obtained is: C3 ≻ C2 ≻C4, C3 ≻C1 (C1 ⊥C4). centroid ϱ1 ϱ2 ϱ3 ϱ4 ϱ1 1.0 0.0 0.0 0.0 ϱ2 0.0 1.0 0.0 1.0 ϱ3 1.0 0.9575 1.0 1.0 ϱ4 0 0.0 0.0 1.0
Table 2: Credibility degree between centroids.
C3 ! ! B B B B B B B B C2 C1 C4
Figure 3: Final partition with (A)
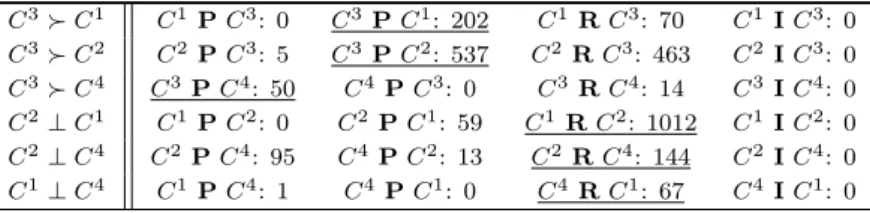
Defining the structure of preferences between categories through the most common preference relations between alternatives, we obtain the results in Table 3. The resulting relation between C1
and C4 is not the same as the one given in Table 2, as no longer C2 ≻C4 (see Figure 4). C3≻C1 C1 PC3: 0 C3PC1: 202 C1RC3: 70 C1IC3: 0 C3≻C2 C2 PC3: 5 C3PC2: 537 C2RC3: 463 C2IC3: 0 C3≻C4 C3 PC4: 50 C4PC3: 0 C3RC4: 14 C3IC4: 0 C2⊥C1 C1 PC2: 0 C2PC1: 59 C1 RC2: 1012 C1IC2: 0 C2⊥C4 C2 PC4: 95 C4PC2: 13 C2RC4: 144 C2IC4: 0 C1⊥C4 C1 PC4: 1 C4PC1: 0 C4RC1: 67 C4IC1: 0
Table 3: Number of pairs of alternatives for each preference relation.
C3 } }|||||| || ! ! B B B B B B B B C1 C2 C4
Figure 4: Final partition with (B)
4. Fourth stage - Consistency checking
After obtaining the partitions with (A) and (B) we analyzed the inconsistencies due to Preference inversions. The results are presented on Table 4 and Table 5. Defining the structure with (A), there are no inconsistencies between C1 and C3, and C3 and C4. The worst case occurs between C2 and
C4 (r24=99.74%) where there are 13 pairs of alternatives that display Preference inversion.
Defining the structure with (B), there are no more preference inversions concerning C2 and C4, which are now considered to be incomparable, but still having inconsistencies between C2 and C3
r31 r32 r34 r24
100% 99.9% 100% 99.74%
Table 4: Quality indices with (A). r31 r32 r34
100% 99.9% 100%
Table 5: Quality indices with (B).
Faced with two different structures, the DM can choose the structure with better Quality, i.e., the final structure with C2 ⊥C4 (Figure 4). However, since the Quality of the structure in Figure 3 is also very high we could also consider it, asking the DM to judge which one made most sense.
5
Application: Evaluating types and strategic management
of intragroup conflicts
5.1
Problem description
Conflict is present in interpersonal relations (Pruitt and Carnevale, 1993), in intragroup and inter-group relations (Jehn, 1995), in strategic decision-making (Amason, 1996), and other organizational episodes. As many authors, Jehn (1995) distinguishes two kinds of intragroup conflict: task conflict and relationship conflict. Task conflict is a perception of disagreement among group members about the content of their decisions, and involves differences in viewpoints, ideas and opinions (e.g., conflicts about the distribution of resources, about procedures or guidelines, and about the interpretation of facts). Relationship conflict is a perception of interpersonal incompatibility, and includes annoyance and animosity among individuals (e.g., disagreements about values, personal or family norms, or about personal taste).
At the intragroup level, conflict management strategies describe the responses of team members to conflict situations (DeChurch and Marks, 2001). To an intragroup level, they are expressed by a set of answers given by the members of a group with the purpose of reducing or solving conflict (De Church and Marks, 2001). Rahim and Bonoma (1979) conceptualized the conflict management strategies in two dimensions: concern for self (the degree to which the individual seeks to meet his objectives), and concern for others (the degree to which the individual seeks to meet the objectives of others). These authors distinguish five styles of handling interpersonal conflict that emerge from various combinations of these two dimensions - concern for self and concern for others: avoidance
(low concern for self and low concern for others), domain (high concern for self and low concern for others), accommodation (low concern for self and high concern for others), integration (high concern for both self and others) and compromise (midpoint of both the others-oriented and self-oriented dimensions).
Avoidance is also known as suppression. It may take the form of postponing a situation until a better time, or simply ignoring the problem. Accommodation is associated with an attempt to ignore the differences and to emphasize commonalities to satisfy other party’s concern. The domain
strategy of conflict handling is viewed as a win-lose struggle - if one wins, the other has to lose (Rahim, 1992). The adoption of this type of conflict response easily locks parties into an escalation of conflict. Compromise involves give-and-take, that is, both parties give up something to find a mutually acceptable solution. Finally, integration involves exchange of information and examination of differences to reach a mutual beneficial solution.
5.2
Clustering-Sorting application
We analyzed a sample from Dimas (2007) of 77 workgroups from 14 companies represented by a vector of evaluations on 6 criteria (Table 6): two criteria assess intragroup conflicts (Task (g1) and Relationship (g2)), which evaluates the tension generated by them (1 = no tension; 7 =
much tension), and four criteria assess conflict management strategies (Integration (g3), Domain
(g4), Accommodation (g5), and Avoidance (g6)), which evaluates how often they happen (1 = never
happen; 7 = always happen). Dimas (2007) had the aim of analyzing the five styles of conflict handling. However, the results of the psychometric studies conducted for the scale used to measure these dimensions (ROCI-II developed by Rahim (1983)), revealed that compromise had low levels of internal consistency, which did not allow the analysis of this dimension.
We now wish to compare workgroups: a workgroup can be higher or lower ranked in comparison with some workgroups, whereas it can be considered incomparable with other workgroups, in what concerns the incidence of conflicts as well as the form this workgroup manages such conflicts.
1.First stage - Clustering
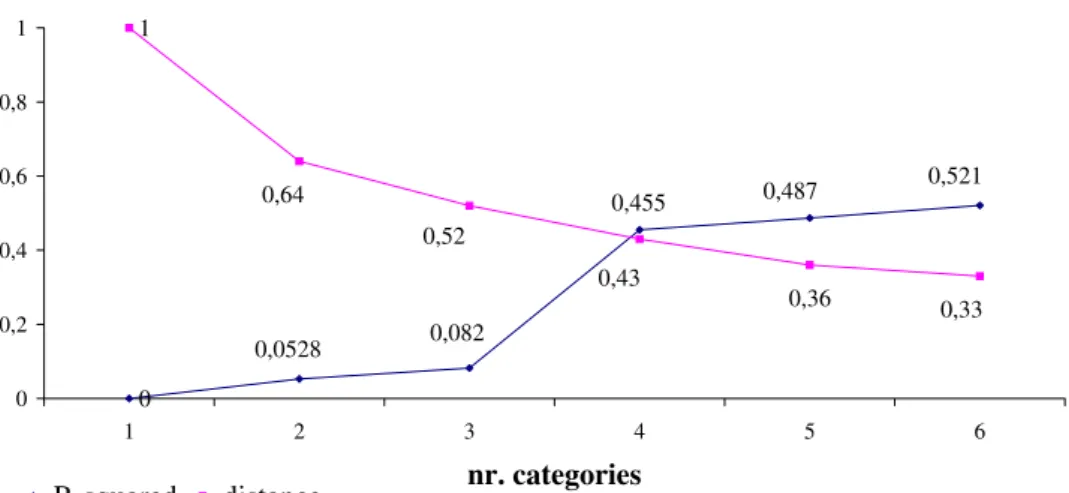
On the first stage the performances of the alternatives have been standardized since we will use the K-Means method based on a Euclidean distance. The number of clusters (unknown a priori) was set using the Complete Linkage hierarchical method and the application of the distance criterion (square of Euclidean distance) between categories and R-squared (Figure 5).
In figure 5 we observe that a possible solution consists in considering at least two categories, because the decrease in the distance between categories is not as steep afterwards. Complementing this analysis with the information of the R-squared, it appears that the variability of earnings retained for more than 4 categories is relatively small compared with the evolution of 1 to 3. So, a good solution is 4 categories: C4 containing 4 alternatives (workgroups), C3 containing 22 alternatives,
C2 containing 25 alternatives, and C1 containing 26 alternatives.
• C1 ={a 3, a5, a12, a15, a20, a25, a27, a28, a32, a36, a37, a39, a40, a41, a43, a44, a46, a48, a58, a59, a61, a63, a66, a69, a76, a77} • C2 ={a 6, a13, a14, a16, a17, a18, a19, a21, a22, a24, a30, a31, a33, a34, a35, a42, a45, a50, a52, a65, a67, a68, a70, a71, a72} • C3 ={a 1, a2, a7, a8, a11, a23, a26, a29, a38, a49, a51, a53, a54, a55, a56, a57, a60, a62, a64, a73, a74, a75} • C4 ={a , a , a , a }.
g1 g2 g3 g4 g5 g6 g1 g2 g3 g4 g5 g6 a1 3.4 3.19 5.19 2.88 3.69 5.0 a40 2.7 2.2 4.875 2.25 3.125 3.277 a2 2.86 2.33 4.33 3.42 3.66 4.33 a41 2.4 1.687 6.189 2.31 4.125 2.833 a3 2.3 2.5 5.25 2.75 3.75 3.5 a42 2.1 2.625 5.0 2.25 3.5 3.5 a4 3.68 3.2 5.25 3.5 3.95 3.4 a43 2.24 2.5 6.15 1.9 3.4 3.8 a5 2.88 2.15 4.85 3.0 4.15 4.266 a44 1.6 2.0 6.125 1.5 2.5 4.5 a6 3.2 2.667 5.5 2.33 2.92 3.77 a45 2.2 3.625 6.875 2.125 3.5 4.33 a7 3.5 2.75 4.875 3.375 3.5 3.33 a46 2.2 2.5 5.125 1.5 2.375 2.0 a8 3.2 2.78 5.66 2.91 3.28 3.46 a47 2.7 2.125 5.75 2.625 2.75 3.58 a9 2.8 3.0 5.33 3.25 4.08 4.77 a48 3.3 2.0 4.375 1.625 3.25 3.667 a10 2.2 2.375 5.25 2.875 2.875 4.5 a49 1.8 2.375 6.25 2.0 2.75 4.166 a11 2.4 3.625 5.63 2.625 5.0 4.5 a50 1.93 2.08 6.25 2.08 3.0 3.888 a12 2.93 2.86 5.125 3.07 3.75 3.79 a51 2.2 2.0 6.75 1.375 1.875 3.5 a13 3.266 3.166 4.75 3.08 3.25 3.22 a52 3.8 3.75 4.13 4.0 4.13 4.83 a14 2.52 2.85 5.25 2.95 4.2 4.266 a53 3.6 3.5 3.125 3.0 4.37 4.166 a15 3.2 2.625 6.125 2.875 2.25 4.5 a54 3.53 3.166 4.75 3.58 4.08 4.22 a16 2.8 1.87 5.375 3.625 3.125 3.33 a55 4.0 3.375 3.75 3.625 3.25 4.0 a17 3.1 3.44 6.0 3.125 3.125 3.166 a56 3.3 3.875 3.125 4.0 3.88 4.166 a18 3.13 3.08 5.667 2.25 3.75 4.333 a57 3.13 3.58 4.0 3.83 3.666 4.55 a19 3.0 2.125 6.5 2.75 3.63 6.0 a58 3.33 3.0 4.416 3.58 4.08 4.22 a20 3.54 2.96 5.535 2.928 3.785 3.52 a59 3.6 2.5 4.25 3.5 3.94 4.416 a21 3.32 2.65 5.3 2.95 3.15 4.4 a60 2.8 3.13 4.0 3.63 3.63 4.166 a22 3.275 2.06 5.875 2.56 3.656 3.54 a61 4.8 3.92 3.08 3.83 3.42 4.11 a23 3.1 2.75 5.25 3.25 4.0 5.33 a62 3.2 4.0 5.0 3.75 3.25 4.22 a24 3.8 3.0 6.0 2.75 4.125 4.0 a63 3.44 3.25 4.35 4.0 3.6 3.73 a25 2.775 3.03 5.06 2.63 3.53 3.79 a64 3.488 2.527 3.92 3.055 4.14 5.22 a26 2.98 3.045 4.52 3.11 3.43 3.697 a65 3.666 4.08 3.75 3.666 3.58 4.0 a27 1.8 1.625 5.75 1.5 3.25 4.5 a66 3.48 3.29 4.73 3.71 3.85 4.25 a28 2.3 2.125 6.0 1.5 2.75 3.0 a67 4.2 3.89 4.57 3.928 3.57 4.24 a29 2.3 2.5 4.625 2.0 2.875 3.166 a68 3.58 2.84 4.5 3.45 3.43 3.845 a30 2.6 3.125 6.0 1.75 2.0 3.0 a69 3.45 3.75 4.81 3.56 3.44 4.17 a31 2.93 2.33 5.5 1.83 2.33 3.33 a70 3.8 2.75 5.125 4.875 3.75 4.33 a32 1.65 1.375 6.25 1.69 3.5 4.42 a71 3.49 2.977 4.636 3.159 3.59 3.939 a33 2.8 2.75 5.58 1.83 3.58 3.666 a72 3.65 3.08 4.9167 3.81 3.65 3.888 a34 2.34 2.25 5.357 2.0 3.5 3.76 a73 3.91 3.68 4.46 3.21 3.11 3.71 a35 1.466 1.416 5.58 1.92 3.0 4.11 a74 2.5 3.5 3.0 1.63 1.88 2.0 a36 2.53 2.75 5.83 1.916 3.5 3.555 a75 3.4 4.06 4.19 1.63 3.06 4.0 a37 1.8 1.75 5.25 2.75 3.0 3.33 a76 3.7 3.63 4.625 2.63 3.63 3.0 a38 3.0 2.06 5.375 1.25 3.0 2.916 a77 3.75 3.31 4.125 2.5 3.187 3.0 a39 2.45 2.0 5.44 1.875 3.187 3.0
Table 6: Evaluations on six criteria for 77 workgroups.
0 1 0,521 0,487 0,0528 0,082 0,455 0,64 0,52 0,33 0,36 0,43 0 0,2 0,4 0,6 0,8 1 1 2 3 4 5 6 nr. categories R-squared distance
Figure 5: Distance criterion and R-squared
C4 respectively). The category C2 reflects a group context characterized by a very small presence
of relationship and task conflicts. The category C1, reflects a group context characterized by the
presence of conflicts but not frequently occurring. Other groups reflect a context group characterized by an increase in conflicts (Figure 6). As shown in Figure 7, the integrative strategies are the most used by the groups analyzed to manage these conflicts, particularly by groups in C1 and C2. The
domain strategies are the least used, but groups in C3 use it more often than other groups.
Figure 6: Mean scores of intragroup conflict
0 1 2 3 4 5 6 7 Integration Domain Accommodation Avoidance c1 c2 c3 c4
According to Dimas (2007), conflicts threaten group results, hence, conflicts should be minimized. Dimas (2007) also found that the use of strategies for managing conflicts of integrative nature has resulted in increased group efficacy. Therefore we consider that the criterion assessing the integrative strategy will be the only one to be maximized. For the DM (a specialist in conflict management), all criteria are considered to have the same weight, i.e, kj=1/6, j=1,...,6. As for the threshold values of the criteria, for the purpose of this study, the DM agreed to the values given in Table 7, and for the threshold cut-off λ chose the value 0.6.
g1 g2 g3 g4 g5 g6
qj 0.25 0.25 0.25 0.25 0.25 0.25
pj 0.75 0.75 0.75 0.75 0.75 0.75
vj 2 2 2 2 2 2
Table 7: Indifference, preference and veto thresholds.
3. Third stage- Ordinal Sorting
We ranked the centroids obtained on the first stage based on the outranking relation depicted in Table 8, which results from applying ELECTRE with the parameters that were chosen. Since
λ=0.6 we have ϱ1P ϱ3, ϱ2P ϱ1, ϱ2P ϱ3, ϱ2P ϱ4 and ϱ4P ϱ3. Thus the final structure obtained was a
partial order (Figure 8), stating C2 is the most preferred category, followed byC1 and C4 (which are incomparable), and lastly by C3.
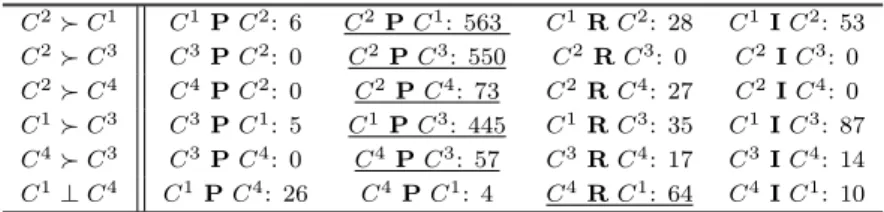
Applying the most common preference relation between alternatives in the categories (Table 9) we obtained the same final structure.
centroid ϱ1 ϱ2 ϱ3 ϱ4 ϱ1 - 0.3483 1.0000 0.5314
ϱ2 1.0000 - 1.0000 0.8994
ϱ3 0.4523 0.0590 - 0.3417
ϱ4 0.4084 0.2360 0.9915
-Table 8: Credibility degree.
C2 ! ! B B B B B B B B C4 C1 } }|||||| || C3
Figure 8: Final partition
These results are in agreement with the literature about conflict management in groups. In fact,
C2 can be designated as the functional category since this category integrates the groups with less
C2≻C1 C1 PC2: 6 C2PC1: 563 C1RC2: 28 C1 IC2: 53 C2≻C3 C3 PC2: 0 C2PC3: 550 C2RC3: 0 C2 IC3: 0 C2≻C4 C4 PC2: 0 C2PC4: 73 C2RC4: 27 C2 IC4: 0 C1≻C3 C3 PC1: 5 C1PC3: 445 C1RC3: 35 C1 IC3: 87 C4≻C3 C3 PC4: 0 C4PC3: 57 C3RC4: 17 C3 IC4: 14 C1⊥C4 C1 PC4: 26 C4 PC1: 4 C4RC1: 64 C4 IC1: 10
Table 9: Number of pairs of alternatives for each preference relation.
and that relationship conflict is dysfunctional, the results of almost all studies developed in this area found negative effects of both types of conflict on the team outcomes. Indeed, in a meta-analysis on team conflict literature, with thirty studies published between 1994 and 2001, De Dreu and Weingart (2003) found that both task and relationship conflict are equally disruptive to team performance and team satisfaction. At the same time, C2 is also the category more effective in terms of the strategies
of handling intragroup conflict. In fact, groups in this category use integrating more often than the ones of the others categories, whereas dominating is the style less used.
Findings from prior research have shown positive associations between the use of integrating and the team effectiveness levels (Kuhn and Poole, 2000) and negative relations between the use of dominating and team results (Friedman, Tidd, Currall and Tsai, 2000; Pneuman and Bruehl, 1982). With respect to the nonconfrontational approaches to conflict avoidance and accommodation -despite few studies have been conducted in this area, there is some evidence supporting its negative effects on team results (DeChurch and Marks, 2001). Both strategies are little used by the groups of categoryC2 . WhileC2 is the functional category,C3 is the dysfunctional one. In fact, groups in this
category have more conflicts than groups inC1 andC2. Collaboration with others and trying to work
out a mutually acceptable solution is an approach less used in this category than in categoryC2 and
even C1. At the same time, the less appropriate strategies of handling conflict are used frequently
by the groups of this category in relation to the groups of the other categories. Finally, categories C1
and C4 are both worse in terms of functionality than category C2 because conflict is more frequent,
integrating is less frequent, and ineffective strategies of handling conflicts are more used than C1. At
the same time, both categories are overall better than C3 but incomparable. Indeed, the groups of
category C1 have less conflicts and integrate more than C3 and C4; groups of category C4 despite
having also relatively high level of conflicts compared with C2 and C1 groups but use domain, use
avoidance and use accommodation less than groups in category C3 and C1.
4. Fourth stage - Consistency checking
After obtaining this final partition we analyzed the inconsistencies due to Preference inversions. The results are presented on Table 10. There are no inconsistencies between C2 andC3, C2 and C4,
C4 and C3. The worst case occurs between C2 and C1(r21 = 99,79%) where there are 11 pairs of
alternatives that display Preference inversion.
r21 r23 r24 r13 r43
99.79% 100% 100% 99.83% 100%
6
Conclusions
In this work we proposed an approach for the clustering of a set A of alternatives, based on multiple criteria, to a set of partially ordered categories with an unknown structure a priori. On a first stage, similar alternatives are assigned to homogeneous categories, using the traditional K-Means method. Afterwards categories are ranked based on their centroids or on the most common preference relation between alternatives in the categories, using an ordinal ranking method, such as ELECTRE, based on the preferences of the DM elicited at this stage. Concerning the K-Means clustering method, we used the Distance between Clusters indicator and R-squared index to know what valuek should take, i.e., the number of categories to form. After obtaining a partition of the set of alternatives based on one of the proposed approaches, one can analyze its quality: we propose the
rij index, which indicates the probability that ”Ci ≻Cj” is not contested when a pair of alternatives (one from each category) is chosen randomly.
The motivation that led us to test this approach on a real-world data set of 77 workgroups evaluated by types of intragroup conflicts and management conflicts was the few studies that apply cluster analysis to group processes. Through clustering it is possible to obtain sets of group features and, consequently, understand how variables are associated with each other. Moreover, this strategy of analysis allows us to increase our understanding of the groups, by identifying not only what they have in common but also what sets them apart.
It was possible to devise that the groups tended to cluster around 4 categories. The final structure obtained for these categories was a partial order: the best category, a worst one and two incomparable categories. The results are in agreement with these found in the literature (De Dreu et al., 2004; Kuhn and Poole, 2000,Friedman, Tidd, Currall and Tsai, 2000; Pneuman and Bruehl, 1982,DeChurch and Marks, 2001): the best category integrates the groups with less conflicts and is also the category more effective in terms of the strategies of handling intragroup conflict. In fact, groups in this category use integrating more often than the ones of the others categories, whereas dominating is the style less used. The avoidance and accommodation strategies are little used by the groups of this category. The worst category is the dysfunctional category.
In fact, groups in this category have more conflicts than groups in the better category; being dominating the style of managing conflicts more used in relation to the groups of the other categories; to collaborate with others and try to work out a mutually acceptable solution is an approach less used in this category than in the best category. Finally, incomparable categories are both worse in terms of functionality than the best category because conflicts are more frequent.
The analysis of to Preference inversions shows that only 11 out of 2926 pairs of alternatives (0.4%) are inconsistent with the relations between categories, which is quite acceptable. However, this clustering-sorting approach does not guarantee an “optimal” partition minimizing the inconsistencies due to Preferences inversions. The development of sophisticated optimization approaches using mathematical programming to match the preferences of a decision maker is an important topic for future research. This requires formulating a mathematic program having 0-1 decision variables to represent the possible assignments of alternatives to categories and, among other. Such a problem is likely to require metaheuristic approaches for large datasets.
References
[1] Amason AC. 1996. Distinguishing the effects of functional and dysfunctional conflict on strategic decision making: resolving a paradox for top management teams. Academy of Management Journal, 39, 123-148.
[2] Belton,V., Stewart,T. 2002. Multiple Criteria Decision Analysis: An Integrated Approach. Dor-drecht: Kluwer Academic Publishers.
[3] Bouyssou,D., Marchant,T., Pirlot,M., Perny,P., Tsouki`as,A., Vincke,P. 2000. Evaluation and decision models: A critical perspective. Dordrecht: Kluwer Academic Publishers.
[4] Cailloux, O., Lamboray, Cl. and Nemery, Ph. 2007. A taxonomy of clustering procedures. Pro-ceedings of the 66th Meeting of the EWG on MCDA, Marrakech, Maroc.
[5] De Smet, Y., Montano, G.L. 2004. Towards multicriteria clustering: an extension of the k-means algorithm. European Journal of Operational Research 158(2) : 390-398
[6] DeChurch, L.A., Marks M.A. 2001. Maximizing the benefits of task conflict: the role of conflict management. Journal of Conflict Management, 12(1), 4-22.
[7] De Dreu C. K. W. & Weingert, L. R. 2003. A contingency theory of task conflict and perfor-mance in groups and organizational teams. In M. A. West, D. Tjosvold & K. G. Smith (Eds.), International Handbook of Organizational Teamwork and Cooperative Working (pp. 150-166). Chichester: John Wiley & Sons, ltd.
[8] Deutsch M. 1973. The resolution of conflict. New Haven, CT: Yale University Press.
[9] Dimas, I.C.D. 2007. (Re)pensar o conflito intragrupal : n´ıveis de desenvolvimento e efic´acia, Faculdade de Psicologia e Ciˆencias da Educa¸c˜ao da Universidade de Coimbra,PhD dissertation in Portuguese.
[10] Doumpos M., Zopounidis C. 2002, Multicriteria Decision Aid Classification Methods, Kluwer Academic Publishers, Dordrecht.
[11] Fernandez E., Navarro J., Bernal S. 2010. Handling multicriteria preferences in cluster analysis. European Journal of Operational Research 202 : 819-827.
[12] Figueira, J., De Smet, Y., Brans, JP. 2004. Promethee for MCDA Classification and Sorting problems: Promethee TRI and Promethee CLUSTER. Submitted for publication.
[13] Friedman R.A., Tidd S.T., Currall S.C., Tsai J.C. 2000. What goes around comes around: the impact of personal conflict style on work conflict and stress. International Journal of Conflict Management, 11, 32-55.
[15] Hartigan J., Wong, M. 1979. Algorithm AS136: A k-means clustering algorithm. Applied Statis-tics, 28, 100-108.
[16] Hurson Ch., Zopounidis C. 1997. On the use of multicriteria decision aid methods to portfolio selection, in Cl´ımaco, J.(ed), Multi-Criteria Analysis, Springer, 496-507.
[17] Jain A.K., Dubes R.C. 1999. Algorithms for Clustering Data. Prentice-Hall advanced reference series. Prentice-Hall,Inc., Upper Saddle River, NJ.
[18] Jehn K.A. 1995. A multimethod examination of the benefits and detriments of intragroup con-flict, Administrative Science Quarterly, 40, 256-282.
[19] Kuhn T., Poole M.S 2000. Do conflict management styles affect group decision making? Evidence from a longitudinal study. Human Communication Research, 26 (4), 558-590.
[20] Johnson R.A., Wichern D.W. 2002. Applied multivariate statistical analysis. Prentice Hall, New Jersey, 5th edition.
[21] Mousseau V., Dias L. 2004. Valued outranking relations in ELECTRE providing manageable disaggregation procedures.European Journal of Operational Research,156(2),467-482.
[22] Munduate L., Ganaza J., Peir´o J.M., Euwema M. 1999. Patterns of styles in conflict management and effectiveness. International Journal of Conflict Management, 10(1), 5-20.
[23] Murtagh, F. 1985. Multidimensional Clustering Algorithms. Physica-Verlag, Vienna.
[24] Nemery Ph. 2008. An outranking-based sorting method for partially ordered categories, DI-MACS, Workshop and Meeting of the COST Action ICO602, Paris, Universit´e Paris Dauphine, 28-31 October.
[25] Nemery Ph., A multicriteria sorting method for partially ordered categories, Proceedings of the doctoral work shop of EUROMOT 2008 - The Third European Conference on Management of Technology, ”Industry-University Collaborations in Techno Parks”, Nice.
[26] Nemery P.,De Smet Y. 2005. Multicriteria Ordered Clustering. Technical Report TR/SMG/2005-003, SMG, Universit´e Libre de Bruxelles.
[27] Olson, C. 1995. Parallel algorithms for hierarchical clustering. Parallel Computing, 21, 1313-1325.
[28] Pavel B. 2006, A survey of clustering data mining techniques, in Grouping Multidimensional Data, Springer Berlin Heidelberg, pp. 25-71.
[29] Pneuman R.W., Bruehl M.E. 1982. Managing Conflict, Prentice-Hall,Englewood Cliffs,NJ. [30] Pruitt D.G., Carnevale PJ. 1993. Negotiation in social conflict, Pacific Groves,CA: Brooks/Cole.
[31] Pruitt D. G., Rubin J.Z. 1986. Social conflict: escalation, stalemate and settlement. New York: Random House.
[32] Rahim M.A., Bonoma T.V. 1979. Managing organizational conflict: a model for diagnosis and intervention. Psychological Reports, 44 (3), 1323-1344.
[33] Rahim, M. A. (1992). Managing conflict in organizations (2a ed.). New York: Praeger.
[34] Roy B. 1978. ELECTRE III: Un algorithme de classements fond´e sur une repr´esentation floue des pr´ef´erences de crit`eres multiples. Cahiers du CERO, 20(1):3-24.
[35] Roy B., Bouyssou D. 1993. Aide multicrit`ere `a la d´ecision : Methodes et cas. Economica, Paris. [36] Tannock, R. 1998. Attention Deficit Hyperactivity Disorder: Advances in cognitive,
neurobio-logical, and genetic research, Journal of the Child Psychology and Psychiatry, 39, 65-99. [37] Yu, W. 1992. Aide multicrit`ere `a la d`ecision dans le cadre de la probl´ematique du tri: concepts,