All Faculty
6-1-2017
ATria: a novel centrality algorithm applied to
biological networks
Trevor Cickovski
Bioinformatics Research Group (BioRG) & Biomolecular Sciences Institute,School of Computing & Information Sciences, Florida International University, [email protected]
Eli Peake
Eckerd CollegeVanessa Aguiar-Pulido
Bioinformatics Research Group (BioRG) & Biomolecular Sciences Institute,School of Computing & Information Sciences, Florida International University, [email protected]
Giri Narasimhan
Bioinformatics Research Group (BioRG) & Biomolecular Sciences Institute,School of Computing & Information Sciences, Florida International University, [email protected]
Follow this and additional works at:
https://digitalcommons.fiu.edu/all_faculty
This work is brought to you for free and open access by FIU Digital Commons. It has been accepted for inclusion in All Faculty by an authorized administrator of FIU Digital Commons. For more information, please [email protected].
Recommended Citation
Cickovski, Trevor; Peake, Eli; Aguiar-Pulido, Vanessa; and Narasimhan, Giri, "ATria: a novel centrality algorithm applied to biological networks" (2017).All Faculty. 221.
The Author(s) BMC Bioinformatics 2017, 18(Suppl 8):239 DOI 10.1186/s12859-017-1659-z
M E T H O D O L O G Y
Open Access
ATria: a novel centrality algorithm applied
to biological networks
Trevor Cickovski
1*, Eli Peake
2, Vanessa Aguiar-Pulido
1and Giri Narasimhan
1FromFifth IEEE International Conference on Computational Advances in Bio and Medical Sciences (ICCABS 2015) Miami, FL, USA. 15-17 October 2015
Abstract
Background: The notion ofcentralityis used to identify “important” nodes in social networks. Importance of nodes is not well-defined, and many different notions exist in the literature. The challenge of defining centrality in meaningful ways when network edges can be positively or negatively weighted has not been adequately addressed in the literature. Existing centrality algorithms also have a second shortcoming, i.e., the list of the most central nodes are often clustered in a specific region of the network and are not well represented across the network.
Methods: We address both by proposingAblatio Triadum(ATria), an iterative centrality algorithm that uses the concept of “payoffs” from economic theory.
Results: We compare our algorithm with other known centrality algorithms and demonstrate how ATria overcomes several of their shortcomings. We demonstrate the applicability of our algorithm to synthetic networks as well as biological networks including bacterial co-occurrence networks, sometimes referred to asmicrobial social networks.
Conclusions: We show evidence that ATria identifies three different kinds of “important” nodes in microbial social networks with different potential roles in the community.
Keywords: Centrality, Biological network, Microbial social network, Economic payoff
Background
The concept ofcentralityis foundational in social network theory and its underlying motivation is to find the most important or “critical” nodes in a large complex social net-work [1]. In this type of netnet-work, one may be interested in finding the most influential or the most popular individ-ual. A search engine may want to rank the hits resulting from a search, depending on how well linked it is in the network. In a terror network, an agency may be interested in finding the ringleader or the top leadership. Thus, “cen-trality” can have multiple meanings, and different metrics and methods are worth exploring.
With the advent of systems biology approaches, large-scale biological networks have become commonplace.
*Correspondence: [email protected]
1Bioinformatics Research Group (BioRG) & Biomolecular Sciences Institute,
School of Computing & Information Sciences, Florida International University, 11200 SW 8th St, Miami, FL 33196, USA
Full list of author information is available at the end of the article
Gene regulatory networks [2] model the interactions between genes, while protein-protein interaction (PPI) networks [3] represent the interaction of proteins. Micro-bialsocial networks [4–6] attempt to model the complex interactions between microbes within a microbial com-munity, such as those that inhabit the human gut or those that can be found in diseased coral.
It is well known that microbes in a community interact. These interactions may occur through the use of quorum sensing molecules, other signalling molecules, metabo-lites and/or toxins [7–9]. However, lacking the access to precise interaction information in sampled microbial communities, it has been suggested that bacterial co-occurrence networks inferred from metagenomic studies are a crude form of microbial social networks [4, 6]. A bacterial co-occurrence network [10] is an undirected, weighted network with nodes that represent bacterial taxa present in the community and edges that correspond to how strongly the two taxa tend to co-occur (i.e., co-infect)
© The Author(s). 2017Open AccessThis article is distributed under the terms of the Creative Commons Attribution 4.0 International License (http://creativecommons.org/licenses/by/4.0/), which permits unrestricted use, distribution, and reproduction in any medium, provided you give appropriate credit to the original author(s) and the source, provide a link to the Creative Commons license, and indicate if changes were made. The Creative Commons Public Domain Dedication waiver (http://creativecommons.org/publicdomain/zero/1.0/) applies to the data made available in this article, unless otherwise stated.
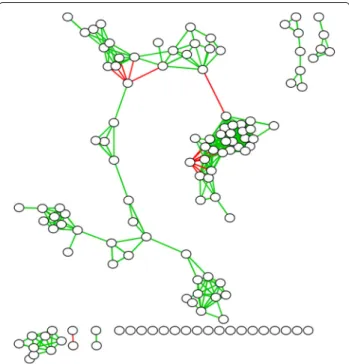
in the sampled communities. Edge weights can be posi-tive or negaposi-tive lying in the range [−1,+1]. We show an example of this in Fig. 1, using data from a lung micro-biome study. Green edges indicate positive correlations and red edges indicate negative ones, with edge thickness indicating strength of correlations. We visualize results using the Fruchterman-Reingold algorithm [11] within Cytoscape [12]. Even a cursory visual inspection of the network suggests the presence of dense subgraphs repre-senting strongly co-occurring groups of bacteria (referred to as clubs[6]). In co-occurence networks, strong green edges suggest the likelihood ofcooperation, while strong red edges suggestcompetition.
The following questions arise naturally in these investi-gations. Is it possible to identify bacterial taxa that drive or control the behavior of the community through their interactions? Can the first infectors or colonizers of the community be identified? What is the effect of disrupt-ing a node or edge of such a biological network? All the above questions highlight the importance of study-ing central nodes in biological networks [13]. We suggest three notions of centrality that are potentially impor-tant to biological networks, and especially to microbial social networks. The work in this paper addresses all three notions:
1. For each club (high density subgraph), we refer to a dominant node as aleader node [14], or an entity
Fig. 1Bacterial Co-Occurence Network. An example of a bacterial co-occurrence network obtained from a lung microbiome study. Nodes represent bacterial taxa. Green (resp. red) edges represent positively (resp. negatively) correlated co-occurrence patterns
responsible for connecting many individuals and driving the behavior of the club.
2. We define avillain node as one that has many strong negative edges to a club. Unity against a common enemy is a frequent theme in social networks [15]. 3. Nodes that connect two or more dense subgraphs
(clubs) are referred to asbridge nodes. In general social networks, this would correspond to someone who has the ability to link different social circles [15]. Centrality concepts [16, 17] can be classified into three categories: degree centrality, closeness centrality, and betweenness centrality. Degree centrality assumes that the most important nodes have high connectivity or degree. It is useful in identifying popular individuals in a social network.Closeness centrality interprets central-ity with respect to a distance metric, identifying nodes that are centrally located. This would be useful in iden-tifying where to place an important network resource (e.g., fire station or database server). Betweenness cen-trality defines a central node as one that lies on many shortest paths. Betweenness centrality would help iden-tify important junctions in a complex train or information flow network. Other approaches define an entity’s central-ity by the importance of its friends in the social network. Eigenvector-based approaches [16] for centrality extend the ideas of degree and closeness centrality by explicitly defining the centrality of a node in terms of the impor-tance of its neighbors. Google’sPageRankalgorithm [18] is an example of this approach. In this paper, we will pro-pose an algorithm that combines and generalizes these concepts.
Most of these approaches also generalize to weighted
social networks, where edge weights represent the strength of the relationship or influence between nodes. Distance-based methods like closeness and betweenness extend trivially. Degree can be generalized to weighted degree. The original version of PageRank assumes edge weights of 0 and 1, but subsequent attempts have been made to generalize the algorithm to weighted networks [19]. However, not many generalize readily to networks withnegativeedge weights, which is an important char-acteristic of real social networks because it helps distin-guish between “indifference” and “dislike”.PageTrust[20] extends PageRank to handle negative edges but, since all final centralities are positive, it becomes difficult to distin-guish a villain vs. a node with few friends as they both have low values. ThePN-Centralityalgorithm [21] of Everett and Borgatti fixes this problem but, as an eigenvector-based approach, tends to be biased toward nodes in highly dense subgraphs, thus distorting centrality information. Degree centrality has this same difficulty with cliques or dense subgraphs having many strong edges. Close-ness centrality tends to have a cluster of nodes with high
The Author(s) BMC Bioinformatics 2017, 18(Suppl 8):239 Page 11 of 49
centrality with values decreasing from there, biasing a particular area of the network. Betweenness centrality is better at identifying bridges but not leaders or villains.
In this work we present ATria, an iterative central-ity algorithm that addresses the shortcomings mentioned above and combines aspects of economic theory, social network theory, and path-based algorithms [22]. We investigate methods that avoid the above shortcomings by iteratively removing nodes with highest centrality along with some of the neighborhood edges before finding the node with the next highest centrality, using social network theory to determine the appropriate edges to remove. The goal of ATria is to find leaders, villains and bridges within a signed, weighted social network. We will verify that ATria is able to produce these results by testing a wide-range of networks including some simple synthetic examples, a scale-free network [23], and biological networks, such as gene expression, PPI, and microbial social networks.
Methods
Our proposed algorithm incorporates economic theory to reflect the fact that our interest in leader, villain and bridge nodes is based on their benefit (good or bad) to the net-work as a whole. Conjecturing possible interpretations, a leader node can be interpreted as a dominant mem-ber of a club, by being a major producer or consumer of some resource (e.g., a metabolite) that benefits other club members. A villain node may either represent a common enemy against which members of a club unite, or the pro-ducer of some byproduct (e.g., toxin) that is harmful to all members of a club. Bridge nodes may represent taxa that provide a beneficial (or harmful) resource to more than one club. Alternatively, they could be an important part of a cascade of events in a process.
Our starting point for an economic model is thePayoff Modelproposed by Jackson and Wolinsky [24], which ana-lyzes the efficiency and stability of an economic network where every node in the network provides somepayoff to every other node. They use this approach to determine nodes that receive the highestpay(meaning, the largest benefit from their connections), representing payoff for a nodeiin networkGwith uniform edge weights 0< δ <1 by the following: ui(G)=wii+ j=i δtijw ij− j:ij∈G cij (1)
In the above model,wiirepresents an amount of starting “capital” for nodei. They usewijto represent an innate sig-nificance of nodejto nodei. The second term multiplies
wijby a factor that is exponential intij, the number of links in the shortest path betweeniandj. If 0< δ <1, this term ensures that the payoff contribution for nodei is higher for nodesjthat are closer. The shortest path betweeniand
jwill thus result in the highest pay forifromj, and is the
only pay that is used. The final termcijrepresents acost (instead of a payoff ) for nodeito maintain a direct con-nection to a neighboring nodej. In summary, closer nodes contribute more, but direct connections incur a cost.
The intuition behind the connection between the payoff model and centrality is as follows. If (a) all nodes start with the same capital (i.e.,wii = 0), (b) nodes do not contain any intrinsic value to one another before the algorithm runs (i.e.,wij =wji =1), and (c) there is no cost to main-tain direct connections (i.e., cij = 0) then the network issymmetric. This implies that in an undirected network the amount of “pay” received by a node (positive or nega-tive) is the same as the amount they are providing to other nodes. Pay thus becomes a direct measurement of a node’s benefit to the network.
Extended payoff model
In designing our algorithm ATria, we take the symmet-ric algorithm by Jackson and Wolinsky and extend it in the following ways to encapsulate more general social networks:
1. We allow for edge weights to be non-uniform. Therefore, instead of all weights being equal toδ, the edge weights are0< δij<1. As a consequence, in the second term of Eq. 1 we replaceδtijby the product of theδvalues along the path of maximum pay between nodei and node j.
2. We incorporate negative edge weights, under the limited assumption that all weights are in the range −1< δij<1. With negative edges, a node receives a negative benefit from its connection with a neighbor. However, a path with two negative edges will result in a positive payoff, since the total payoff from a path is the product (not sum) of its edge weights.
3. Centrality is computed iteratively. The most central node is found first, with ties broken arbitrarily. This node is then deleted along with some of the edges in its neighborhood. The centrality values are then recomputed for all the nodes. Although ties are broken arbitrarily, this does guarantee that the list of the most central nodes are not occupied by nodes that are all close to each other. Hence, ATria will find central nodes from all across the network.
Our modified equation, after removingcij, is thus:
ui(G)=
j=i
P(i,j), (2)
where P(i,j) is the path of maximum pay magnitude betweeniandj.
A major deviation from the payoff model is that our algorithm computes the centrality values incrementally as opposed to all at once. Therefore, even if the node with
the highest ui(G) value may be judged the most central node in the first iteration, the node with the second high-est value in the first iteration will not end up as the second most central node, unless it is the highest in the second iteration.
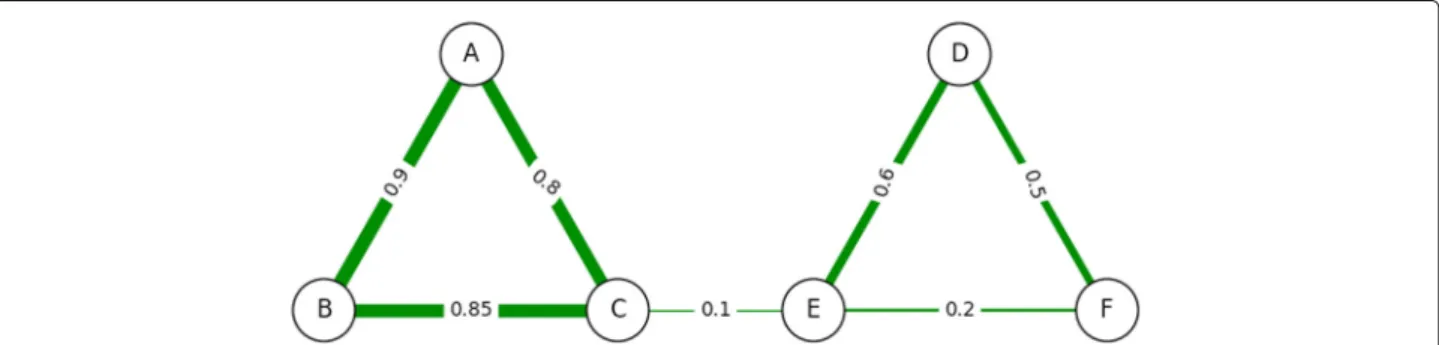
Consider the example in Fig. 2. In this network, the pay-off model would compute nodeBas being the most central to the network, but then would computeAas the second most central andCas the third most central. While this may make sense for the payoff model itself (bothAandC
receive large benefits fromB), it has some shortcomings from the point of view of centrality to say thatAandC
are the next most important nodes, since most of their pay comes as a result ofB. ATria would first findBas the most central node as aleaderof the first triad, but it would then findDas the second most central node as aleaderof the second triad.
This happens because the edges incident on B are deleted afterBis determined as having the highest cen-trality. The logic here is to remove all dependencies on the most central node before computing the next most central node. Also for every triad involving two of these incident edges, we remove the third edge if both incident edges have the same sign and the third edge is positive. This is backed up by social network literature [15], which states that two nodes with a mutual friend (in this case the leaderB) or enemy (a villain) will tend to become friends as a result, meaning their connection iscoincidentaland resulting not from their own importance but the impor-tance of the leader or villain. Such a triad with an even number (zero or two) of negative edges is said to bestable, a necessary condition for social network balance.
Incorporating non-uniform edge weights
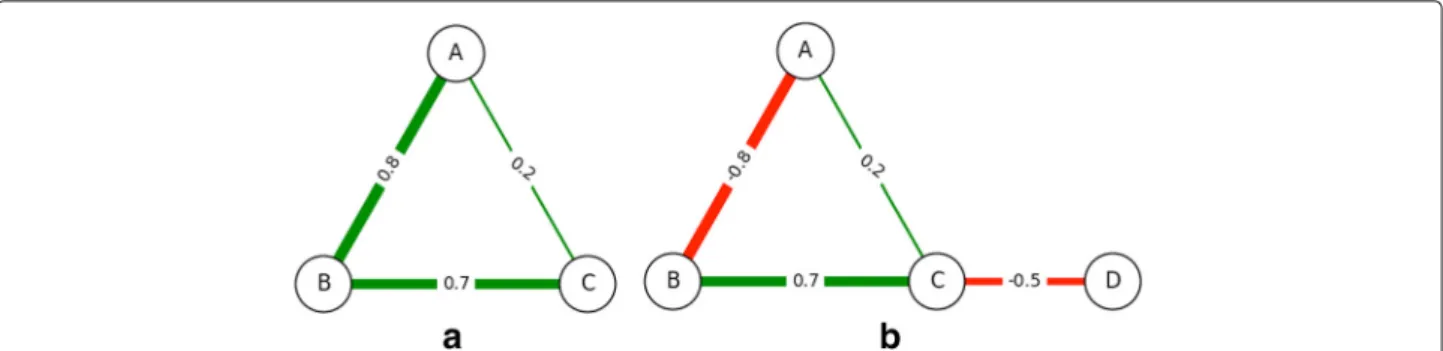
The first change that we make to the Payoff Model, as mentioned, is incorporating non-uniform edge weights. In the unweighted (or uniformly weighted) case, the shortest path betweeniandjis guaranteed to have the fewest num-ber of edges; this may not be true any longer, as illustrated in Fig. 3(a).
To incorporate this change, we use a modified form of Dijkstra’s Algorithm. In particular, the length of a path is the product of its lengths, and the best path is the one with the maximum (not minimum) product. Note that since all edge weights are between 0 and 1, the products can only decrease in magnitude as the path gets longer. Such a modified Dijkstra’s algorithm when started at nodei, will help compute P(i,j) for allj, thus computingui(G) (see Eq. 2).
Incorporating negative edge weights
When negative edge weights are present in the network, we have a possibility for nodes to gain and lose from each other depending on the path along which the effect takes place. Similar to the path of maximum gain, we consider the path of maximum loss as more significant to a node’s centrality as opposed to one of a smaller loss. However, there may be pairs of nodes between which there is a posi-tive length path as well as a negaposi-tive length path. Consider the network in Fig. 3(b). There are two paths betweenA
andD:A–C–D, andA–B–C–Dwith path lengths of 0.2× −0.5 = −0.1 and−0.8× 0.7× −0.5 = 0.28, respectively. One causes a gain, the other incurs a loss.
Dijkstra’s algorithm is modified so that for every starting nodei, we simultaneously keep track of two quantities: the length of the path of highest gain to nodej, and length of the path of highest loss to nodej. This covers situations like in Fig. 3(b) where the path of highest gain fromAtoD
includes a path of highest loss fromAtoCand a path of highest loss fromCtoD. We then modify the REL AXstep in Dijkstra’s algorithm [25] as follows: when relaxing edge
(j,k), if its weight is positive, then we use the maximum gain due to node jto update the maximum gain due to nodekand the maximum loss due to nodejto update the maximum loss due to node k. On the other hand, if its weight is negative, then we use the maximum gain due to nodejto update the maximum loss due to nodekand the maximum loss due to nodejto update the maximum gain due to nodek.
To incorporate both gain and loss, we modify our pay-ment equation to setP(i,j)=G(i,j)+L(i,j), whereG(i,j)
The Author(s) BMC Bioinformatics 2017, 18(Suppl 8):239 Page 13 of 49
Fig. 3Non-Uniform Weighted Networks.aAn example social network with non-uniform positive edge weights. In this situation, the payoff betweenAandCis larger via their indirect connection throughB(0.56) compared with their direct connection to each other (0.2).bAn example network with non-uniform positive and negative edge weights. Nodes can now gain and lose from each other
is the length of the path of maximum gain betweeniandj
andL(i,j)is the length of the path of maximum loss (neg-ative or zero). So our final payment equation for ATria becomes:
ui(g)= |
j=i
G(i,j)+L(i,j)| (3)
Results and discussion
In order to test ATria, we run our algorithm on sam-ple networks alongside five other centrality algorithms: betweenness, closeness, degree, and the eigenvector-based approaches PageRank (PageTrust if the graph has negative weights) and PN. To be fair we use weighted degree centrality, and for running Dijkstra’s algorithm for closeness and betweenness centrality we compute dis-tance by taking the negative logarithm of the absolute value of an edge (so larger edge magnitudes carry smaller weights, yielding shorter paths).
Networks with cliques
Single clique
We begin by studying weighted cliques. The first is a non-uniform weighted clique of size four with a leaderA(in
Fig. 4(a)). The second is the same clique but with the addition of a villain nodeE(Fig. 4(b)). Finally, we show a uniform-weighted clique of rival groups in Fig. 4(c), where the most central node will be a leader to one group and a villain to the other. While ATria agreed with all other algorithms on the most central node for all three exam-ples, only ATria clearly identifiedA as the leader in (a),
E as the villain in (b), and A (arbitrarily, but the point remains) as leader and villain in (c). It does this by set-ting all other centralities to zero, thus assuming that all remaining connections result from connections to these nodes.
Multiple cliques
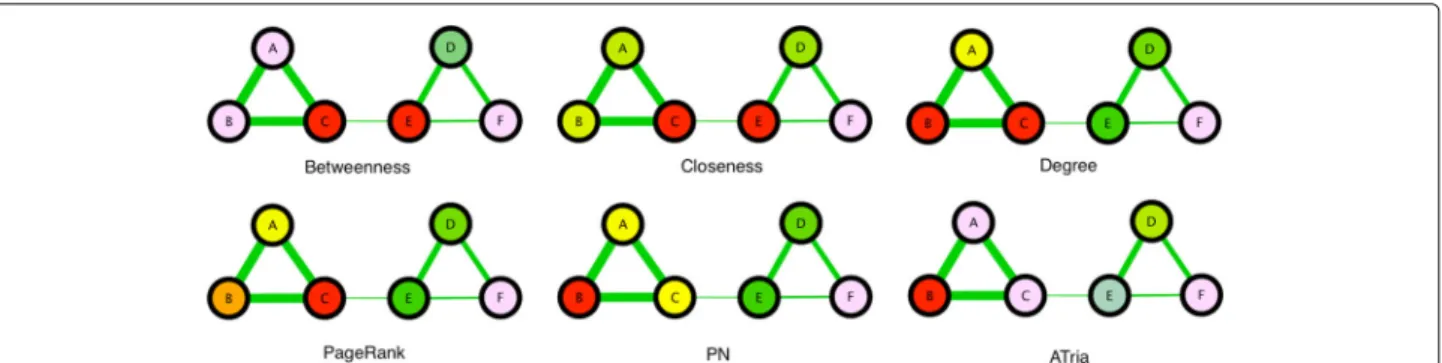
Figure 5 shows our first example of a multiple-clique net-work, which is the non-uniform weighted network from Fig. 2 that has two positive triads connected by a weaker positive edge. In this figure we compare the results of all six algorithms, color coding individual centrality val-ues against a normal distribution (red=maximum, vio-let=minimum, blue and green respectively two and one standard deviations left of the mean, yellow one to the right, orange two to the right). Degree, PageRank and PN
Fig. 4Weighted Cliques.aA weighted four-clique with leaderA,bCliqueawith a villainE,cA clique of rival groups. The same node can be a leader and a villain
Fig. 5Comparison on Two-Triad Social Network. A comparison of ATria with five other centrality algorithms on the network from Fig. 2. Red nodes are the most central
all biased the tighter-connected first triad, while between-ness and closebetween-ness biased the triad bridges. As discussed earlier, ATria computed B as most central (first triad leader), andDas second (second triad leader).E is then arbitrarily chosen as third overC. ATria thus favors lead-ers above bridges if triad edges are stronger than their connections. This holds independent of the sign of the connections. If the connection edgeCEwas stronger than the triads, ATria would choose C as most central for a positive CE (C is in the tighter triad and has closer friends) andEas most central for a negativeCE(for this same reason, more nodes are harmed by its competition withC).
Figure 6 shows a more extreme example, which con-tains one clique of ten nodes and another of one hundred nodes. All edges have random positive weights in the range(0, 1). Note that ATria is able to immediately pick out both leaders, ranking the leader of the larger clique with a much higher centrality than that of the smaller. All other approaches tend to favor one of the two cliques. We summarize these results in Table 1.
Synthetic network with clubs
We now develop a synthetic network to illustrate the type of network for which ATria is most beneficial, with five
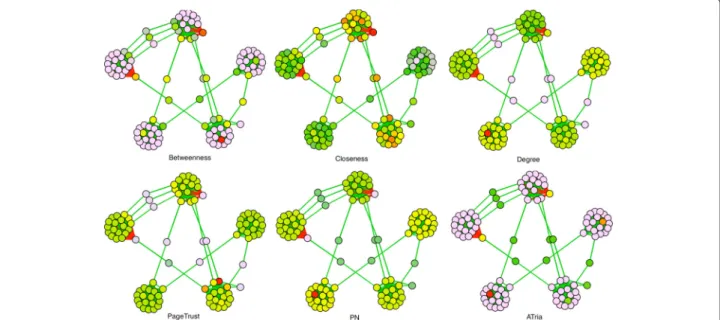
cliques of random sizes between 16 and 20. We randomly choose one leader node for each of three of the cliques, and one villain node for each of the other two. We con-nect leaders to their clique using random edge weights in the range [ 0.85, 1), and villains using(−1,−0.85]. Edges between other nodes are between 0.75 and the lower of the two edges with the leader or villain. We choose a num-ber of bridge nodes equal to half the size of the largest clique and connect them to a random node in two ran-dom cliques using a ranran-dom weight in the range [ 0.75, 1). We run all six algorithms on this network and show our results in Fig. 7. As can be seen, ATria was able to immedi-ately pick out leaders, villains and bridges and set all other centralities to zero.
This situation also illustrates challenges with other cen-trality approaches for this type of network. Betweenness was the only other algorithm able to somewhat separate leaders, villains, and bridges since in this example they reside on most high pay paths, but for this same reason also counted clique nodes connected to bridges (in some cases even above leaders and villains). Closeness central-ity biased the cliques connected by the most bridges, and degree biased the tightest connected cliques. PageTrust and PN found the two villains (low centralities by design) and PN also found the top two leaders (the second less
Fig. 6Comparison on Two Varying-Sized Cliques. Results when running ATria and the other centrality algorithms on two cliques, one of size 10 and the other of size 100
The Author(s) BMC Bioinformatics 2017, 18(Suppl 8):239 Page 15 of 49
Table 1Top two central nodes found by ATria and other centrality algorithms on simple networks (*=leader, +=villain). If only one node is listed, all others have centrality zero. Braces indicate a tie. For the weighted 4-clique we ran one example with a leader node and one with a villain. For the two cliques,N(i)indicates some neighbor of nodei, which may vary with the algorithm
Betweenness Closeness Degree PageRank PN ATria
Wt 4-Clique 1 A* A*, D A*, C A*, C A*, C A*
Wt 4-Clique 2 E+ A, D E+, A A, C A, C E+
Rival Groups {A, E},{B, F} all nodes all nodes all nodes all nodes A
Two Triads {C, E},D* {C, E},B* {B*, C},A C,{A, B*} B*,{A, C} B*, D*
Two Cliques A*, N(A) A*, N(A) A*, N(A) A*, N(A) A*, N(A) A*, B*
obvious), but then biased their cliques and lost the third. We summarize these results in Table 2.
Biological networks
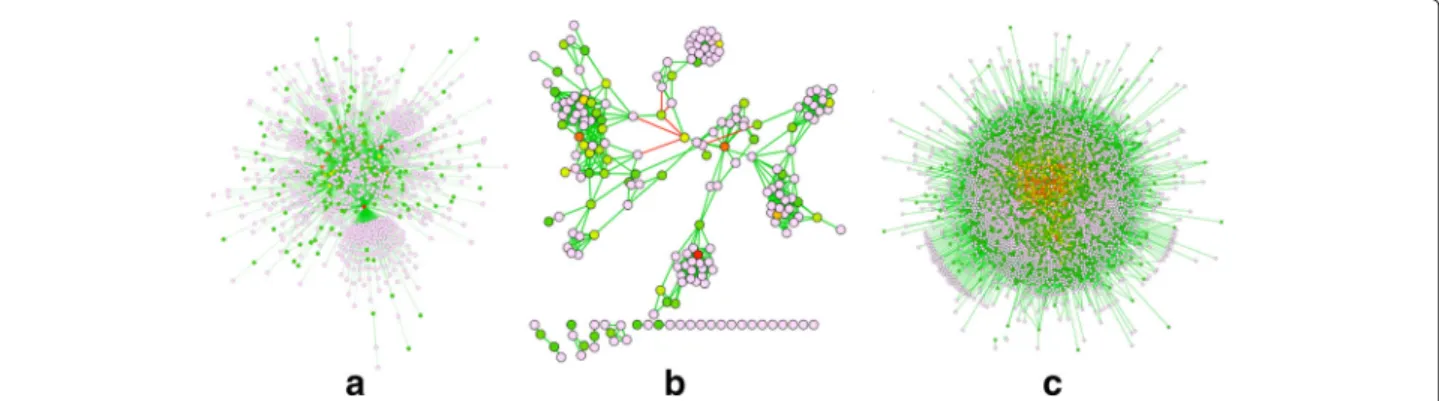
We now demonstrate ATria’s results on three types of bio-logical networks. The first, shown in Fig. 8(a) is a synthetic scale-free network of 1000 nodes. We use this as an over-arching example of a network that is common across many areas of biology, including PPIs, cell signalling pathways [26], and neural networks [27]. The second, in Fig. 8(b), is a gene co-expression network (GEO:GSE31012) from a species of oyster under different salinity conditions. Finally as our largest example in Fig. 8(c), we run a yeast PPI [28] (BioGrid:S288c) consisting of 5526 nodes. Note that the PPI is by definition uniformly weighted and posi-tive, since proteins either interact or do not interact.
Scale-free networks are known for the presence of crit-icalhubnodes, which ATria also ranks with the highest centrality. The co-expression network shows that with more realistic biological data, ATria can still find leaders
and villains across the network. The transcription factor
Nuclear Y-Subunit Alpha(NYFA, [29]) was ranked #7 by ATria. This was found first by degree and PN central-ity, but no other algorithms found transcription factors in their top ten. However, while degree and PN centrality then biased central nodes around this transcription fac-tor, ATria was able to find a protein TRIM2 (#2) from the Tripartite Motif (TRIM, [30]) family, which no other algo-rithm found. TRIM2 helps bind the moleculeUbiquitin
to proteins as a tag for later modification [31]. ATria dis-covered Ubiquitin itself as #4 in the yeast PPI. A specific type of modification for which Ubiquitin binds to proteins is degradation in the proteasome, and ATria also found
Rpn11(#7), which is responsible for removing Ubiquitin from proteins before entering the proteasome [32]. These results exhibit agreement with Cicehanover, Hershko and Rose in their discovery of Ubiquitin-mediated proteolysis and its regulation of numerous critical cellular processes including the cell cycle [33], helping them win the 2004 Nobel Prize in Chemistry.
Fig. 7Comparison on Synthetic Network. A comparison of ATria with five other centrality algorithms on a synthetic network with five cliques (three with a leader, two with a villain), plus some bridge nodes
Table 2Comparison of ATria’s results with those other algorithms on a 102-node synthetic network with five cliques, three with leadersA, B, C, two with villainsD, Eand bridge nodes F-Oconnecting cliques
Node Betweenness Closeness Degree PageTrust PN ATria
A (Leader) 2 2 2 B (Leader) 9 1 1 1 C (Leader) 1 3 4 5 D (Villain) 3 3 88 102 4 E (Villain) 2 1 102 101 3 F (Bridge) 101 98 98 6 G (Bridge) 96 95 94 10 H (Bridge) 100 101 97 13 I (Bridge) 95 94 93 9 J (Bridge) 15 98 91 96 15 K (Bridge) 8 97 99 97 11 L (Bridge) 99 97 96 12 M (Bridge) 5 93 96 91 7 N (Bridge) 99 102 100 99 14 O (Bridge) 13 8 94 93 100 8
Final rankings of any nodesA-Ofound in the top or bottom 15
Microbial social network
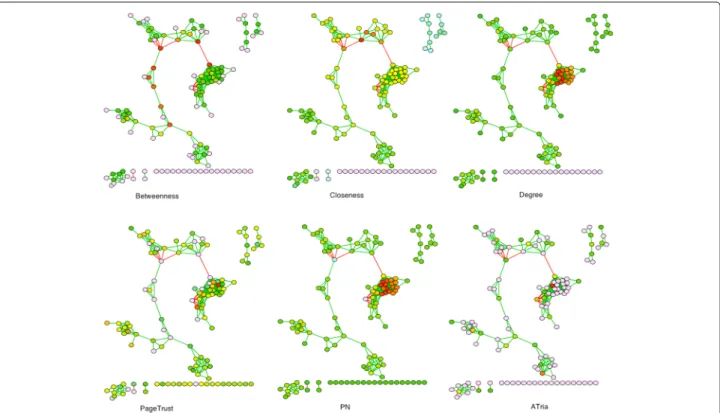
We now show the results of ATria and the five other cen-trality algorithms on the co-occurence network assembled from human lung microbiome data, from Fig. 1. These results are shown in Fig. 9.
For this network, both degree and PN centrality restricted the highest ranked nodes to the tightest club in the center of the network. Closeness centrality tended to bias the center of the largest connected component, with centrality decreasing as nodes were more out of this loop. Betweenness centrality was heavily biased towards bridges in the largest connected component. The only other algo-rithm that was able to find central nodes in multiple clubs
was PageTrust; however, ATria was able to better isolate one or two nodes in each club, followed by the bridges.
Based on the results of ATria, the bacterial taxa most likely to be producing a critical metabolite would be:
F. Burkholderiaceae (the most central node, leader of the tightest club in the middle), F. Erysipelotrichaceae
(#2, leader of the club just to the south),Bifidobacterium
(#4, leader of the club to the southwest), andAtopobium
(#6, leader of the southernmost component).F. Prevotel-laceae (#3) is a villain of the tightest knit club which is likely to be in competition for a resource (possibly the same metabolite) that many bacteria in this club need. Bridge nodes such as Prevotella (#5, connecting many nodes in the two northernmost clubs) andSelenomonas
(#8, part of a central bridge connecting the southwest-ern clubs to the largest connected component) could be producing a metabolite that benefits multiple clubs. Inter-estingly, ATria also foundC.Gammaproteobacteria(#7), which is an enemy bridge between the largest club and the rest of this largest connected component. This could indicate competition with its counterpartFusobacteriaas critical to the network structure.
Conclusions
Our results demonstrate that the application of economic models using payoffs can be useful to computing central-ityin a signed and weighted social network when find-ing important leader, villain and bridge nodes. We built ATria as an iterative extension of a payoff model using social networking principles and in the process overcome shortcomings of existing algorithms for computing cen-trality, identifying central nodes across the network as opposed to many in the same vicinity. We verifed these results using scale-free networks and synthetic networks with both positive and negative edge weights, both of which are particularly relevant in biological networks, and finally real biological networks including a bacterial co-occurence network (orMicrobial Social Network).
Fig. 8Comparison on Biological Networks. Results of ATria onaa 1,000-node scale-free network,ba gene co-expression network from a species of oyster, andca yeast PPI network
The Author(s) BMC Bioinformatics 2017, 18(Suppl 8):239 Page 17 of 49
Fig. 9Comparison on Microbial Social Network. A comparison of ATria to the other five centrality algorithms on the co-occurence network assembled from lung microbiome data, from Fig. 1
As future work, we would like to explore extensions of ATria to directed networks, as while uncommon in the social networking field would be useful when applied to biological networks. We also would immediately like to explore the idea of interference [34] to show and ana-lyze the effects of removing ATria’s highly central nodes from our networks. Finally, since the time complexity of ATria is more expensive than other centrality algorithms (see Table 3) due to recomputing centralitiesntimes in the worst case, we have developed a module of ATria for the Graphics Processing Unit (GPU) and plan on releas-ing this open-source as part of a larger microbial analysis pipeline.
Table 3Time complexity of ATria, compared to other centrality algorithms
Algorithm Time complexity
Betweenness O(n3) Closeness O(n3) Degree O(n3) PageTrust O(i·n3) PN O(i·n3) ATria O(n4)
For eigenvector-based algorithms,iis the number of iterations that it takes to converge
Abbreviations
ATria: Ablatio Triadum; GPU: Graphics processing unit; PPI: Protein-Protein Interaction; TRIM: Tripartite motif
Acknowledgements
The authors acknowledge the help of Michael Campos, Cameron Davis, Mitch Fernandez, Wenrui Huang, Lawrence Irvin, Kalai Mathee, Jingan Qu, Juan Daniel Riveros, Victoria Suarez-Ulloa, and Camilo Valdes in many useful discussions.
Funding
The work of Giri Narasimhan was partially supported by a grant from Florida Department of Health (FDOH 09KW-10) and a grant from the Alpha-One Foundation. The work of Vanessa Aguiar-Pulido was supported by the College of Engineering and Computing at Florida International University. Trevor Cickovski was funded by a Faculty Development Grant from Eckerd College. Publication charges for this article will be paid through personal funds of the authors.
Availability of data and material
ATria is now part of the PluMA [35] analysis pipeline, available along with all applicable data for this study at http://biorg.cs.fiu.edu/pluma/ for download. In addition, we have placed a small version with single ATria executions from this paper at http://biorg.cs.fiu.edu/pluma/atria.
Authors’ contributions
This work was conducted by the Bioinformatics Research Group (BioRG) at Florida International University managed by GN and spearheaded by TC. All authors contributed to all portions of this project. All authors read and approved the final manuscript.
Competing interests
The authors declare that they have no competing interests.
Consent for publication
Ethics approval and consent to participate
Not applicable.
About this supplement
This article has been published as part of BMC Bioinformatics Volume 18 Supplement 8, 2017: Selected articles from the Fifth IEEE International Conference on Computational Advances in Bio and Medical Sciences (ICCABS 2015): Bioinformatics. The full contents of the supplement are available online at https://bmcbioinformatics.biomedcentral.com/articles/supplements/ volume-18-supplement-8.
Publisher’s Note
Springer Nature remains neutral with regard to jurisdictional claims in published maps and institutional affiliations.
Author details
1Bioinformatics Research Group (BioRG) & Biomolecular Sciences Institute,
School of Computing & Information Sciences, Florida International University, 11200 SW 8th St, Miami, FL 33196, USA.2Department of Computer Science, Eckerd College, 4200 54th Avenue South, Saint Petersburg, FL 33711, USA.
Published: 7 June 2017
References
1. Newman MEJ. Networks: an introduction. Oxford: Oxford University Press; 2010.
2. Davidson E, Levin M. Gene regulatory networks. Proc Natl Acad Sci U S A. 2005;102(14):4935.
3. Schwikowski B, Uetz P, Fields S. A network of protein-protein interactions in yeast. Nat Biotech. 2000;18(12):1257–61.
4. Ackerman J. The ultimate social network. Sci Am. 2012;306(6):36–43. 5. Atkinson S, Williams P. Quorum sensing and social networking in the
microbial world. J R Soc Interface. 2009;6(40):959–78.
6. Fernandez M, Riveros JD, Campos M, Mathee K, Narasimhan G. Microbial “Social Networks”. BMC Genomics. 2015;16(11):S6. (Special Issue). 7. Bassler BL, Wright M, Showalter RE, Silverman MR. Intercellular signalling
in Vibrio Harveyi: sequence and function of genes regulating expression of luminescence. Mol Microbiol. 1993;9(4):773–86.
8. Williams SCP. Microbial social networks. HHMI Bulletin. 2013;26(3):1–6. 9. Pereira CS, Thompson JA, Xavier KB. Ai-2-mediated signalling in bacteria.
FEMS Microbiol Rev. 2013;37(2):156–81.
10. Kim PJ, Price ND. Genetic Co-Occurrence Network across Sequenced Microbes. PLoS Comput Biol. 2011;7(12):1002340.
11. Fruchterman TMJ, Reingold EM. Graph drawing by force-directed placement. Softw Pract Experience. 1991;21(11):1129–64.
12. Shannon P, Markiel A, Ozier O, Baliga NS, Wang JT, Ramage D, Amin N, Schwikowski B, Ideker T. Cytoscape: A software environment for integrated models of biomolecular interaction networks. Genome Res. 2003;13(11):2498–504.
13. Koschutzki D, Schreiber F. Centrality analysis methods for biological networks and their application to gene regulatory networks. Gene Regul Syst Bio. 2008;2:193–201.
14. Wu Q, Qi X, Fuller E, Zhang CQ. Follow the leader: A centrality guided clustering and its application to social network analysis. Sci World J. 2013;2013:1–9.
15. Easley D, Kleinberg J. Networks, Crowds, and Markets: Reasoning About a Highly Connected World. Cambridge: Cambridge University Press; 2010. 16. Bonacich P. Power and centrality: A family of measures. Am J Sociol.
1987;92:1170–82.
17. Boldi P, Vigna S. Axioms for centrality. Internet Math. 2014;10:222–62. 18. Brin S, Page L. Reprint of: The anatomy of a large-scale hypertextual web
search engine. Comput Netw. 2012;56(18):3825–33.
19. Xing W, Ghorbani A. Weighted PageRank algorithm. In: Proceedings of the Second Annual Conference on Communication Networks and Services Research. Washington: IEEE; 2004. p. 305–14.
20. de Kerchove C, Van Dooren P. The PageTrust algorithm: How to rank web pages when negative links are allowed? In: Proceedings SIAM Data Mining Conference (SDM2008). Atlanta: SIAM; 2008. p. 346–52. 21. Everett MG, Borgatti SP. Networks containing negative ties. Soc
Networks. 2014;38:111–20.
22. Cickovski T, Peake E, Aguiar-Pulido V, Narasimhan G. ATria: A novel centrality algorithm applied to biological networks. In: International Conference on Computational Advances in Bio and Medical Sciences (short Abstract). ICCABS ’15. Miami: IEEE; 2015. p. 1.
23. Barabási AL, Albert R. Emergence of scaling in random networks. Science. 1999;286(5439):509–12.
24. Jackson MO, Wolinsky A. A strategic model of social and economic networks. J Econ Theory. 1996;71(1):44–74.
25. Cormen T, Leiserson C, Rivest R, Stein C. Introduction to Algorithms. Cambridge: MIT press; 2009.
26. Albert R. Scale-free networks in cell biology. J Cell Sci. 2005;118(21): 4947–57.
27. Watts DJ, Strogatz SH. Collective dynamics of’small-world’networks,. Nature. 1998;393(6684):409–10.
28. Park D, Singh R, Baym M, Liao CS, Berger B. Isobase: a database of functionally related proteins across PPI networks. Nucleic Acids Res. 2011;39(suppl 1):295–300.
29. Maity SN, de Crombrugghe B. Role of the ccaat-binding protein cbf/nf-y in transcription. Trends Biochem Sci. 1998;23(5):174–8.
30. Reymond A, Meroni G, Fantozzi A, Merla G, Cairo S, Luzi L, Riganelli D, Zanaria E, Messali S, Cainarca S, Guffanti A, Minucci S, Pelicci PG, Ballabio A. The tripartite motif family identifies cell compartments. EMBO J. 2001;20:2140–51.
31. Consortium TU. Uniprot: a hub for protein information. Nucleic Acids Res. 2015;43(D1):204–12.
32. Worden EJ, Padovani C, Martin A. Structure of the Rpn11-Rpn8 dimer reveals mechanisms of substrate deubiquitination during proteasomal degradation. Nat Struct Mol Biol. 2014;21(3):220–7.
33. Ciechanover A, Hershko A, Rose I. For the Discovery of
Ubiquitin-Mediated Protein Degradation. 2004. Available at http://www. nobelprize.org/nobel_prizes/chemistry/laureates/2004/. Accessed 2015. 34. Scardoni G, Petterlini M, Laudanna C. Analyzing biological network
parameters with CentiScaPe. Bioinformatics. 2009;25(21):2857–9. 35. Cickovski T, Aguiar-Pulido V, Huang W, Mahmoud S, Narasimhan G.
Lightweight microbiome analysis pipelines In: Guzman FO, I. R. Ruiz GSLP, editors. International Work Conference on Bioinformatics and Biomedical Engineering. IWBBIO ’16. Granada: Springer; 2016. p. 225–7.
• We accept pre-submission inquiries
• Our selector tool helps you to find the most relevant journal
• We provide round the clock customer support
• Convenient online submission
• Thorough peer review
• Inclusion in PubMed and all major indexing services
• Maximum visibility for your research Submit your manuscript at
www.biomedcentral.com/submit