70
Indirect Tax and Economic Growth
ILABOYA, O. J. (PhD, FCA)ofuanwhyte@gmail.com, ojwhyte@yahoo.com
+2348033447409, +23493447409 MGBAME, C.O. (PhD) +2348033460311chijioke.mgbame@uniben.edu
DEPARTMENT OF ACCOUNTING FACULTY OF MANAGEMENT SCIENCESUNIVERSITY OF BENIN, NIGERIA
ABSTRACT
The main thrust of this study is to investigate the indirect tax-economic growth dynamics against the backdrop of the paucity of empirical literature in developing countries with Nigeria as a reference point. The study adopted a combination of cointegration and error correction mechanism after series of dagnostic tests which helped to check the adequacy of the specified model. The Engel-Granger two step procedure was used to test the short run dynamic behaviour of the model while the Autoregressive Distributed Lag (ARDL) was used to correct the discrepancies between short and longrun impact of the explanatory variables. The result of the diagnostic tests shows the adequacy of the specified model. The study found a negative and an insignificant relationship between indirect tax and economic growth in Nigeria. The ratio of total indirect tax to total tax revenue reported a negative coefficient of (0.5817). The ratio of total tax to total federal revenue reported a robust t-value of (19.9276) and a positive coefficient of (2.0886) at the 1% level of significance. Against the above result, it was recommended that emphasis should be shifted from indirect tax as a growth driver in Nigeria.
Keywords: Indirect Tax, Custom and Excise Duties, Value Added Tax, Total Federal Revenue, Diagnostic tests, Cointegration statistics.
Introduction
The monoproduct status of the Nigerian economy has received series of criticisms in recent times. According to Okonjo-Iweala (2012:17) “…without the diversification of Nigerian revenue from oil, the economy will soon collapse”. In this current year (2012), Nigeria’s dependence on crude export for revenue based on the projected price and assumed production is 80%. During the second quarter, oil revenue has accounted for over 76% of government revenue. (Ebosele & Adekoya, 2012). The implication of this overly dependence on oil revenue is the boom-and-burst nature of the economy (Akpokodge, 2000).
Against the backdrop of the need to diversify the economy of Nigeria, taxation has come extremely handy. Taxation is made up of two broad components and several subcomponents. In the developed economy where empirical literature on tax composition economic growth dynamics abound, there are conflicting empirical reports on the economic implication of indirect and direct taxation. For purposes of this study, emphasis is on indirect tax. While Herberger, (1964); Poterba, Rotember and Summers (1996); Madsen and Damania, (1996); Emran and Stiglitz (2005); Greenidge and Drakes, (2009); found a significant and negative relationship between the indirect tax and growth nexus, others such as Kneller, Bleaney and Gemmel (1999); Bird (2003); Arisoy and Unlukaplan (2010); and Scarlet, (2011) found a positive relationship between indirect tax and economic growth.
Statement of the Research Problem.
While there are inconsistencies as to the relationship between indirect taxation and economic growth in the developed countries, the same cannot be said of Nigeria and other developing countries. To the best of our
71
knowledge, in Nigeria and other developing countries, there is dearth of indigenous empirical literature that addresses the relationship between indirect tax and economic growth. This study is motivated by two developments. First by the inconsistency in existing empirics in developed economies which are often generalised to developing economies and secondly by the wide knowledge gap occasioned by the paucity of empirical literature in developing economies. Therefore, this study attempts to reconcile the different positions and also close the knowledge gap.
Research Objectives
The broad objective of this research is to investigate the indirect tax-growth dynamics against the backdrop of the problems identified above. The study also sort to determine the relationship between some relevant explanatory variables such as population growth rate, investment income ratio, total tax to federal revenue, and economic growth in Nigeria.
THEORETICAL FRAMEWORK AND REVIEW OF EMPIRICAL LITERATURE
The investigation of the relationship between indirect tax and economic growth in Nigeria is anchored on the endogenous framework which advanced a dynamic steady growth state. Popularized by King and Robelo (1990), the endogenous growth model believed that government policy, including taxation, can permanently increase per capital output with a high level of innovation. The economic implication of this model is that taxes and government spending can have consistent effect on output at both the short run and the long run.
Having established a significant relationship between taxation and economic growth, the choice of the optimal tax structure have been very problematic. According to Martinez-Vacquez et al (2009).
With the coexistence of direct and indirect forms of taxation explained in the theoretical optimal tax literature, the big question that has remained largely unanswered is that of the economic consequences of the different mixes of direct and indirect taxes.
Leaning on the endogenous growth framework, Atkinson and Stiglitz (1976) theorem states that in an economy where the differentials between people is based solely on their wage earning ability, the utility function is dissociable between labour and all commodities, the choice of the optimal tax mix should tend towards direct tax. Atkinson – Stiglitz theorem assumes some level of homogeneity in individual qualitative characteristics but in real life situation, productivity and endowment of individuals differ greatly. Therefore, it means where there is heterogeneity in individual endowment, indirect tax becomes more appropriate. According to Cremer, Pestieau and Bochet (2001), since individuals differ in their qualitative characteristics, a general income tax will not suffice. Instead, differential commodity (indirect) taxes should form the basis of optimal tax policy. And in a federating entity where each unit is vested with autonomous taxing power (as prescribed in the celebrated case of McCulloch .v. Maryland and re-interated in Roxa .v. CTA 28SCRA 276) direct and indirect consumption taxes according Dahlby (2003) could enhance the transparency of tax administration. The debate between direct and indirect tax in designing an optimal tax system had not only be protracted but also polarized. At one extreme are proponents of indirect tax as a growth driver while at the other extreme are those who observed negative or non-significant relationship between indirect tax and economic growth.
Opponents of indirect tax believe that it increases income inequality since both the rich and the poor pay same amount of taxes on the same commodity. This will further widen the income gap in the society. In addition, indirect taxes are considered to be inflationary in nature since the tax charged on goods and services consumed increases the unit price of the product. Against the above background, some researchers are of the view that indirect tax has negative effect on economic growth.
The earliest work on the growth effect of indirect taxes is by Harberger (1964) who observed that the degree of effect of indirect tax on investment is insufficient to stimulate economic growth. In the model tested, the changes in the taxation components do not impact on the labour supply and investment and this resulted in insignificant changes in economic growth. The main emphasis of the Herberger study was the effect of indirect tax on labour supply growth. In the same vein, Koch, Schoeman and Van –Tonder (2005), using time series data from South Africa for the period 1960-2002, analysed firstly, the relationship between taxes and economic growth and secondly, the effect of ratio of
72
indirect taxes to total tax revenue on economic growth. They observed that an increase in indirect tax compared to direct tax reduces economic growth.
Poterba, Rotemberg and Summers (1986) focused on the economy of United Kingdom and the United States and investigated the economic consequences of the shift from direct to indirect taxes for the periods(1964:3 to 1983:4 for United Kingdom) and (1948:3 to 1984:4 for United States). The research revealed that for the United Kingdom, the shift to indirect taxes reduces real output, increase prices and after-tax wages in the short run, but without a significant long run effect. Similar conclusion was reached for the United States. Standing on the same premise, Madsen and Damania (1986) replicated the Poterba et al study using a sample of 22 OECD economies over the period 1960-1990. They observed that for majority of the OECD economies, a revenue-neutral shift from direct to indirect taxes has no impact on economic activities in the long run. Though some selected few, presented a contrary result. Significantly, there is a correlation between the study and other existing studies with negative or non-significant effect of indirect taxes on economic growth.
Greenidge and Drakes (2009), focusing on the economy of Barbados and using an unrestricted error correction model examined the relationship between tax policy and macroeconomic activities. They found that total tax and indirect taxes have a contractionary effect on the economy in both the short run and long run period. Musanga (2007) investigated the relationship between indirect taxes and economic growth in Uganda using data from 1987 to 2005. The study adopted the cointegration regression technique. The result of the study revealed that a % change in indirect tax would decrease economic growth by 0.53%. The indirect tax variable had a t-value of (-2.588) which means there is a significant but negative relationship between indirect tax and economic growth in Uganda.
The proponents of indirect tax as a growth driver advanced the buoyancy and flexibility argument. That is indirect tax has the ability to generate higher tax revenue with changes in the rate and base of the tax (buoyancy). While flexibility connotes the ability of the tax system to generate higher tax revenue with changes in tax base. Kneller, Bleaney and Gemmell (1999) focused on 22 OECD countries for the period 1970 to 1995. They used five years average of the annual data to circumvent the business cycle effect. They employed static panel econometric technique to investigate the relationship between fiscal policy and growth. The result of the study found a significant and positive relationship between non-distortionary taxation (indirect tax) and economic growth. They concluded that indirect tax is less harmful to the economy as it does not cut down on return on investment compared to direct tax. In the same vein, Arisoy and Unlukaplan(2010), focusing on the Turkish economy, investigated the relationship between direct and indirect tax and economic growth, using data from 1968-2006. The study adopted the ordinary least square econometric technique and it was found that real output is positively related to indirect tax revenue. They concluded that indirect taxes are significantly and positively correlated with economic growth in Turkey. Scarlet (2011) used the standard growth functions within the autoregressive distributed lag to investigate the relationship between taxation and economic growth in Jamaica. The study employed quarterly time series data from 1990 to 2010. The study found a significant and positive relationship between indirect tax and economic growth in the long run. Still on the indirect tax – economic growth nexus, Aamir, Qayyuum, Nasir, Hussain, Khan and Butt (2011) using panel data of direct and indirect taxes in Pakistan and India from 2000 to 2009 discovered that in Pakistan, indirect taxes have statistically significant positive impact on total revenue and by extension economic growth. The study found that if total indirect taxes increases by Rs.1, the increase in total tax revenue would amount to Rs 1.495.
METHODOLOGY:
The framework for this study is based on the Feder’s (1982) two sector model as adapted by Ram (1986), Koch et al
(2005) and Arisoy and Ulukaplan (2010). In relation to the Feder’s model, the Nigerian economy is divided into 2 sectors (the private and government sectors). Given as:
,
(
g g)
G
=
G L K
(1) ,(
p p)
P
=
P L K
+
G
(2)73 P=Private sector
L=Labour input K=Capital input
Subscripts g and p represents the sectoral inputs Y= Total output
The total inputs of the formal and informal sector can be specified as
p g
L
=
L
+
L
(3)p g
K
=
K
+
K
(4)The total output (Y) (combination of the output of both the government sector and private sector) can be represented as
, ; , ,
(
g g p p)
Y
=
f L K L K G
= = +
Y
P
G
(5)Differentiating with respect to both sectors or taking the total differentials of 5 with respect to changes in inputs and the share of government spending, total output yields.
( )
(
)
Y
P P
G G
Y
P
Y
G
Y
∆
∆
∆
=
+
(6)Where
∆
indicates growth rate, with variation in relative factor productivity of both sectors, the relation can be specified below:(1
)
L K L KG
G
P
=
P
= +
σ
(7) Where : LG
G
L
∂
=
∂
= Marginal Product of labour in the government sectorL
P
P
L
∂
=
∂
= Marginal Product of Labour in the private sectorK
G
G
K
∂
=
∂
= Marginal Product of Capital in the government sectorK
P
P
K
∂
=
∂
= Marginal Product of Capital in the private sectorUsing the two sector production functions and equation 7, we derived the following aggregate growth equations:
1
1
Y
L
G
G G
Y
Y
L
G
G
Y
δ
α
β
θ
θ
δ
∆
=
+
∆
+
∆
+
−
∆
+ ∈
+
(8)74
Thus far, taxes have not being introduced into the equation which explains output growth. In a balanced budget, and following Koch et al (2005) and Arisoy and Ulukaplan (2010), we assume a consistent and static relationship between Government expenditure (G) and Taxation (T). Therefore, government expenditure can be proxied with taxation such that:
G
= =
T
Td
+
Tid
(9)Where G= Government expenditure T= Total Tax Revenue Td= Direct taxes
Tid= Indirect taxes, Therefore,
G
Td
Tid
G
G
∆
∆
+ ∆
=
(10)For purposes of this study, we emphasised the indirect tax component and our estimation equation is
0 1
1
1
Tid
Y
L
Tid Tid
Tid Tid
Y
Y
L
Tid
T
Tid
Y
δ
α
α
β
θ
θ
δ
∆
+
+
+
∆
+
∆
+
−
∆
+ ∈
+
(11)To circumvent the problem of multicollinearity we decomposed the estimated equation into a baseline equation and a robust equation. The practice of using baseline equation as in line with the work of Levine and Renelt (1992). The baseline equation is given as:
3 0 1 2 1
( )
t t tCED
VAT
GDPGR
Ln Z
U
TID
TID
β
β
β
β
==
+
+
+
∑
+
(12) Where Z is a control vector and U is a stochastic error term. To examine the robustness of the baseline equation, we expanded the Z vector. Thus, the robust regression model is formulated as:{
}
(
)
5 0 1 2 3 4 1 , 1 3 1( )
p P P I p J J it J t t tI
L
Td
Tid
T
GDPGR
Y
L
Y
T
TFR
TID
Z
U
β
β
β
β
β
β
β
β
β
− = =∆
=
+
+
+
+
+
+
∑
−
+
∑
+
(14) The terms{
}(
)
1 , 1 p P P I J p J it JTID
β
β
− =−
∑
captures the variables that could survive significance under the baseline estimation of the indirect tax components. By definition,GDPGR
= Gross Domestic Product growth rateCED
Tid
=Custom and Excise duties as a percentage of total indirect taxVAT
75
1
Y
=a measure of physical capital stockL
L
∆
= a measure of human capital stock Z = Vector of control variables
B1 – B4 >0
Data and Data Source
Data for this research comprises of annual time series data from 1980-2011. Data for the indirect tax variables were collected from the Central Bank of Nigeria annual accounts and the Federal Inland Revenue Services. The control variables were sourced from the relevant parastatals: Secondary school enrolment (Ministry of Education, Abuja); investment to income ratio (CBN statistical bulletin).
Estimation, Presentation, and Data Analyses
A combination of cointegration and error correction mechanism were adopted in this research. The choice of these econometric techniques is based on the ability to ascertain stationarity and test for causality among the variables.
Table 1: Analysis of Diagnostic Test Statistic
The measure Baseline Estimation 1 Estimation 2 Estimation 3 Remark
R2(1 0.954 0.645 0.8763 0.8399 Significant
Adjusted R2 0.925 0.6250 0.46 0.2656
E-Statistic 24.570(0.0034) 64.43 (0.000) 46.0(0.000) 26.56(0.000) Significant Jarque Bera 0.745(0.409) 0.10991(1.862) 1.0828(1.0526) 1.0062(0.0289) Gaussian normality
Durbin-Watson 2.09 2.0994 2.1883 2.1268 Non-autocorrelation
Ramsey RESET 2.0857(0.0037) 10.100(0.0002) 20.859(0. 0009))
82.270(0.0000) Non-misspecification
Source: Authors’ computation 2012.
Preliminary diagnostic tests were performed to test the adequacy of the specified model and avoid spurious results. In this regard, normality test was performed to test if the variables of regression follow the standard normal distribution. For this purpose, the Jarque and Bera (1987) statistic was employed. The study tested for serial correlation. With serial correlation, ordinary least square estimators are no longer BLUE (Best Linear Unbiased Estimator). The Durbin-Watson (DW) statistic was used to test for serial correlation. The Ramsey (1969) test was used to test for regression specification error. The results o the diagnostic tests are presented in table 1 above.
76
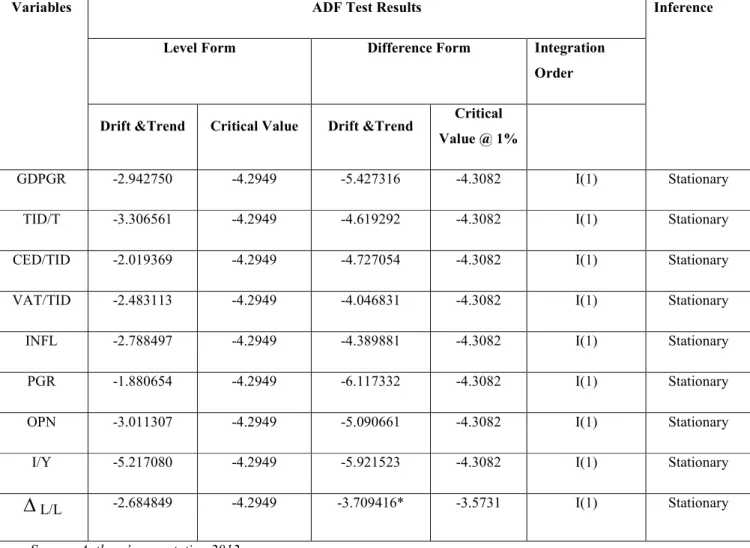
Table II: Results of Stationarity Tests based on ADF Test Method.
Variables ADF Test Results Inference
Level Form Difference Form Integration Order
Drift &Trend Critical Value Drift &Trend Critical Value @ 1%
GDPGR -2.942750 -4.2949 -5.427316 -4.3082 I(1) Stationary
TID/T -3.306561 -4.2949 -4.619292 -4.3082 I(1) Stationary
CED/TID -2.019369 -4.2949 -4.727054 -4.3082 I(1) Stationary
VAT/TID -2.483113 -4.2949 -4.046831 -4.3082 I(1) Stationary
INFL -2.788497 -4.2949 -4.389881 -4.3082 I(1) Stationary
PGR -1.880654 -4.2949 -6.117332 -4.3082 I(1) Stationary
OPN -3.011307 -4.2949 -5.090661 -4.3082 I(1) Stationary
I/Y -5.217080 -4.2949 -5.921523 -4.3082 I(1) Stationary
∆
L/L -2.684849 -4.2949 -3.709416* -3.5731 I(1) StationarySource: Authors’ computation 2012.
To ascertain the time series property of the variables, we tested for unit root using the Augmented Dickey Fuller (ADF) tests. The ADF test the null hypothesis of a unit. Therefore, a rejection of the null under this test is indicative of the absence of unit root. The result of the ADF unit root test is presented in table II above. The result provides empirical evidence of non-stationarity of the variables in level except the investment income ratio which is stationary (since ADF statistic of investment income ratio of (-5.217680) exceeded the ADF critical value of (-4.2949) at the 1% significance levels). All other variables in the study gained stationarity at first differencing. That is after first differencing, the means and variances of all the variables in the ADF test became constant over time (stationary).
77
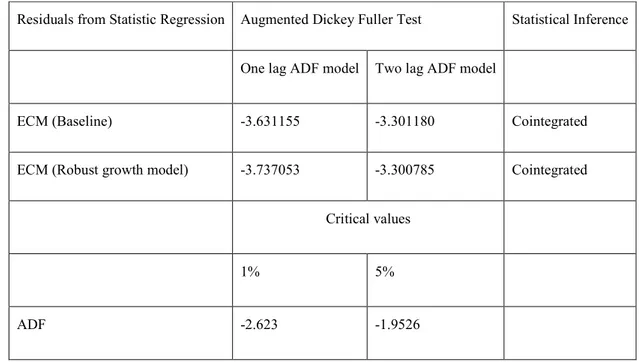
Table III: Cointegration Test Results based on the Engle-Granger Two Step Approach.
Residuals from Statistic Regression Augmented Dickey Fuller Test Statistical Inference One lag ADF model Two lag ADF model
ECM (Baseline) -3.631155 -3.301180 Cointegrated
ECM (Robust growth model) -3.737053 -3.300785 Cointegrated
Critical values
1% 5%
ADF -2.623 -1.9526
Source: Authors’ computation 2012.
Based on the stationarity of the variables, we performed cointegration test using the Engle-Granger two step approach. From the table above, it was observed that the one lag and two lag ADF (-3.637155 and -3.301180) test statistics of the baseline model exceeded the ADF critical value of (-1.9526) at the 5% level of significance. Same is applicable to the robust model. The initial conclusion here is that all the variables are stationary and are into a long run relation.
78
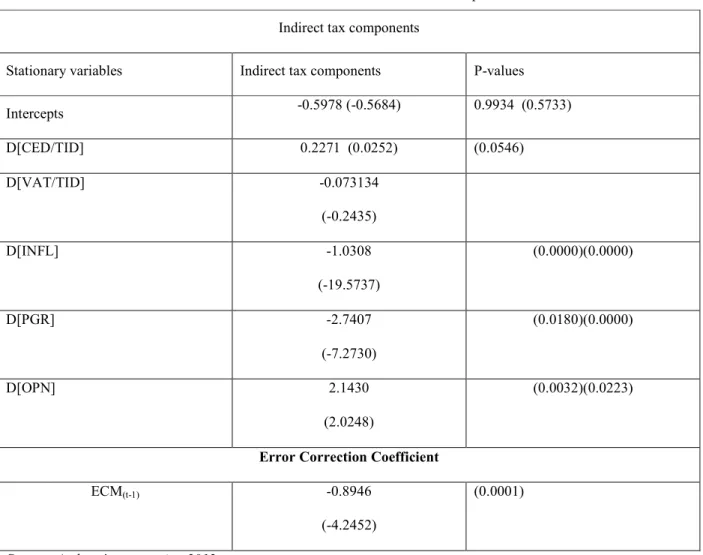
Table IV: Results of Error Correction Estimates of Baseline Equations for GDPGR Indirect tax components
Stationary variables Indirect tax components P-values
Intercepts -0.5978 (-0.5684) 0.9934 (0.5733) D[CED/TID] 0.2271 (0.0252) (0.0546) D[VAT/TID] -0.073134 (-0.2435) D[INFL] -1.0308 (-19.5737) (0.0000)(0.0000) D[PGR] -2.7407 (-7.2730) (0.0180)(0.0000) D[OPN] 2.1430 (2.0248) (0.0032)(0.0223)
Error Correction Coefficient
ECM(t-1) -0.8946
(-4.2452)
(0.0001)
Source: Authors’ computation 2012.
As mentioned earlier, the baseline regression was promised on the need to minimize the risk of multicollinearity. The significant variables in the model include the ratio of custom and excise duties to total indirect tax (which reported a t-value of 2.0252 at the 5% level of significance); inflation (with a t-value of -19.5737 at the 1% level of significance); population growth (with a t-value of -7.2730 at the 1% level of significance); and openness (which reported a t-value of 2.0248 at the 1% level of significance). In effect, the ratio of value added tax to total indirect tax failed the test of statistical significance having reported an infinitesimally small and negative coefficient of (-0.073134) and insignificant t-value of (-0.2435). The VAT coefficient is not only insignificant but also negative, indicative of adverse effect on consumption. Such insignificance could be attributed to the fact that not all goods and services are included in the Value Added Tax scheme. For example, exported goods, medical and pharmaceutical products etc are not included in the Nigerian VAT system. The results are significantly impressive considering the goodness-of-fit as measured by the adjusted R-squared value of 92.5%. This indicates that almost total variations in the growth rate of gross domestic output is explained by the explanatory variables. The coefficient of the error correction is negative as expected and above all, the error correction term has a coefficient of (0.8946) which is substantially close to (1.00). In essence, 89.46% adjustment is covered over a period of one year. This indeed suggests rapid adjustment in the system. Without a doubt, any short run disturbance in the growth rate of national income will instantaneously be restored in full force. Accordingly, convergence to equilibrium in the long run will be speedy. This outcome points to the fact that restoration to equilibrium will be certain in the long run whenever a temporary disequilibrium occurs in the system.
79
Table V: Robust Error Correction Estimates of the Impact of Taxation on Economic Growth in Nigeria
Explanatory Variables Dependent Variable: D[GDPGR]
Estimation 1 Estimation 2 Estimation 3
Intercept -0.3043 (-0.3881) -0.0992 (-0.1132) -0.2219 (-0.3033)
Indirect Tax Component(s)
D[CED/TID] 0.2542** (2.1839) 0.1502 (1.2206) 0.1229 (1.0843) D[TID/T] -0.0599 (-0.5817) Control Variable(s) D[INFL] -1.2612*** (-22.6672) -2.0573*** (-34.9310) -1.0826*** (-18.5428) D[PGR] 2.4011*** (5.975) 2.0618*** (3.8359) 2.3835 (1.1284) D[OPN] 1.1047*** (17.4521) 1.0799*** (16.5641) 1.1244*** (15.7763) D[I/Y] 1.1716*** (5.0481) D[
∆
L/L] -0.2437 (-1.4544) D[TTTR/TFR] 2.0886*** (19.9276)Error Correction Coefficient
ECM(t-1) -0.7265*** (-3.2995) -0.7956*** (-3.4007) -0.8068*** (-3.6704)
Source: Authors’ computation 2012.
Table V above presents the robust error correction estimates of the impact of indirect tax on economic growth. Estimation 1 comprises of only the ratio of custom and excise duties to total indirect tax (the only significant component from the baseline regression) and some control variables. Estimation 2 comprises of the significant
80
components of indirect tax in estimation one and the ratio of total indirect tax to total tax revenue and the control variables. Estimation 3 gives estimates of the significant components of indirect tax (CED/TID) expanded vector of the control variables and the ratio of total tax revenue to total federal revenue.
The coefficient of error correction in all the estimates shows that 72.65%, 79.56% and 80.68% respectively of the total disequilibrium from the long run growth of real output is corrected for within one year. The t-ratios of the one year lagged values of the ECM are all statistically significant and negative (-3.2995, -3.4007 and -3.6704). This confirms the good fit and hence adequate adjustment between the short run and long run of the disequilibrium of GDP growth rate.
Discussion of Findings
The diagnostic tests results are reported in table I above. The baseline and the three different robust estimates rejected the alternatives of non-normality, heteroskedecity and serial correlated residuals. In effect, the residuals are well behaved and obeyed the Gaussian distribution. Specifically, the DW statistics as reported above approximates to 2. Which slows the absence of auto correlated residuals. The result of the Arch test shows that the statistic calculated are all less than 3.84 (5%) chi-square critical value. This shows that the error variance are not serially correlated In the baseline regression analysis, the variables that sustained significance are the ratio of custom and excise duties to total indirect tax, with a value of 2.0252 at the 5% significance level, inflation, population, openness with t-values of -19.5737, -7.2730 and 2.0248 at the 1% significant levels respectively. The ratio of value added tax to total indirect tax failed the test of statistical significance having reported an infinitesimally small and negative tvalue of -0.2435. since the ratio of value added tax to total indirect tax could not sustain significance, it was dropped from the robust estimates.
The robust model consist of three estimates. The first estimate utilised the significant components of indirect tax (ratio of custom and excise duties to total indirect tax) and explanatory variables. The second estimate integrated the ratio of total indirect tax to total tax revenue to estimation 1. While the third estimate integrate expanded explanatory variables to estimation 2.
The most interesting finding of this study is that indirect tax was found to have a negative and insignificant relationship with real economic growth rate in Nigeria. In the result of the robust estimation 2 as represented in table IV above, the ratio of total indirect tax to total tax revenue reported a negative coefficient of (-0.0599) and an insignificant negative t-value of (-0.5817). Hence, the null hypothesis of no significant relationship between indirect tax and economic growth in Nigeria was accepted. The result differ from those of (Kneller et al, 1999; Arisoy and Unlukaplan, 2010; Scarlet, 2011 and Bird, 2003), which found a positive relationship between indirect tax and economic growth. It is however consistent with the studies done by Herberger, (1964), Emran and Stiglitz, (2005); Poferba et al, (1986); Madsen and Damania, (1986); Greenidge and Drakes (2009); Musanga, (2007) which found no significance or negative and insignificant relationship between indirect tax and economic growth
In addition to the above, population growth rate could not sustain significance in the 3rd robust estimate since it displayed a t-value of 1.1284 which is below the conservative estimate. From the result, it was established that population growth has an insignificant impact on economic growth in Nigeria.
The secondary school enrolment rate was found to have an insignificant and negative relationship with economic growth in Nigeria. As reported in table V above, the secondary school enrolment rate presented a t-value of (-1.4544) and was found to be negative and insignificant.
The investment to GDP ratio and the ratio of total tax revenue to total federal revenue passed the significance test at the 1% level of significance with t-value of (5.0481) and (19.9276) respectively.
SUMMARY OF FINDINGS, CONCLUSION, AND RECOMMENDATIONS Summary of Research Findings.
The main thrust of this study is to investigate the relationship between indirect tax and economic growth in Nigeria. The following findings were established from the study:
a. The ratio of total indirect tax to total tax revenue was found to have a negative and insignificant impact on economic growth in Nigeria. The variable reported a t-value of 0.587) and a negative coefficient of (-0.0599).
81
b. Population growth was found to have a positive but insignificant impact on economic growth in Nigeria, having reported a t-value of (1.284) and a positive coefficient of (2.3835).
c. The secondary school enrolment rate was found to have an insignificant and negative impact on economic growth having reported a t-value of (-1.4544) and negative coefficient of (-0.2437).
d. The investment to GDP ratio reported a positive t-value of (5.0481) and a coefficient of (1.1716).
e. The ratio of total tax to total federal revenue reported a robust t-value of (19.9276) and a positive coefficient of (2.0886) at the 1% level of significance.
Conclusion:
This study investigated the relationship between indirect tax and economic growth in Nigeria. The motivation for this study was primarily premised on the paucity of empirical literature on the indirect tax – growth dynamics in developing economies and the inconsistency of empirics on the issue in the developed economies of Europe and America.
The framework for the analysis of this study is the endogenous growth model which found a steady state relationship between taxation and economic growth as substantiated by the positive and significant impact of the ratio of total tax revenue to total federal revenue on economic growth, which presented a robust t-value of 19.9297. In addition to the above, it was established that the indirect component of taxation has a negative and insignificant impact on economic growth in Nigeria. While this finding is unexpected considering the global drift from direct to indirect tax, it is however strengthened by some existing empirics.
This study among other contributions, has helped to close the knowledge gap arising from the paucity of empirics which addresses Nigeria as a reference point. To the best of our knowledge, this may be the first attempt to test the effect of the ratio of total indirect tax to total tax revenue on economic growth in Nigeria. While some existing studies have focused on the impact of the subcomponents of indirect tax on economic growth, to our knowledge, no study has taken a wholistic view of the relationship between the indirect component of taxation and economic growth. The current study is limited by the micronumerousity of one of the subcomponents of taxation (VAT) which may have accounted for the poor result.
Recommendations
The findings of this research contradicts the federal government position on the New National Tax Policy which emphasises indirect taxation. The global drift from direct to indirect taxation seems to suffer empirical justification in Nigeria. As such, this study is advocating that:
The monoproduct economy of Nigeria should be diversified along the line of taxation since there exist a positive relationship between taxation and economic growth in Nigeria. In addition, the drift from direct to indirect form of taxation as entrenched in the New National tax policy should be deemphasised as there exists a negative and insignificant relationship between indirect tax and economic growth in Nigeria.
Finally, since openness is found to have a significant and positive impact on economic growth in Nigeria, all existing trade barriers should be dismantled to enhance full liberalisation in line with the concept of globalisatio
References
Aamir, M., Qayyum, A., Nasir, A., Hussain, S., Khan, K. I., & Butt, S.(2011). Determinants of tax revenue: Comparative study of direct taxes and indirect taxes of Pakistan and India. InternationalJournal of business and social sciences,2 (18),171-178.
Akpokodge, G .(2000). The effects of export earnings fluctuation on capital formation in Nigeria; AERC Research paper, African Economic Research Consortium, Nairobi, Kenya.
Arisoy, I., & Unlukaplan, I. (2010). Tax composition and growth in Turkey: An empirical analysis. International Research Journal of Finance and Economics, 59, 51 – 61.
Atkinson, A. B., & Stiglitz, J. E. (1976). The Design of tax structure: Direct versus indirect taxation. Journal of Public Economics, 6, 55-75.
82
Cremer, H., Pestieau, P., & Rochet, J. C. (2001). Direct versus indirect tax: The design of the tax structure revisited.
International Economic Review, 42 (3), 781-799.
Dahlby, B. (2003). Restructuring the Canadian tax system by changing the mix of direct and indirect taxes. In H. G. Grubel, Tax Reform in Canada: Our Path to Greater Prosperity. Vancouver British Columbia Canada: The Fraser Institute, 77-108.
Ebosele, M and Adekoya, F (2012). Worries over great reliance on oil, neglect of real sector. The Guardian 29
(12,303), 2.
Emran S., & Stiglitz, J.(2005). On selective indirect tax reform in developing countries. Journal of Public Economics, 18, 599 –620.
Feder, G.(1982).On exports and economic growth. Journal of Development Economics ,12, 59-73.
Greenidge, K., & Drakes, L. (2009). Tax policy and macroeconomic activity in Barbados. http://www.central bank.org.bb.
Harberger, A. C. (1964). Taxation, resource allocation and welfare, in NBER’ and the Brookings Institution, The Role of Direct and Indirect Taxes in the Federal Reserved System. Princeton: Princeton University Press 25 – 75.
Jarque, C.M., & Bera, A.K. (1987). A test for normality of observations and regression residuals. International Statistical Review,55 (2), 16-172.
King, R.G., & Sergio, R. (1990). Public policy and economic growth: Developing neo-classical implications. Journal of Political Economy, 98 (5),126-150.
Kneller, R, Bleaney, M.F., & Gemmell, N. (1999). Fiscal policy and growth: Evidence from OECD countries.
Journal of Public Economics, 74, 171-190.
Koch, S.F, Schoeman, N.J., & Van -Tonder, J, J. (2005). Economic growth and the structure of taxes in South Africa: 1960-2002. South African Journal of Economics,73 (2), 190-210.
Levine, R., & Renelt, D. (1992). A sensitivity analysis of cross-country growth regressions. American Economic Review, 82 (4), 942-963.
Madsen, J., & Damania, D. (1996). The macroeconomic effects of switch from direct to indirect taxes: An Empirical Assessment. Scottish Journal of Political Economy, 43 (5), 566-578.
Martinez-Vazquez, J., Vulovic, V., & Lui, Y. (2009). Direct versus indirect taxation: Trends, theory and economic significance. International Studies Program Working Paper, 09 – 11, Georgia State University.
Musanga, B. (2007). Effects of taxation on economic growth (Uganda’s experience: 1987-2005) Unpublished misc qualitative economics. University of Makerere.
Okonjo-Iweala, N. (2012). Diversification of Nigeria economy. SundayPunch,18, (19), 685:57.
Poterba, J. M., Rotemberg, J. J., & Summers, L. H. (1986). A tax-based test for nominal rigidities. The American Economic Review 76 (4), 659-675.
Ram, R. (1986). Government size and economic growth: A new framework and some evidence from cross section and time series data. American Economic Review, 76, 191-203.

![Table V: Robust Error Correction Estimates of the Impact of Taxation on Economic Growth in Nigeria Explanatory Variables Dependent Variable: D[GDPGR]](https://thumb-us.123doks.com/thumbv2/123dok_us/1683057.2732096/10.892.98.795.192.1005/correction-estimates-taxation-economic-explanatory-variables-dependent-variable.webp)
