Facultad de Ciencias Económicas y Empresariales
TESIS DOCTORAL
Título de la tesis:
Essays on Tax Morale
Doctorando:
Aldo Ramírez Zamudio
Director:
Dr. Raúl López Pérez
Tutor:
Julián Moral Carcedo
Departamento Análisis Económico: Teoría Económica e Historia Económica
Agradecimientos
Primero, me gustaría agradecer a mi director de tesis Raúl López Pérez por todo el tiempo y esfuerzo dedicado a lo largo de estos años.
A nivel institucional he de agradecer al Instituto de Investigación de la Universidad de Lima por su apoyo financiero para los experimentos de la tesis y la invaluable ayuda de investigación de Deyvi Abanto de la Universidad de Lima.A los participantes del IV Congreso Anual de Economistas en Perú en agosto de 2017 y del Primer Congreso Internacional de Economía y Finanzas Conductuales en la Universidad de Lima en noviembre de 2018 por sus útiles comentarios y sugerencias. Por último, pero no menos importante, a Patricia Stuart y Alberto Tokeshi, ex Decana y Decano actual de la Facultad de Ciencias Empresariales y Económicas; así como a Jorge Medicina y Pedro Grados ex director y director actual de la carrera de Economía, de la Universidad de Lima, por su invaluable apoyo y aliento para culminar esta ardua tarea.
En el plano personal, agradecer a mi familia, cuyos miembros todos, me apoyaron directa o indirectamente para que esta tesis sea realidad.
Essays on Tax Morale By
Aldo Ramirez Zamudio
Submitted to the Department of Economics Analysis On July 16, 2019, in partial fulfillment of the
Requirements for the degree of Doctor of Philosophy
ABSTRACT: This thesis uses experiments and theory to explore “Tax Morale” which is the
broad concept that groups taxpayer’s non-pecuniary nor legally enforced reasons to give money to governments. I assume that giving is motivated by consequentialist norms, as well as conditional on (a) others’ behavior and (b) the person’s beliefs about how competent the public sector is, together with her/his support to the current government. The evidence from a lab experiment in Peru is in line with these hypotheses. Further, less people give zero if they are informed about (i) two specific government projects (a subway line and a children’s hospital) or (ii) that some well-known Olympic medalist pays punctually her taxes, according to public information released by the Peruvian tax Agency. The findings are arguably relevant to understand taxpayers’ non-selfish reasons to pay (or evade) their taxes and contribute to the recent literature on tax morale.
Thesis Supervisor: Raúl López Pérez
Title: Research fellow, Instituto de Políticas y Bienes Públicos, CSIC.
RESUMEN: Esta tesis se sustenta en un modelo teórico y experimentos para explorar lo que
se conoce como “Moral Fiscal”, es decir el amplio conjunto de razones no monetarias ni legales por las que las personas contribuyen voluntariamente con su pago de impuestos. Este trabajo sostiene que la contribución voluntaria es motivada por normas consecuencialistas, asimismo que resulta condicional a (a) el comportamiento de otros (b) las creencias acerca de qué tan competente es el sector público y/o su apoyo al actual gobierno. La evidencia obtenida de un experimento de laboratorio en el Perú está en consonancia con estas hipótesis. Además, menos personas dan cero si son informadas acerca de (i) dos proyectos específicos del gobierno (la línea 2 del metro de Lima y el nuevo Hospital del Niño) o (ii) que una muy conocida medallista olímpica paga puntualmente sus impuestos, según información pública difundida por la Agencia Tributaria de Perú. Los resultados son relevantes para entender las razones no egoístas de los contribuyentes para pagar (o evadir) impuestos, y contribuyen a la literatura más reciente sobre moral fiscal.
Table of contents
Introduction ... 8
Chapter 1. Tax compliance and tax morale ... 18
1.1 The Allingham-Sandmo Model: Basics ... 18
1.2 Evidence ... 21
1.3 Non deterrence arguments (Tax Morale) ... 30
1.3.1 Taxpayers’ satisfaction with the public goods funded with their taxes ... 31
1.3.2 Institutional setting,trust in government and perceptions of corruption ... 32
1.3.3 Social norms, intrinsic motivations and cultural characteristics ... 34
1.3.4 Peer-effects ... 37
1.3.5 Socio-demographic variables ... 39
1.3.6 Fairness, inequity aversion and “just world” perceptions ... 40
1.3.7 Some evidence on public policies’ proposals to improve tax compliance ... 42
1.3.8 Empirical evidence for Latin-America ... 44
Chapter 2. A utility model with norms ... 48
2.1 General setting ... 48
2.2 Fairness norms and remorse functions ... 49
2.3. Application: A toy model of tax compliance with norms ... 51
Chapter 3: Experimental evidence: Years 2016-2017 ... 54
3.1 Experimental design and procedures ... 54
3.2 Applying the model ... 57
3.3 Results analysis ... 59
3.4 The NGO treatment ... 72
3.5 What about altruism, warm-glow, and reciprocity? ... 74
Chapter 4. Two policy rules tested: The 2018 sessions ... 75
4.1 Summary of results ... 76
4.2 Determinants of the donations: A test of my predictions ... 77
4.3 What explains the differences across the 2018 treatments in donations? ... 82
Conclusions ... 86
Bibliography ... 91
List of tables
Chapter 1
Table 1: Estimated parameters of the A-S Model ... 22
Chapter 3 Table 2: Summary of behavioral predictions ... 59
Table 3: Descriptive statistics of each treatment and session ... 60
Table 4: Regression analysis of determinants of donation to government ... 63
Table 5: Regression analysis of the ‘shared-norms’ argument... 71
Table 6: Regression analysis of determinants of donation to NGO ... 73
Chapter 4 Table 7: Descriptive statistics of each treatment ... 76
Table 8: Regression analysis of determinants of donations ... 78
Table 9: Average and median responses in Parts 2 and 3 of the 2018 sessions, conditional on treatment ... 84
List of figures
Chapter 2
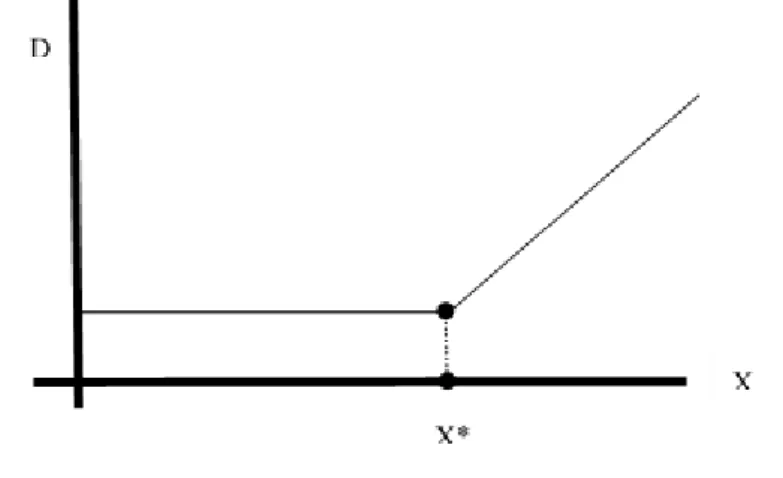
Figure 1: Determination of the optimal level of tax compliance ... 53
Chapter 3
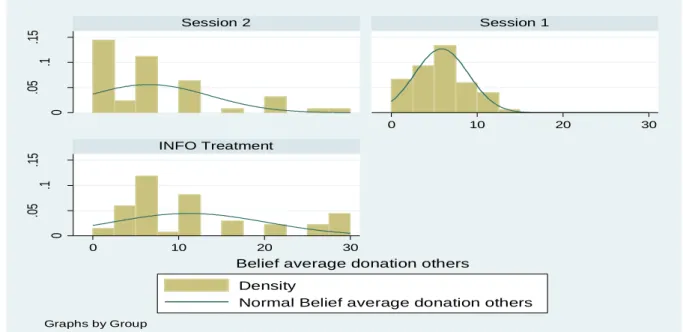
Figure 2: A non-linear relation between donation and X ... 65 Figure 3: The relation between donations and beliefs ... 67 Figure 4: Distribution of beliefs about average donation to government ... 69
Chapter 4
Introduction
People often contribute money to their governments, in its most prominent form, by paying taxes. Since enforcement cannot reach all taxpayers in any country, the question of why people voluntarily pay their taxes is a crucial one for economic research and public policy because taxes support most of public investment and expenditures around the world (Andreoni, Erard & Feinstein, 1998). Indeed, tax evasion has been an important research topic for many years, starting from the seminal paper by Allingham and Sandmo (1972), who adapted the Becker (1968) model of crime deterrence to study tax evasion. Their model assumes that taxpayers are standard economic agents focused on their own material interest and hence stresses dissuasion as the main reason behind tax compliance. In other words, people pay taxes if the expected punishment for evasion is large enough, that is, if the probability of detection and the ensuing material sanction are sufficiently high.
While the model by Allingham and Sandmo (1972) is remarkable for its parsimony, its empirical validity has been often contested (Alm, McClelland & Schulze, 1992; Andreoni et al., 1998; Frey, 2003; Luttmer & Singhal, 2014). In effect, since prevailing sanctions and detection probabilities around the world are arguably low, the model seems to be inconsistent with the relatively low levels of tax evasion observed in most developed economies (Alm et al, 1992; Torgler, 2002). In short, dissuasion cannot explain by itself the actual levels of voluntary tax compliance. This fact has caused the birth of an abundant literature that analyzes the importance of psychological and cultural elements to explain taxpayers’ behavior (Scholz & Witte, 1989; Alm & Jackson, 1993; Pommerehne & Weck-Hannemann, 1994; Feld and Frey, 2002; Torgler, 2002; Luttmer and Singhal, 2014; Mascagni, 2018; Alm, 2019).
These not-related-to-the-dissuasion arguments have been grouped under the ample concept of “Tax Morale”, which includes varied non-standard motivations like loss aversion, peer effects, reciprocity, and social norms, to name a few, but also cognitive aspects like biased perceptions, bounded rationality, and the application of mental heuristics. One of the appeals of a better understanding of these elements is that they might suggest ways to reduce tax evasion at a relatively low cost for the tax administration, which often has limited resources to pursue a very strict control strategy (for examples, see Del Carpio, 2014; Hallsworth, List, Metclafe & Vlaev, 2017).
Focusing on the motivational side, what drives citizens to comply with their tax obligations or more generally to contribute to their governments? This thesis offers some
insights on this point by means of a utility model of tax morale and data from a lab-in-the-field experiment. The model extends the approach in López-Pérez (2008) and makes two key hypotheses.1 First, there is a social norm that commends to act so as to maximize social welfare. If people deviate from this consequentialist norm, second, they suffer a utility cost that depends directly on (a) the magnitude of the deviation, i.e., the expected ‘harm’ or decrease in social welfare that the deviation causes and indirectly on (b) the average deviation among the reference group members (peer effects). These hypotheses are in line with ideas emphasized by previous studies. To start, (Slemrod, 2002; Fellner, Sausgruber & Traxler , 2013; Luttmer & Singhal, 2014; Alm, Bloomquist & Mckee, 2016) provide or review evidence on the importance of peer effects and social influences on tax compliance.2 These effects have also been observed in experimental lab studies on deception, of which false filing of tax forms is an instance; see (Gino, Ayal & Ariely, 2009; Fosgaard, Hansen & Piovesan, 2013; Innes & Mitra, 2013; López-Pérez & Spiegelman, 2013). In turn, the role of moral rules and long-run cultural effects reflecting internalized social norms has been also stressed by (Andreoni et al. 1998; Luttmer & Singhal, 2014; DeBacker et al. 2015; Dulleck et al. 2016).
In a nutshell, the model says that people contribute to their governments (e.g., paying some taxes) partly because they find that behavior correct or morally right, particularly if others do their part as well and the donation improves social welfare, which requires a relatively well-functioning government. A controlled test of this story seems difficult to implement in the field, e.g., observing actual tax compliance. In the field, on one hand, compliance might be affected by other factors like deterrence, social pressure, or the existence of a tax law stating how much one should contribute, possibly strongly expressing societal values ‒e.g., Sunstein, 1996.3 On the other hand, I claim that some specific beliefs affect contributions and compliance, and they can be hardly measured in the field in a non-obtrusive manner. For all these reasons, I decided to explore contributions in the lab, using a decision problem in which donations are anonymous, there are no sanctions, and formal laws have no say regarding how much one should donate.4
1 López-Pérez (2008); López-Pérez (2010) discuss in length the psychological underpinnings of the model. In addition, López-Pérez (2008) shows that the model can explain a large number of robust experimental facts, including some at odds with other models of non-selfish preferences like Rabin (1993) and Fehr and Schmidt (1999).
2 Similar to my assumption (b), Myles and Naylor (1996); Traxler (2010) develop models where a taxpayer’s utility depends on the share of tax evaders, so as to explain a number of phenomena that the standard model cannot account for. These models do not explicitly incorporate the other assumptions mentioned above.
3 In my account, people can give to their governments even if there is no law stating so. Note yet that this does not exclude the possibility that laws, acting as a salient signal of social norms, reinforce norm awareness, peer effects and hence giving.
4 Some readers may object that, because there is no formal obligation to give in my experiment, I can say little about tax compliance. I beg to differ: these findings show that people have motives to contribute voluntarily to the public good, conditional on some factors, and I can find no reason why such motives should be inoperative or
The experiment was run in Peru and is very simple: Each subject is endowed with 30 Soles (around $10) and can voluntarily and anonymously donate some of this endowment to the Peruvian government. Somehow surprising to me, a very substantial share of the subjects gives something (around ¾ of them). Moreover, giving is correlated with a number of variables, as predicted by the model. First, I elicit each subject’s beliefs about the average donation by other subjects and find it significantly correlated with her/his donation (peer effects). The reader might object that this could be due to a false consensus effect, so that subjects believe that others tend to donate as much as them –Ross, Greene, and House (1977). Evidence from a treatment in which reference beliefs are arguably fixed, however, suggests that beliefs causally affect donations. Second, I predict that giving will be correlated with the subject’s perceptions about how efficient and competent the government is. Intuitively, people would feel no remorse for not giving if they thought that most taxes are stolen or squandered. I ask subjects at least two questions that approximate those perceptions: (a) the ranking of Peru in the International Transparency index of corruption,5 and (b) the level of support of the current president. A regression analysis shows that donations to the government are significantly correlated with the responses to the second question. To my knowledge, I am the first to report controlled experimental evidence on this point. On the other hand, I do not find a correlation between donations and other variables like gender, political ideology, religiosity, age, income level, and education. Although correlation does not imply causation, the consistency of the model with the data seems remarkable, particularly given that other models of non-selfish preferences have problems to explain some of my findings (as I explain later). In an additional treatment where the donation recipient is a well-reputed NGO, finally, the average subject donates a similar amount as in the control treatment, and donations co-move as well with the subjects’ beliefs about the average donation by others.
In addition, I explore the potential effects of two policies that aim to increase giving to the government. In the Informed Policies (IP) treatment, the instructions mention two recent public projects in the city of Lima: The subway line 2 and the new Children’s Hospital. In line with the model, I conjecture that people are more willing to give if they are happy with the way
‘deactivated’ when there is compulsion –e.g., when people decide on paying their taxes. In this vein, neurological evidence suggests that both taxation and voluntary donations activate similar neural substrates: Harbaugh, Mayr and Burghart, (2007) show that both voluntary donations and mandatory tax-like transfers to a charity elicit activity in the same brain region associated with processing rewards.
5 Peru is a country with relatively high levels of perceived corruption. Indeed, in the International Transparency report of 2017, Peru has the 96th position out of 180 analyzed countries, worsening its position of the previous three years and below the regional average. On a different topic, I note that the public sector in Peru is relatively small, as government spending amounted to around 16.5% of total output (GDP) over the years 2014 to 2017 (source: Central Bank of Peru).
in which the government uses the money. Yet people can be sometimes unaware or not very well informed about government spending (I provide indeed evidence in this line). By giving information about two specific public projects, therefore, I expect a significant increase in median giving relative to the Control treatment, as it happens to be the case. In the Public Figure (PF) treatment, in turn, subjects receive instead information about a famous Peruvian Olympic medalist, noting that her firm pays its taxes punctually. In this respect, the model predicts that giving is conditional, that is, people give more if they expect others to give as well. More to the point, further, I conjecture that this conditionality depends on the identity of the agent’s referents. In particular, the example set by well-know and reputed public figures should have a relatively larger effect on giving than the example set by an average, random person.
While due caution is warranted in extrapolating the evidence to the realm of tax compliance, the data hence suggests that consequentialist norms affect tax evasion. As the subjects in the study, taxpayers might be willing to contribute (some) money to the government ‒e.g., voluntarily paying (part of) their taxes‒, particularly if they have relatively positive perceptions about its performance and believe that other taxpayers comply as well. It must be stressed that participants in this study were a representative sample of the population of taxpayers in Lima, and not just university students. Furthermore, the external validity of these results seems supported as well by previous survey evidence from Latin America –Torgler (2005) uses data sets from Latinobarómetro and the World Values Survey to analyze the determinants of tax morale in this region, and Ortega, Ronconi and Sanguinetti (2016) study citizens’ attitudes to tax obligations by means of surveys implemented in 17 cities of Latin America.6 On the other hand, these results are in line with the remarks by many researchers on tax compliance –e.g., Andreoni et al. (1998) reckon that citizens’ perceptions about government spending and level of corruption are relevant elements in understanding compliance.
This thesis is organized as follows. The first chapter reviews the standard neo-classical literature on tax evasion, starting on the Allingham and Sandmo model and its predictions, then I present some evidence on them along the years and across some countries; after that, I analyze the new literature under the ample concept of ‘Tax Morale’, linking any item I consider
6 Several Latinobarómetro reports also find that the payment of taxes has a high statistical relationship with the citizens’ perception that governments work for the well-being of all. It must be noted that such perceptions tend to be negative in most Latin American countries, particularly in Argentina, Dominican Republic and Peru. In this respect, while we find that Peruvian taxpayers differ in their willingness to give money to the government, our model also hints that, in a cross-country comparison, aggregate evasion will be relatively high in countries where the average or modal perception is negative, like Peru. Similarly, the model implies that the differences in the rates of tax evasion normally observed between developed and other economies are partly due to differences in these perceptions and peer effects.
important for the decision to contribute to government with the main ideas I will turn to hypotheses later.
In the second chapter I introduce a utility model with norms that will be tested later in chapters three and four. In this, I describe a norm, it means a formal mathematical definition of what (I claim) most agents consider important in their decision-making process, I also define a Social Welfare Function that will be useful to describe how utility is affected when a representative agent deviates from a specific binding and consequentialist norm, and finally, I set specific examples of norms and utility functions applied to the decision of contributing to governments in the form of tax payments. In the third chapter I present the results of my experimental evidence collected in the years 2016 and 2017 and test several predictions that follow from the model, specifically the importance of the agents’ beliefs about government’s competence and other people’s donations as explanatory variables for the decision to donate. In the fourth chapter I test two alternative policy rules designed for the 2018 sessions and whose objective is improving voluntary compliance. The first policy informs the subjects about two projects of public infrastructure actually developed by the central government in Lima, and the second one informs the subjects that a well-known and well-reputed public figure pays punctually its taxes. I also present the aggregate results, the theoretical predictions, and tests them with a regression analysis. The last section concludes with a discussion of the main contributions of this work.
Introducción
Las personas usualmente contribuyen monetariamente con sus gobiernos a través de su forma más común, el pago de impuestos. Puesto que la disuasión y el control no pueden alcanzar a todos los contribuyentes (cualquiera sea el país), la pregunta de por qué la gente paga voluntariamente sus impuestos es crucial para la investigación económica y el diseño de políticas públicas ya que los impuestos financian la mayoría del gasto y las inversiones públicas alrededor del mundo (Andreoni et al., 1998). De hecho, la evasión de impuestos ha sido un tema de investigación importante durante muchos años, sobre todo a partir del trabajo seminal de Allingham y Sandmo (1972), que adaptaron el modelo de la economía del crimen de Becker (1968) para el estudio de evasión fiscal. Su modelo supone que los contribuyentes son agentes económicos estándar centrados en su propio interés material y por lo tanto subraya a la disuasión como la razón principal detrás del cumplimiento tributario. En otras palabras, la gente paga impuestos si el castigo esperado por evadir es lo suficientemente grande, es decir, si la probabilidad de detección y la consiguiente sanción material son suficientemente altas.
Si bien el modelo de Allingham y Sandmo (1972) resulta notable por su claridad y simpleza, su validez empírica ha sido a menudo cuestionada (Alm et al., 1992; Andreoni et al., 1998; Frey, 2003; Luttmer y Singhal, 2014). En efecto, puesto que las sanciones vigentes y las probabilidades de detección alrededor del mundo son indiscutiblemente bajas, el modelo parece ser inconsistente con los niveles relativamente bajos de evasión observados en las economías más desarrolladas (Alm et al. 1992; Torgler, 2002). En resumen, la disuasión no puede explicar por sí misma los niveles reales de cumplimiento tributario voluntario. Este hecho ha provocado el nacimiento de una abundante literatura que analiza la importancia de elementos psicológicos y culturales para explicar el comportamiento de los contribuyentes (Scholz y Witte, 1989; Alm et al., 1993; Pommerehne et al., 1994; Feld y Frey, 2002; Torgler, 2002; Luttmer y Singhal, 2014, Mascagni, 2018, Alm, 2019)
Estos argumentos no-relacionados con la disuasión han sido agrupados bajo el amplio concepto de "Moral Fiscal", la que incluye variadas motivaciones no estándar como la aversión a las pérdidas, efectos de pares, reciprocidad y normas sociales, por nombrar a algunas, pero también aspectos cognitivos como prejuicios, racionalidad limitada y la aplicación de heurísticas mentales. Uno de los atractivos de una mejor comprensión de estos elementos es que puede sugerir formas de reducir la evasión a un costo relativamente bajo para la administración tributaria, la que a menudo tiene limitados recursos para desarrollar una
estrategia de control muy estricta (para ejemplos, véase Del Carpio, 2014 y Hallsworth et al., 2017).
Si nos concentramos en la parte motivacional podríamos preguntar: ¿Qué impulsa a los ciudadanos a cumplir con sus obligaciones fiscales, o más generalmente a contribuir con sus gobiernos? Esta tesis ofrece algunas hipótesis por medio de un modelo de utilidad que incluye la moral fiscal, y datos de un experimento de laboratorio semejante a un experimento de campo. El modelo extiende el de López Pérez (2008) y hace dos hipótesis principales. En primer lugar, existe una norma social que recomienda actuar con el fin de maximizar el bienestar social. Segundo, si las personas se desvían de esta norma consecuencialista sufren un costo en su utilidad que depende directamente de la magnitud de la desviación, es decir, del 'daño' esperado o de la disminución en el bienestar social que causa la desviación e indirectamente de (b) la desviación promedio entre los miembros del grupo de referencia (efecto de pares). Estas hipótesis están en línea con ideas de estudios anteriores. Por ejemplo, Slemrod (2002), Fellner et al., (2013), Luttmer y Singhal (2014) y Alm et al (2016), proporcionan evidencia sobre la importancia de los efectos de pares y las influencias de tipo social en el cumplimiento tributario. Estos efectos también se han observado en estudios de laboratorio experimental acerca del engaño, del que la evasión de impuestos es un componente; Ver por ejemplo Gino et al (2009), Fosgaard et al., (2013), Innes y Mitra (2013) y López-Pérez y Spiegelman (2013). A su vez, el papel de las reglas morales y efectos culturales de largo plazo que reflejan las normas sociales internalizadas ha sido destacado también por Andreoni et al (1998), Luttmer y Singhal (2014), DeBacker et al., (2015) y Dulleck et al (2016).
En resumen, el modelo dice que las personas contribuyen con sus gobiernos (por ejemplo, pagando impuestos) en parte porque encuentran ese comportamiento correcto o moralmente justo, particularmente si otros también lo hacen y si perciben que su contribución mejora el bienestar social, lo que requiere un gobierno que funciona con al menos relativa eficiencia. Parece muy difícil realizar en el campo una prueba controlada acerca de esta proposición, por ejemplo, observando el cumplimiento tributario real. Precisamente, en el campo, el cumplimiento podría verse afectado por otros factores como la disuasión, la presión social o la existencia de una ley tributaria indicando cuánto debe uno contribuir. Por lo tanto, puedo asegurar que algunas creencias específicas sí afectan el cumplimiento, y estas no pueden ser medidas en el campo de una manera no intrusiva. Por estas razones decidí explorar el cumplimiento en el laboratorio, usando un problema de decisión en el que las contribuciones son anónimas, no existen sanciones, ni tampoco leyes formales que digan cuánto se debe contribuir.
El experimento se realizó en Perú y es muy sencillo: cada sujeto recibe una dotación inicial de 30 Soles (alrededor de $10) y puede voluntariamente y de forma anónima entregar una parte de esta dotación al gobierno peruano. Sorprendentemente, un porcentaje muy importante de los sujetos contribuye positivamente (alrededor de 3/4 de ellos). Más aún, la contribución se correlaciona con una serie de variables tal como predice el modelo. Primero, se recogen las creencias de cada sujeto sobre la contribución promedio de los otros sujetos y se encuentra que estas se correlacionan significativamente con su propia contribución (efecto de pares). El lector podría objetar que esto podría deberse a un “falso consenso”, de tal manera que los sujetos creen que otros tienden a dar tanto como ellos – Ross, Greene y House (1977). Sin embargo, la evidencia de un tratamiento en que las creencias de referencia se encuentran fijas nos sugiere que estas si afectan causalmente a las contribuciones. En segundo lugar, el modelo predice que las contribuciones se correlacionarán con las percepciones del sujeto sobre cuán eficiente y competente es el gobierno. Intuitivamente, la gente no sentiría ningún remordimiento por no dar si piensa que los impuestos se apropian ilícitamente por funcionarios deshonestos o que serán desperdiciados. A los sujetos se les formula dos preguntas que aproximan estas percepciones: (a) la clasificación de Perú en el índice de corrupción de Transparencia Internacional y (b) el nivel de apoyo al actual presidente. Análisis de regresión muestran que las contribuciones al gobierno se correlacionan significativamente con las respuestas a la segunda pregunta. Según mi conocimiento, este es el primer trabajo en informar evidencia experimental controlada sobre este punto. Por otro lado, no se encuentra correlación entre las contribuciones y otras variables como género, ideología política, religiosidad, edad, nivel de ingresos y educación. Cabe señalar que, aunque la correlación no implica causalidad, la consistencia del modelo con los datos parece notable, especialmente teniendo en cuenta que otros modelos de preferencias no egoístas tienen problemas para explicar algunas de mis conclusiones (tal como explico más adelante). Adicionalmente, en un tratamiento en el que el destinatario de la contribución es una ONG de buena reputación, el sujeto promedio da una cantidad similar a la del grupo de control, y las contribuciones también se mueven conjuntamente a las creencias de los sujetos acerca de la contribución media de los otros sujetos. Por último, esta tesis explora los efectos potenciales de dos reglas de política que pretenden aumentar las contribuciones voluntarias al gobierno. En el tratamiento de políticas de información (IP), las instrucciones mencionan dos recientes proyectos públicos en la ciudad de Lima: la línea 2 del metro y el nuevo Hospital del Niño. En consonancia con el modelo, conjeturo que las personas están más dispuestas a contribuir si se encuentran satisfechas con la manera en que el gobierno utiliza el dinero. De hecho, la gente puede ignorar o no estar muy
bien informada sobre el gasto del gobierno (proporciono evidencia en esta línea). Por lo tanto, dando información acerca de dos proyectos públicos específicos, se espera un aumento significativo en la mediana de la contribución en relación con el grupo de Control, lo que se comprueba finalmente. De manera similar, en un tratamiento llamado de figura pública (PF), los sujetos reciben información sobre una famosa medallista olímpica peruana, señalando que su empresa paga puntualmente sus impuestos. En este sentido, el modelo predice que la contribución es condicional, es decir la gente da más si espera que otros den también. Además, el modelo predice que esta condicionalidad depende del referente del sujeto. En particular, reputadas figuras públicas deberían tener un efecto relativamente más grande en la contribución que una persona promedio, al azar.
Aunque debemos ser cautos en la extrapolación de la evidencia para el sistema tributario en general, los datos sugieren que las normas consecuencialistas afectan el cumplimiento. Es decir, los contribuyentes podrían estar dispuestos a contribuir, por ejemplo, pagando voluntariamente (parte de) sus impuestos, particularmente si perciben como relativamente positivo el desempeño del gobierno y si creen que los otros contribuyentes también cumplen. Debe destacarse que en este estudio participó una muestra representativa de la población de contribuyentes en Lima y no estudiantes universitarios. Además, la validez externa de estos resultados parece apoyada por evidencia anterior sobre América Latina recogida por encuestas, por ejemplo, Torgler (2005) quien utiliza conjuntos de datos de Latinobarómetro y la Encuesta Mundial de Valores para analizar los determinantes de la moral fiscal en esta región, y Ortega y otros (2016) quienes estudian las actitudes de los ciudadanos hacia las obligaciones tributarias por medio de encuestas en 17 ciudades de Latinoamérica. Por otra parte, estos resultados están también en consonancia con las observaciones de muchos investigadores sobre cumplimiento tributario, por ejemplo, Andreoni y otros (1998) quienes consideran que las percepciones de los ciudadanos sobre el gasto del gobierno y el nivel de corrupción son elementos relevantes en la comprensión del fenómeno del cumplimiento.
Esta tesis está organizada de la siguiente manera. El primer capítulo repasa la literatura neoclásica estándar en evasión de impuestos a partir del modelo de Allingham y Sandmo y sus predicciones. A continuación, presento evidencia recogida a lo largo de los años y en varios países. Después, analizo la literatura bajo el nuevo y amplio concepto de 'Moral Fiscal', teniendo en cuenta cualquier elemento que considero importante para la decisión de contribuir al gobierno en relación con las hipótesis que se presentan más adelante.
En el segundo capítulo introduzco un modelo de utilidad con normas sociales que se someterá a comprobación más adelante en los capítulos tres y cuatro. En este sentido, describo
una norma, es decir una definición matemática formal de lo que la mayoría de los agentes considera importante en su proceso de toma de decisiones, también defino una función de Bienestar Social que será útil para describir cómo se afecta la utilidad cuando un agente representativo se desvía de una norma específica, y también, lo que se entiende por “Norma Consecuencialista”, finalmente, proporciono ejemplos específicos de las normas y funciones de utilidad aplicadas a la decisión de contribuir a los gobiernos en la forma de pago de impuestos. En el tercer capítulo presento los resultados de mis pruebas experimentales recogidas en los años 2016 y 2017 y pruebo varias predicciones que se derivan del modelo, específicamente la importancia de las creencias de los agentes sobre la competencia del gobierno y de las contribuciones de otras personas como variables explicativas de la decisión de contribuir. En el cuarto capítulo pruebo dos reglas de política alternativas diseñadas para las sesiones de 2018, y cuyo objetivo es mejorar el cumplimiento voluntario. La primera regla de política informa a los sujetos acerca de dos proyectos de infraestructura pública desarrollados por el gobierno central en Lima y la segunda informa a los sujetos que una figura pública muy conocida y de buena reputación paga puntualmente sus impuestos. También presento los resultados agregados, las predicciones teóricas y pruebas con análisis de regresiones. La última sección concluye con una discusión de las principales aportaciones de este trabajo.
Chapter 1 Tax compliance and tax morale
The modern economic literature on tax compliance starts with the paper by Allingham and Sandmo (1972, A-S henceforth) who adapted the Becker (1968) model of crime deterrence to study tax evasion. For some years after, much of the literature explored in detail the A-S model and provided some interesting extensions, although fundamentally keeping its neo-classical spirit7. In the first section of this chapter, I explore several basic predictions of the A-S model. Afterwards, I discuss the (sometimes limited) empirical relevance of this model, and I argue how the introduction of tax morale elements might significantly improve its relevance.
1.1 The Allingham-Sandmo Model: Basics
In the A-S model, W is the taxpayer’s exogenous income, known by the taxpayer but not by the government, 𝜃 is the tax rate on declared income X (the taxpayer’s decision variable), and hence
𝜃·X the amount of tax to pay. If the taxpayer chooses to fully declare then W = X. However, she may choose to report X < W evading an amount equal to W-X. The tax authority does not know the true income and sets an enforcement system described by a probability p to audit the taxpayer (0 ≤ p ≤ 1) and a penalty or fine µ8 for each dollar evaded, which is supposedly higher than 𝜃. If the tax authority catches an evader, it fully detects the true income, hence imposing a fine of µ·(W-X) dollars in addition to the evaded tax. The taxpayer chooses X so as to maximize
𝐸[𝑈] = (1 − 𝑝)𝑈(𝑊 − 𝜃𝑋) + 𝑝𝑈(𝑊 − 𝜃𝑋 − µ(𝑊 − 𝑋)) (1)
If we introduce:
𝑌 = 𝑊 − 𝜃𝑋
𝑍 = 𝑊 − 𝜃𝑋 − µ(𝑊 − 𝑋) (2)
The first order condition for an interior maximum of 𝐸[𝑈] is:
−𝜃(1 − 𝑝)𝑈′(𝑌) − (𝜃 − µ)𝑝𝑈′(𝑍) = 0 (3)
In turn, the second order derivative of (1) is called D, and equals:
7 A Von Neumann-Morgenstern utility function (linear, concave or quasi-concave) with consumption as the main argument (other variations include leisure but the results are very similar) and dissuasive policies (like audits and fines) as factors affecting (mostly reducing) utility.
8 The penalty rate µ (the punishment for evading) is usually a percentage of the undeclared income (W-X) and tax agencies usually collect the fine µ·(W-X) separately to the evaded tax θ.(W-X), but each one also includes interests from the due time of the obligation to the final payment date.
𝐷 = 𝜃2(1 − 𝑝)𝑈′′(𝑌) + (𝜃 − µ)2𝑝𝑈′′(𝑍)
(4) Note well that the sign of D is negative if U is concave, as it is assumed afterwards. To check for an interior solution, the marginal expected utility at X = 0 and X = W is evaluated. Given how Y and Z are defined, an interior solution requires that
𝜕𝐸[𝑈] 𝜕𝑋 𝑋=0 = −𝜃(1 − 𝑝)𝑈′(𝑊) − (𝜃 − µ)𝑝𝑈′(𝑊(1 − µ)) > 0 and 𝜕𝐸[𝑈] 𝜕𝑋 𝑋=𝑊 = −𝜃(1 − 𝑝)𝑈 ′(𝑊(1 − 𝜃)) − (𝜃 − µ)𝑝𝑈′(𝑊(1 − 𝜃)) < 0 And these two conditions can be respectively rewritten as
𝑝µ > 𝜃 [𝑝 + (1 − 𝑝) 𝑈′(𝑊)
𝑈′(𝑊(1 − 𝜃))] (5)
𝑝µ < 𝜃 (6)
Both (5) and (6) guarantee an interior solution. Condition (6) leads to the first, straightforward
Prediction 1: Ceteris paribus, a rational agent will choose to evade at least some part of her income (W-X > 0) if the expected fine per unit of undeclared income (𝑝µ) is less than the tax rate 𝜃.
A-S also explore the comparative statics of their model in terms of its main parameters. For this, they use the Arrow-Pratt Absolute (A) and Relative (R) risk aversion measures:
𝑅𝐴(𝑌) = −𝑈′′(𝑌)
𝑈′(𝑌); 𝑅𝑅(𝑌) = −
𝑈′′(𝑌) · 𝑌
𝑈′(𝑌) (7)
Then, they differentiate the first order condition (3) with respect to income W and obtain:
𝜕𝑋
𝜕𝑊=
1
𝐷[𝜃(1 − 𝑝)𝑈′′(𝑌) + (𝜃 − 𝜇)(1 − 𝜇)𝑝𝑈′′(𝑍)] (8)
Then, they substitute the first order condition (3) into (8) to get the following expression
𝜕𝑋 𝜕𝑊 = − 1 𝐷𝜃(1 − 𝑝) 𝑈′(𝑌) [− 𝑈′′(𝑌) 𝑈′(𝑌) + (1 − 𝜇) 𝑈′′(𝑍) 𝑈′(𝑍)] (9)
And simplifying with the definition of the absolute risk aversion measure in (7),
𝜕𝑋
𝜕𝑊 = −
1
𝐷𝜃(1 − 𝑝)𝑈′(𝑌)[𝑅𝐴(𝑌) − (1 − 𝜇)𝑅𝐴(𝑍)] (10)
If absolute risk aversion is decreasing, it follows that 𝑅𝐴(𝑌) < 𝑅𝐴(𝑍). Hence, the sign of expression (10) is positive only if the penalty rate is greater than one (𝜇 > 1). Since this is a
rather restrictive condition, A-S consider as well the sign of the derivative of the fraction of real income reported when income changes, to obtain
𝜕(𝑋/𝑊) 𝜕𝑊 = 1 𝑊2( 𝜕𝑋 𝜕𝑊𝑊 − 𝑋) (11)
Then they substitute (8) and (4) into (11) to obtain
𝜕(𝑋/𝑊) 𝜕𝑊 = 1 𝑊2 1 𝐷[𝜃(1 − 𝑝)𝑈′′(𝑌)𝑊 + (𝜃 − 𝜇)(1 − 𝜇)𝑝𝑈′′(𝑍)𝑊 − 𝜃2(1 − 𝑝)𝑈′′(𝑌)𝑋 − (𝜃 − 𝜇)2𝑝𝑈′′(𝑍)𝑋] (12)
A-S simplify this expression using the definitions of Z and Y in (2) and get:
𝜕(𝑋/𝑊) 𝜕𝑊 = 1 𝑊2 1 𝐷[𝜃(1 − 𝑝)𝑈′′(𝑌)𝑌 + (𝜃 − 𝜇)𝑝𝑈′′(𝑍)𝑍] (13)
Finally, they substitute the first-order condition (3) to have
𝜕 (𝑊)𝑋 𝜕𝑊 = − 1 𝑊2 1 𝐷𝜃(1 − 𝑝)𝑈′(𝑌)[𝑅𝑅(𝑌) − 𝑅𝑅(𝑍)] (14)
With this last expression it turns clear that when actual income varies, the fraction declared increases, stays constant or decreases depending respectively on whether relative risk aversion is an increasing, constant or decreasing function of income. This carries us to
Prediction 2: If the agent’s utility function exhibits a decreasing relative risk aversion to income, she will report a smaller fraction of her income (W) as it grows, thus increasing the amount evaded W-X.
In order to explore the effect on reported income X of the other parameters of the model, A-S differentiates F.O.C. (3) with respect to the tax rate 𝜃, and use the definitions of risk aversion in (7) to obtain: 𝜕𝑋 𝜕𝜃 = 1 𝐷𝑋𝜃(1 − 𝑝)𝑈′(𝑌)[𝑅𝐴(𝑌) − 𝑅𝐴(𝑍)] + 1 𝐷[(1 − 𝑝)𝑈′(𝑌) + 𝑝𝑈′(𝑍)] (15)
A-S point out that the first term on the right side of (15) is an income effect that is positive: In effect, an increased tax rate 𝜃 makes the taxpayer less wealthy (Y and Z decrease for any level of X), and if relative risk aversion is decreasing, it would reduce evasion (W-X). The second term is a substitution effect which is negative because an increase in the tax rate 𝜃 makes it more profitable to evade taxes on the margin. The following prediction summarizes the prior discussion.
Prediction 3: The effect of an increase in the tax rate 𝜃 on evasion is ambiguous and
ultimately depends on the predominance of the income or the substitution effect it produces. In a similar fashion, differentiating as well the F.O.C. (3) with respect to the penalty rate 𝜇, I obtain:
𝜕𝑋 𝜕𝜇 = − 1 𝐷(𝑊 − 𝑋)(𝜃 − 𝜇)𝑝𝑈′′(𝑍) − 1 𝐷𝑝𝑈′(𝑍) (16)
And point out that both terms in the expression are positive which implies
Prediction 4: An increase in the penalty rate 𝜇 will always increase the fraction of actual income declared 𝑋, thus reducing evasion.
Finally, A-S explore whether more inspections (audits) increase compliance or not by deriving first order condition (3) with respect to 𝑝:
𝜕𝑋
𝜕𝑝 =
1
𝐷[−𝜃𝑈′(𝑌) + (𝜃 − 𝜇)𝑈′(𝑍) (17)
Since this derivative is positive, the following result is direct
Prediction 5: An increase in the probability of detection 𝑝 will always lead to a larger income being declared, reducing evasion.
In summary, unambiguous results can be derived for the two parameters of the model which are of particular interest for policy purposes, i.e., the penalty rate 𝜇 and the probability of detection 𝑝.
1.2 Evidence
In the early 1980s, an abundant data set was prepared and released to the public by the United States Tax Authority (the Internal Revenue Service ‘IRS’). This information was obtained from the 1969 Taxpayer Compliance Measurement Program (TCMP) and included estimates of the voluntary compliance rate by audit class9 and aggregate data on numerous taxpayer characteristics. In this program, taxpayers were randomly selected for thorough audits and this real information, together with similar data coming from other countries, allowed researchers to test economic theories of noncompliance in the following years.
Please notice that most empirical works testing the A-S model refer to the personal income tax as it is the main focus of the model. In what follows, I discuss each of the predictions above mentioned in the light of this evidence.
Prediction 1: Tax evasion is expected if the expected tax payment on undeclared income or expected penalty (𝑝𝜇) is smaller than the tax rate 𝜃.
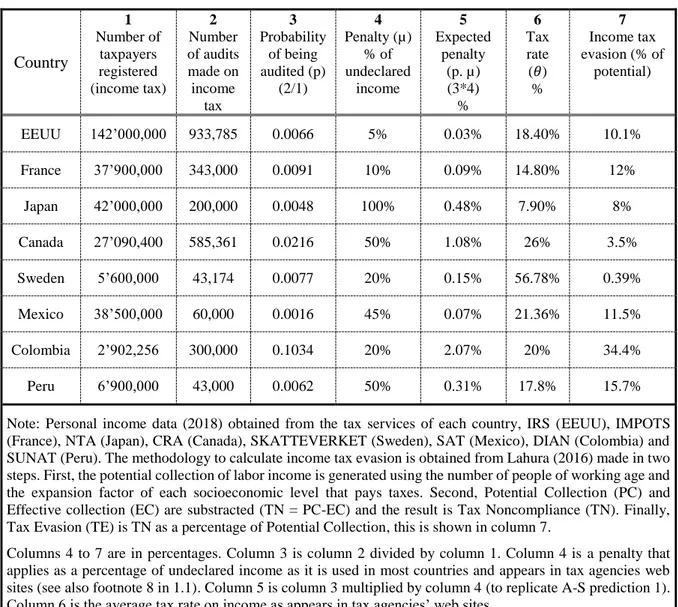
For some preliminarydiscussion on this point, Table 1 depicts average values for some parameters of the A-S model in some OECD and Latin American countries. Note that this table
refers, as well as the A-S model, to personal income tax and all calculations were made with the information available at the tax agencies of each country.10
Country 1 Number of taxpayers registered (income tax) 2 Number of audits made on income tax 3 Probability of being audited (p) (2/1) 4 Penalty (µ) % of undeclared income 5 Expected penalty (p. µ) (3*4) % 6 Tax rate (𝜃) % 7 Income tax evasion (% of potential) EEUU 142’000,000 933,785 0.0066 5% 0.03% 18.40% 10.1% France 37’900,000 343,000 0.0091 10% 0.09% 14.80% 12% Japan 42’000,000 200,000 0.0048 100% 0.48% 7.90% 8% Canada 27’090,400 585,361 0.0216 50% 1.08% 26% 3.5% Sweden 5’600,000 43,174 0.0077 20% 0.15% 56.78% 0.39% Mexico 38’500,000 60,000 0.0016 45% 0.07% 21.36% 11.5% Colombia 2’902,256 300,000 0.1034 20% 2.07% 20% 34.4% Peru 6’900,000 43,000 0.0062 50% 0.31% 17.8% 15.7%
Note: Personal income data (2018) obtained from the tax services of each country, IRS (EEUU), IMPOTS (France), NTA (Japan), CRA (Canada), SKATTEVERKET (Sweden), SAT (Mexico), DIAN (Colombia) and SUNAT (Peru). The methodology to calculate income tax evasion is obtained from Lahura (2016) made in two steps. First, the potential collection of labor income is generated using the number of people of working age and the expansion factor of each socioeconomic level that pays taxes. Second, Potential Collection (PC) and Effective collection (EC) are substracted (TN = PC-EC) and the result is Tax Noncompliance (TN). Finally, Tax Evasion (TE) is TN as a percentage of Potential Collection, this is shown in column 7.
Columns 4 to 7 are in percentages. Column 3 is column 2 divided by column 1. Column 4 is a penalty that applies as a percentage of undeclared income as it is used in most countries and appears in tax agencies web sites (see also footnote 8 in 1.1). Column 5 is column 3 multiplied by column 4 (to replicate A-S prediction 1). Column 6 is the average tax rate on income as appears in tax agencies’ web sites.
Table 1: Estimated parameters of the A-S Model
As we can observe, the A-S model would predict full (or positive) evasion for all countries in the table but the actual estimated rates of evasion in column 7 contradict that. Moreover, some of the data seems also problematic for the A-S model. For instance, Colombia shows approximately the same tax rate than Peru, but Peru has a tax evasion rate far lower than that of Colombia even though Colombia has an expected penalty far higher than that of Peru. More substantially, the estimated rates of tax evasion look too low, particularly taking into
10 A particular remark concerns the data in column 3 about the probability of being audited (p). Since p is an unconditional estimation, it is very likely to be an under-estimation of the actual one for many taxpayers, but also an over-estimation for those others subject to third party reports (by their employers), which are in many countries out of the scope of regular audits. In Peru, for instance, the tax agency audits only taxpayers who are partially subjected to third party reports or those who have other sources of income besides this one.
account that the estimated expected penalty is also rather low in all countries. This suggests that penalty rates are not so essential to deter evasion as predicted by the A-S model.11
A more precise discussion of this point requires considering the taxpayers’ degree of risk aversion, however. In one of the best attempts to test the A-S model’s predictions, Alm et. al. (1992) assume a standard concave utility function and derive predictions about the compliance rate. Using data from the United States, they find that a mid-range estimate of the coefficient of relative risk aversion (𝑅𝑅(𝑌) = 3) implies a rate of compliance of only 13 percent, well below any audit-based estimates of compliance for most forms of business income. In fact, their calibration suggests that the coefficient of relative risk aversion has to be quite high (𝑅𝑅(𝑌) = 5) to achieve 44 percent compliance and extraordinarily high (𝑅𝑅(𝑌) =
10) to achieve 71 percent compliance. In this line, Alm (2019) discusses some field evidence on the coefficient of relative risk aversion pointing out that there are a variety of estimation approaches, but most of them range between 1 and 2 and may even be as low as 0 (Friend & Blume, 1975; Hansen & Singleton, 1983; Hall, 1988; Chetty, 2006; Gandelman & Hernandez-Murillo, 2013). It follows that risk aversion in the A-S model must be abnormally large to explain actual observed choices, even in countries with lower levels of compliance.
Prediction 2: There is a positive relation between income and the evasion rate, provided that the agent’s utility function exhibits decreasing relative risk aversion.
Discussion: Clotfelters (1983) uses the TCMP data cited above to analyze the empirical
relationships among income, the marginal tax rate and evasion. He estimates a Tobit model in which the endogenous variable is evasion and the exogenous variables are the after-tax-income and the combined state and federal marginal tax rate (among other socioeconomic and demographic variables). In line with prediction 2, the author reports a positive and significant coefficient for the first variable (for both of them, in fact). Moreover, the elasticity of evasion with respect to income varies from 0.3 to above 3 as income increases.
However, a test of this prediction using field data presents a number of issues. One of them is that in the A-S model income is exogenous and therefore it is theoretically possible to obtain an effect of its variation in the amount reported, but in the real world tax authorities regularly use combined policy mechanisms to fight evasion which makes income endogenous and the analysis of pure income effects impossible to observe. In this line, Andreoni et. al.
11 Indeed, Sandmo (2005) points out that penalty rates are lower than tax rates in most places all around the world (Table 1 above) and nevertheless we do not see full evasion. He even offers an example in which the penalty rate 𝜇, ceteris paribus, is twice the regular tax rate θ and finds that only a probability of detection 𝑝 greater than 0.5 would be able to deter full evasion but that 𝑝 is far higher than that obtained by most empirical estimates all around the world (see also table 1 above).
(1998) remind some interesting attempts of making income endogenous by adding labor supply (see Pencavel, 1979; Cowell, 1981; Sandmo 1981). However, the effects of the enforcement tools simultaneously used turned to be all ambiguous. The authors suggest a possible explanation in which an increase in enforcement may reduce the effective wage rate that in turn may decrease labor supply and then income but if the labor supply curve is backward bending, more enforcement may increase the labor supply and decrease the amount reported (increasing evasion). In this same line, however, other studies found that individuals work more to increase earnings to cover probable audit’s losses causing in turn to also increase evasion (see Weiss, 1976). Moreover, they also find that other utility functions gave also ambiguous results when manipulating parameters and thus think that evasion appears to be better explained instead by the strategic interaction between the tax authority and taxpayers and not by the shape of the taxpayer’s utility function. Finally, they conclude that all the attempts to extend the A-S model under the rational-agent umbrella cannot explain why many people choose to comply when they may evade without legal punishment (the tax compliance puzzle) and therefore, the moral consequences of being untruthful or the social consequences of being known as a cheater would play a fundamental role to explain tax compliance.
Prediction 3: The effects of an increase in the tax rate 𝜃 on evasion are ambiguous depending ultimately on the income and substitution effects.
Discussion: Sandmo (2005) tries to solve the ambiguity between the income and substitution effects by including black labor market and leisure but his model cannot predict how the tax rate affects reported income. In contrast, Yitzhaki (1974) notes that this ambiguity is a consequence of the assumption that the taxpayer should pay a penalty rate µ on the undeclared income (𝑊 − 𝑋). Instead, he proposes a penalty or fine (F) to be imposed on the evaded tax 𝜃(𝑊 − 𝑥) and not income, as it is usual under the American or Israeli tax laws. This action rules out any ambiguity because in this specific case there is no substitution effect. Assuming decreasing relative risk aversion, he indeed proves that evasion decreases as the tax rate increases –see expression (15) above for some intuition in this regard.
Contrary to this, however, some empirical studies find that marginal tax rates do not have a significant effect on tax evasion. For example, Kleven, Knudsen, Kreiner, Pedersen and Saez (2011) run a tax enforcement field experiment in Denmark for a representative sample of over 40,000 individual income tax filers. In the base year, half of the taxpayers were randomly selected to be thoroughly audited, while the rest not and used as control. In the following year, threat-of-audit letters were randomly assigned and sent to tax filers in both groups. The authors define that pre-audit measurement includes the combined effect of tax avoidance and tax
evasion, post-audit involves the tax avoidance only, and the difference between them refers to the effect of tax evasion only. They then find that the pre-audit (both factors) elasticity is 0.16, the post-audit (tax avoidance) is 0.085 and the difference between the two (tax evasion) is 0.076 (which they identify as the substitution effect), all measures are statistically significant. Therefore, they conclude that the marginal tax rate has only a small positive substitution effect on tax evasion for taxpayers with mostly self-reported income, and third-party reporting turns to be much more important than low marginal tax rates to improve compliance.
Also, Porcano (1988) reports no effect of the tax rate on evasion and underreporting in his sample. Moreover, Park and Hyun (2003), whose work I will detail in the next prediction, find that an increase in 1% in the tax rate even decreases in 0.3954% the compliance rate. In contrast, Pommerehne and Weck-Hannemann (1996) present data from Switzerland, an interesting country for testing the A-S model because, according to the authors, its strong fiscal decentralization adds considerable variance in the potential determinants of tax evasion. They estimate a simultaneous equation system and find a significant positive impact of the marginal tax rate on evasion, in line with similar empirical findings by (Clotfelter, 1983; Witte & Woodbury, 1985; Alexander & Feinstein, 1987).
Prediction 4: There is a negative relationship betweenevasion and the penalty rate 𝜇 (a higher penalty rate produces a decrease in evasion)
Discussion: According to this prediction, if most taxpayers were risk-averse the tax authority would easily fight against evasion by raising µ sufficiently. On the same vein, the paper by Sandmo (2005) just cited shows that the effects of changes in the penalty rate 𝜇 and the probability of detection 𝑝 have the same signs as they have in the A–S model, in line with Prediction 4.
In an empirical work of this point, Park and Hyun (2003) use an asymmetric-information variation of the A-S model in which income is exogenously endowed and therefore, is known only by the individual taxpayer. They set a lab experiment with graduate students as subjects and the experiment consisted of nine sessions with 15 rounds each, all of them with different combinations of tax rates, audit rates, fine rates, absence/presence of public goods, and education on the importance of voluntary and honest tax payments. Thenthey exogenously assign different levels of income for different rounds in the same session, keeping the other parameters constant. All parameters are known by the subjects and each subject is, therefore, asked to report her income 135 times during the experiment. They also set three different levels of income tax rate at 10, 25, and 40% and three different levels of penalty rates 100, 300, and 500%. The audit probability also takes three different values of 6, 10, and 15%., and the subjects
of audits were chosen according to a Bernoulli random variable with the corresponding success probability. Finally, the distribution of income was assumed to have independent and normal distribution. They set a compliance rate (actual income/reported income) as a dependent variable, run a Tobit model and find that raising 1% the penalty rate produces an increase in 1.0467%, in the compliance rate but raising 1% the probability of audit increases compliance in only 0.4212%. They say that all estimates have the expected signs and also are statistically significant. They conclude that their most important finding is that the penalty rate has the bigger effect on compliance.
However, Andreoni et. al. (1998) remind that the penalty rate has never been so high in any country (see column 4 in Table 1 above), mostly because a very high penalty would produce bankruptcy making this prediction impossible to prove empirically in the field. It appears that the actual effect of the penalty rate on compliance is very difficult to prove in the field. Indeed, this rate is not as high in any country (mostly) for political reasons, and those works that have tested its effects have been made only theoretically or in laboratory and not having real taxpayers as subjects.
Prediction 5: An increase in the probability of detection 𝑝 will reduce evasion.
Discussion: Witte and Woodbury (1985) conducted one of the first regression modeling
studies on the topic published in the literature. They used the TCMP data cited above, made a random audit assumption, and found that higher probabilities of audits were associated with higher levels of compliance. This result however presents a number of issues. To start, the effects were lagged probably due to the consistency between changes in objective and perceived audit probabilities, even more, Dubin and Wilde (1988) suggest that Witte and Woodbury's model was wrongly specified since many of the tax agency variables are indeed endogenous including the audits that are not random but determined instead by taxpayer characteristics and IRS resources. Using the same TCMP data as Witte and Woodbury, they reported inconsistent results with respect to the deterrent effects of audits. Also, Beron, Tauchen and Witte (1988) use data from different sources in the mid 1970’s and estimate a three-equation model for taxpayers' reported income, tax liability and the probability of an audit. Even though they find that audits stimulate compliance, the effect was not large nor statistically significant.
In turn, Luttmer and Singhal (2014) remind that most tax authorities intentionally avoid disclosing information on their auditing and enforcement procedures making taxpayers to have incomplete information about true audit rates or penalties. For example, Scholz and Pinney (1995) use matched IRS-survey data from the United States and find that individuals report a subjective probability of being detected (conditional on underreporting income) far higher than
the actual IRS’ probability of audit. Moreover, they find that variations in actual audit probabilities by the tax authority do not influence this taxpayers’ process. In contrast, Del Carpio (2014) finds that Peruvian taxpayers apparently underestimate the probability of audit and disclosing its actual numbers would improve tax collection. She claims that a combination of a payment reminder and information about enforcement of property tax both increases perceived probability of audit and this results in increased tax compliance. However, the effects appear to be caused mainly by the payment reminder12. In this point, Luttmer and Singhal (2014) think that this finding instead suggests a failure of individual optimization due to bounded rationality rather than wrong perceptions about the probability of audit. They say that this is consistent with Hallsworth, List, Metcalfe, and Vlaev (2014), who also find a direct effect of payment reminders on UK taxpayers for similar reasons.
Sandmo (2005) also points out that 𝑝 is indeed the taxpayer’s subjective probability, which is not necessarily equal to the statistical frequency with which peoples’ tax returns are checked. He even mentions some empirical studies in which people tend to overestimate the probability of detection (See Andreoni et. al. 1998), then he claims that this overestimation would increase 𝑝 above observable audits/taxpayers ratios to high enough levels to make the A-S model’s predictions sound. He also mentions some studies based on surveys showing that people greatly overestimate the probability of being audited, e.g. (Scholz & Pinney, 1993).
Even though, if we assume that the probability of audit p is indeed the perceived one, its real impact on tax compliance appears to be rather weak according to more recent experimental evidence. For example, Blumenthal, Christian and Slemrod, (2001) run a field experiment in 1995 in which they randomly selected a ‘treatment group’ of 1724 Minnesota taxpayers, then they formed six sub-groups according to two variables, the first was the ‘income’ with three categories (low, middle and high); the second variable was the ‘opportunity to evade’ with two categories (high-opportunity: taxpayers who declared being small business or farm proprietors and thus were more difficult to be controlled by the tax authority; and the ‘rest of taxpayers’ for whom there exists more accurate information of their income). Then the experimenters send the treatment group’s subjects a letter saying that the returns they were about to fill would be ‘closely examined’. The authors used two years of data to make comparisons of changes in reported income, deductions, and tax liability between the treatment and the control group (those who did not receive this letter).
12 Indeed, it is worth noting that municipalities do not audit, but just collect the property tax (which is of a far simpler calculation than the income tax). Hence the message could act more as a payment reminder than as an audit warning.
After the experiment was done, both treatment and control increased their reported liabilities and the difference in differences13 was 2.5% higher for treatment. However, the main difference was found in the ‘low-income and high-opportunity’ sub-group with 14.2% higher for treatment but only a slight 2% for the ‘low-income and low-opportunity’ segment. For the ‘middle-income and high-opportunity’ sub-group the difference in differences was 4% higher in treatment and 3.2% in the ‘middle-income and low-opportunity’ sub-group but the difference was negative for the high-income segment (4.7% for the high-opportunity segment and 10.9% for the low-opportunity one). In general, even though there was an increase in the tax payments compared to the previous year (making possible the existence of previous noncompliance), the difference in differences was not statistically significant for the treatment group. As a result, the authors conclude that a threat of examination (increasing the perceived probability of audit) appears to increase the reported income and tax liability only of low- and middle-income taxpayers, especially those that have greater opportunities to evade taxes but the increased tax collections from this group are only less than 2% of total tax liability.
Additional evidence comes from Park and Hyun (2003), described above. In effect, when subjects know the parameters (e.g. the probability of audit/detection) the authors find a positive, significant, however modest effect of the probability of audit on compliance (elasticity is only 0.4212%, being that of the penalty rate far higher). On the same topic, Tan and Yim (2014) run a computerized experiment to test the introduction of a new auditing rule that creates strategic uncertainty among taxpayers. They consider two treatments: the first in which they introduce uncertainty by informing subjects of the maximum number of audits to be carried out (bounded rule), and the second in which, resembling what the A-S model implies, they inform the subjects about the exact audit probability (Flat rule). The authors claim that the bounded rule describes the actual auditing practice more realistically and also implies a game theoretic environment since the probability of being audited depends on the other taxpayers’ evasion decisions. Their results show that compliance levels are statistically the same between control and the flat rule treatment but improve significantly for the bounded rule one (even though the number of audits remains constant). The authors think that this happens because of the attraction of the safe strategy and uncertainty aversion. In this regard, Heinemann, Nagel, and Ockenfels (2009) provide evidence that people prefer a sure, safe outcome to a better but riskier one with a realized probability depending on the decisions of others. All these findings imply that even
with limited auditing resources, tax authorities would enhance the deterrence effect by revealing audit policies carefully to taxpayers.
Kleven et al (2011), whose study for 40,000 taxpayers in Denmark was mentioned above for prediction 3, find a positive effect of the threat-of-audit letters on the amounts and probabilities of self-reported adjustments to income and tax liability. For total net income, letters cause a change of 19% in the initial adjustments (in absolute value). Also, the probability of self-reported adjustment increases by 1.63 percentage points from a base of 13.37% (an increase of 12.2%), being these estimates strongly significant. Nevertheless, the quantitative magnitudes of the letter effects are modest compared to the effects of actual previous-year audits, which suggests that audit-threat letters create less variation in the perceived probability of detection than actual audit experiences. Thus, the authors conclude that analyzing concrete audits may be a more powerful way to understand the deterrence effect of enforcement than sending out letters.
Many first generation laboratory experiments varying audit probabilities found expected but low positive effects of audit rates on compliance (Spicer & Thomas, 1982; Mason & Calvin, 1978; Song & Yarbrough, 1978; Spicer & Lundstedt, 1976; Warneryd & Walerud, 1982). However, Fischer, Wartick and Mark (1992) claim that these experiments seem biased because instructions appeared to direct subjects to maximize income and ignore nonpecuniary factors that may encourage compliance in the real world, while those run afterwards and designed to better mask the purpose of the study found no consistent results (see e.g., Robben, Webley, Elffers & Hessing, 1990; Weigel, 1991). The authors point out that survey studies may be also biased towards a positive correlation between p and compliance because it is highly possible that individuals who evade tax are less likely to participate in the studies and on the contrary, compliance behavior of those who do participate surely causes a greater perceived probability of detection (the authors claim that those who are compliers tend to think that enforcement is higher, rather than the reverse).
On the other hand, some may think that the regression studies are more valid to analyze evasion because they are based on actual taxpayer compliance data. Nevertheless, these authors say that of the four regression studies they reviewed, two of them, contrary to what it is expected, provide evidence of a negative correlation between audit probability and compliance (Dubin, Graetz & Wilde, 1987; Dubin & Wilde, 1988), a third failed to detect a statistically significant relationship between these variables for half of the cases examined (Beron, Tauchen & Witte, 1992) and only the pioneer work of Witte and Woodbury (1985) appears to demonstrate a positive relationship between p and compliance (however, criticized by later