SmartD: Smart Meter Data Analytics Dashboard
∗Aylin Jarrah Nezhad, Tri Kurniawan Wijaya, Matteo Vasirani, and Karl Aberer
School of Computer and Communication Sciences École Polytechnique Fédérale de Lausanne (EPFL)
CH-1015 Lausanne, Switzerland
{aylin.jarrahnezhad, tri-kurniawan.wijaya, matteo.vasirani, karl.aberer}@epfl.ch
ABSTRACT
The ability of smart meters to communicate energy consumption data in (near) real-time enables data analytics for novel applica-tions, such as pervasive demand response, personalized energy feed-back, outage management, and theft detection. Smart meter data are characterized by big volume and big velocity, which make pro-cessing and analysis very challenging from a computational point of view. In this paper we presented SmartD, a dashboard that en-ables the data analyst to visualize smart meter data and estimate the typical load profile of new consumers according to different contexts, temporal aggregations and consumer segments.
Categories and Subject Descriptors
H.2.8 [Database Applications]: Data mining; G.3 [Probability and Statistics]: Time series analysis
Keywords
smart meters; visualization; energy consumption analysis
1. INTRODUCTION
Future ICT-based energy systems will rely on an Advanced Me-tering Infrastructure (AMI), a system that measures and collects data about energy usage and power quality using smart meters in-stalled at the consumer premises [5]. Smart meter data has an im-portant role in several Smart Grid applications and enables novel data analytics tasks, such as energy consumption behavior analysis, theft detection, outage management, pervasive demand response at residential level, and personalized energy feedback. However, pro-cessing and analyzing smart meters data is very challenging, be-cause it is characterized by big volume and big velocity, and how toextractuseful information from it is still an open question.1
∗Supported by European Union’s Seventh Framework Programme
(FP7/2007-2013) 288322, WATTALYST. The authors would like to thank Julien Eberle and Sofiane Sarni for the assistance with GSN.
1See Bryan Truex, ”Two Opposing Views on Smart Meter Data
Analytics”,http://bit.ly/LYADfH
Permission to make digital or hard copies of part or all of this work for personal or classroom use is granted without fee provided that copies are not made or distributed for profit or commercial advantage, and that copies bear this notice and the full ci-tation on the first page. Copyrights for third-party components of this work must be honored. For all other uses, contact the owner/author(s). Copyright is held by the author/owner(s).
e-Energy’14,June 11–13, 2014, Cambridge, United Kingdom ACM 978-1-4503-2819-7/14/06.
http://dx.doi.org/10.1145/2602044.2602046.
In this paper we present SmartD, a dashboard for smart meter data visualization and analysis. SmartD has been built to be (i) seamlessly integrated with existing data collection infrastructures, (ii) intuitive to use, and (iii) easy to extend. To visualize and an-alyze smart meter data, SmartD supports context selection (e.g., summer, winter, weekend, or weekdays), different temporal aggre-gations (e.g., hourly, daily, or weekly), and consumer selection (ei-ther individual or clusters of consumers). Although this function-ality is commonly found in other energy dashboard or time series visualization, SmartD’s additional and novel contributions are: (i) estimating the typical hourly load profiles based on demographic information, and (ii) determining the attributes of the demographic profile that are relevant to consumer’s energy consumption behav-ior for a given context. This functionality can be used to predict the typical load profile of new consumers, or to understand the en-ergy consumption behavior of different consumers (e.g., employed vs retired, family vs single).2
2. SMARTD
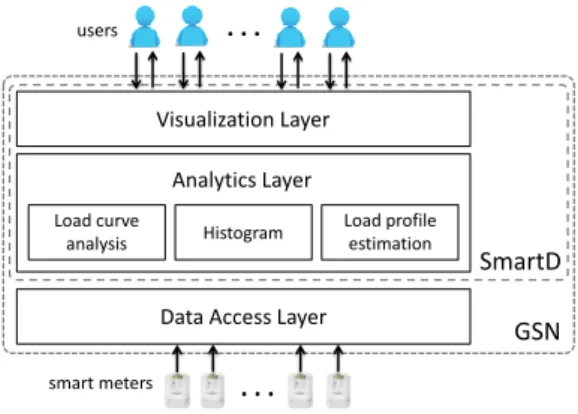
We developed SmartD on top of GSN [2], a widely used middle-ware for sensor networks deployment. Given that smart meters are essentially sensors, GSN can be seamlessly integrated with an ex-isting smart metering infrastructure, enabling applications running on GSN to receive real-time smart meter readings (push mode) as well as obtaining them from a DB or text files (pull mode). Figure 1 shows the architecture diagram of SmartD.
SmartD needs to be able to (i) retrieve and process smart meter data with big volume and velocity, and (ii) visualize and extract valuable information from that data. While the first capability is provided by GSN, we briefly explain the second in the following sections. We remark that although for demonstration purposes we use the Irish CER dataset [1]3, SmartD can be used with any time
series of smart meter data and consumer demographic profiles in the form of<attribute,value>tuples.
2.1 Energy Consumption Analysis
For the visualization of energy consumption data (see Figure 2), SmartD has several key features, detailed below.
Temporal aggregations.SmartD supports different time granular-ities, from half-hourly to monthly. In addition, a set of basic statis-tical aggregation functions is also provided, such as sum, average, min, and max.4
2We use the termsenergy consumptionandloadinterchangeably. 3This dataset contains measurements of approximately 5,000
con-sumers for 1.5 years (Jul 2009 - Dec 2010)
smart meters
Data Access Layer
. . . Visualization Layer Load curve analysis Histogram Load profile estimation Analytics Layer . . . users SmartD GSN
Figure 1: SmartD architecture diagram
Figure 2: Energy consumption analysis
Consumer aggregations. SmartD supports visualization of en-ergy consumption of a set of individual consumers, clusters of con-sumers, or a mix of both. We use a simple but flexible grammar
id (,id)|(;id)∗to specify the desired visualization, whereidis a consumer identifier, the character “;” separates clusters, and the character “,” separates consumers within a cluster. An individual consumer is then expressed as a cluster of one consumer. If a clus-ter of more than one consumer is specified, the users can choose the functions to aggregate the energy data within the cluster (such as sum, average, min, or max).
Consumer characterization.SmartD provides an option to focus more on consumer demand shape, by plotting z-normalized data. This functionality can be used, e.g., to spot consumers who have morning peak, evening peak, or both.
Histogram. SmartD provides a histogram view with the distribu-tion of energy consumpdistribu-tion values, which can be useful to analyze the way people consume energy. For example, we found that the energy consumption of residential consumers follows a log-normal distribution, peaked around their base load, while commercial and industrial consumers follows a normal distribution, peaked around the mean consumption of working hours.
2.2 Energy Consumption Estimation
SmartD supports data analysts by providing insights related to energy consumption behavior. First, it helps to answer questions about consumer load profile given her demographics, such aswhat is the difference between load profile of families with and with-out children?, orcan we estimate the typical load profile of a new consumer using her socio-demographic information?. SmartD es-timates the load profile of a consumer (see Figure 3), if provided with (a subset of) the consumer demographic information, as well as the context of interest (e.g., weekend, Monday, summer, etc.).
Figure 3: Energy consumption estimation
This is done usingk-nearest neighbor(k-NN), where the bestkis determined usingleave-one-out cross-validation.
Second, SmartD also helps to infer demographic information which significantly influence energy consumption on a specific con-text, e.g., weekend, Monday, or summer. This is implemented us-ing correlation-based feature selection [4] andk-NN, where the fea-tures are the demographic information and the target classes are the hourly consumption values. These learning functionalities is devel-oped using the WEKA machine learning library [3].
3. CONCLUSION
In this paper, we presented SmartD, a dashboard for smart meter data analysis and visualization developed on top of GSN. SmartD has been released as an open-source project.5 SmartD capabilities
include visualization of energy consumption data and estimation of the typical load profile of a consumer according to her demographic and contextual information. As future extensions, other function-alities such as customer segmentation [7], interpolation of missing values, and load forecasting [6], could be added.
4. REFERENCES
[1] Smart Metering Trial Data Publication. The Commission for Energy Regulation (CER), 2012.
[2] K. Aberer, M. Hauswirth, and A. Salehi. A Middleware for Fast and Flexible Sensor Network Deployment. In
Proceedings of the 32nd International Conference on Very Large Data Bases. VLDB Endowment, 2006.
[3] M. Hall, E. Frank, G. Holmes, B. Pfahringer, P. Reutemann, and I. H. Witten. The WEKA Data Mining Software: An Update.SIGKDD Explor. Newsl., 11(1):10–18, Nov. 2009. [4] M. A. Hall.Correlation-based Feature Subset Selection for
Machine Learning. PhD thesis, University of Waikato, Hamilton, New Zealand, 1998.
[5] D. Hart. Using AMI to Realize the Smart Grid. InPower and Energy Society General Meeting - Conversion and Delivery of Electrical Energy in the 21st Century, 2008 IEEE, pages 1–2, 2008.
[6] S. Humeau, T. K. Wijaya, M. Vasirani, and K. Aberer. Electricity Load Forecasting for Residential Customers: Exploiting Aggregation and Correlation between Households. InSustainable Internet and ICT for Sustainability (SustainIT), 2013, pages 1–6, Oct 2013.
[7] T. K. Wijaya, T. Ganu, D. Chakraborty, K. Aberer, and D. P. Seetharam. Consumer Segmentation and Knowledge Extraction from Smart Meter and Survey Data. InSIAM International Conference on Data Mining (SDM14), 2014.
5See SmartD’s source code, demo video, and supplementary
(Supplementary Material)
SmartD: Smart Meter Data Analytics Dashboard
∗Aylin Jarrah Nezhad, Tri Kurniawan Wijaya, Matteo Vasirani, and Karl Aberer
School of Computer and Communication SciencesÉcole Polytechnique Fédérale de Lausanne (EPFL) CH-1015 Lausanne, Switzerland
{aylin.jarrahnezhad, tri-kurniawan.wijaya, matteo.vasirani, karl.aberer}@epfl.ch
1. SUPPLEMENT FOR SECTION 2.1
Consumer aggregations.
A simple example of a grammar which expresses con-sumer selection/aggregation: string “1; 2; 3,4,5” corresponds to the visualization of the energy data of consumer1alone, consumer2alone, and a cluster composed of consumers3,
4, and5.
2. SUPPLEMENT FOR SECTION 2.2
Estimating typical load profile.1
SmartD is able to estimate consumer typical load profile given her demographics and contextual information. LetD
be the set of demographic information, andC be the
con-text that we are interested in. The set of demographic in-formation,D, can be, for example: a family with two
chil-dren, live in 2000 sq. ft. apartment, and own a dishwasher. The context,C, can be, for example: weekdays in January,
or Monday in the summer. In addition, letN be the set of k∈Nconsumers with the closest demographics toD. Thus,
|N|=k. Then, the estimated load profile of consumers with demographicsDon contextCis the average of (hourly) load profile of consumers inN.
A question remains, however, to decide the bestk. Should
kbe1,2,3, or something else? To answer this, for eachk un-der consiun-deration, we performleave-one-out-cross-validation. See Algorithm 2.1 for details. For load profilesLiandLj,
functiondist(Li, Lj)return the distance betweenLiandLj.
It can be computed, for example, using the difference be-tween the norm ofLiandLj.
Discovering significant demographic characteristics.
SmartD is also able to infer demographic information that significantly influences energy consumption on a specific context, e.g., weekdays in January, or Monday in the sum-mer. For this purpose, we use a supervised feature selection algorithm, namelycorrelation-based feature selection.2 We
refer to this algorithm ascfs.
Let aninstancebe a tuple(F, l), whereF ={f1, . . . , f|F|}
is a feature set andlis a target attribute. Given a set of
in-1We use the termsenergy consumptionandloadinterchangeably. 2See the bibliographic information for this method in the main paper.
Algorithm 2.1:Find the bestk
Input: a set of consumersA, a set ofkunder
considerationK={k1, . . . kn}, contextual
informationC Output: the bestk∈ K
1 foreachk∈ Kdo
2 δk←0
3 foreachi∈ Ado
4 A0← A \i
5 LetNbe the set ofkconsumers inA0having
the closest demographics toi
6 Li←(hourly) load profile ofi
7 LN ←average (hourly) load profile of
consumers inN on contextC
8 δk←δk+dist(Li, LN)
9 returnarg mink(δk)
stancesI, applyingcfstoI results in the setRof indexes of the features that are deemed to be relevant to the target attributes. Formallycfs(I) =R={r1, . . . , r|R|}such that ri⊆ {1, . . . ,|F|}.
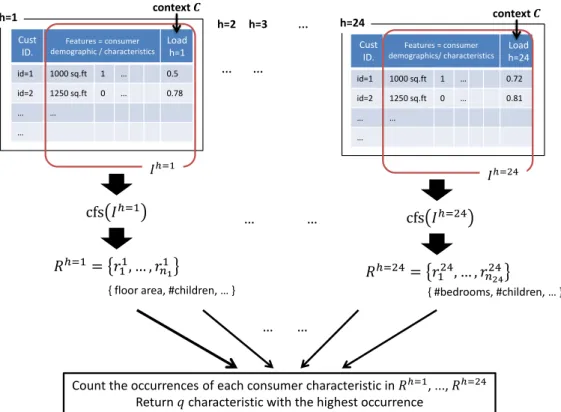
Next, we explain how to infer top-qdemographic
charac-teristics which are relevant to the energy consumption for a contextC. To make it clearer, we also illustrate the steps in
Figure 1. LetD = {d1, . . . , d|D|}be the set of consumer
demographics. We defineFias the feature set of consumer i, where each of its element is consumeri’s demographic
in-formation. Thus|F|=|D|. Letlihbe the average of hourly
energy consumption of consumer i, on contextC, at hour
1≤h≤24. Further, letAbe the set of consumers, andIh
be the set of instances for hourh, consist of tuples(Fi, lhi)
for all consumersi∈ A.
For1 ≤ h ≤ 24, let cfs(Ih) = Rh. Then, we define
score(r) = |{Rh
| r ∈ Rh,1
≤h ≤ 24}|, for1 ≤ r ≤
|F|. The top-qdemographic characteristics of the set of
con-sumersAon contextCis theqdemographicsdr∗
1, . . . , dr∗q
with the highest scores. That is, the top-q demographics
aredr∗
1, . . . , drq∗, wherescore(r
∗) ≥score(r)for allr∗ ∈
{r1∗, . . . , r∗q}andr∈ {1, . . . ,|F|} \ {r∗1, . . . , rq∗}.
id=1 1000 sq.ft 1 … 0.72 id=2 1250 sq.ft 0 … 0.81 … … … id=1 1000 sq.ft 1 … 0.5 id=2 1250 sq.ft 0 … 0.78 … … … Cust ID. Features = consumer demographic / characteristics Load h=1 h=1 Cust ID. Features = consumer demographics/ characteristics Load h=24 h=24
…
h=2 h=3…
…
𝐼ℎ=1 𝐼ℎ=24cfs 𝐼
ℎ=1𝑅
ℎ=1= 𝑟
11, … , 𝑟
𝑛11cfs 𝐼
ℎ=24𝑅
ℎ=24= 𝑟
124, … , 𝑟
𝑛2424{ floor area, #children, … } { #bedrooms, #children, … }
Count the occurrences of each consumer characteristic in 𝑅ℎ=1, ..., 𝑅ℎ=24 Return 𝑞 characteristic with the highest occurrence
…
…
…
…
context 𝑪
context 𝑪
Figure 1: Illustration on how SmartD discovers consumers’ characteristics which define their energy consumption profile.
3. POST E-ENERGY SUBMISSION
After we submit SmartD for a demo to e-Energy 2014, we still continue to develop it. Below are the functionalities that we added after the submission. SmartD’s source code is available athttps://github.com/LSIR/smartd.
3.1 Multilingual Support
When Smart first developed, the (only) language of the ap-plication is English. However, we expect SmartD to be used wide (since smart meters are also deployed world-wide), it might help the user to interact with SmartD in their own mother tongue. As the first step, we add French lan-guage.3 Developers can add other languages easily by
pro-viding the translation of the SmartD’s user interface label in the targeted languages ingsn/webapp/js/smartd-languages
and providing the function to load the language ingsn/webapp/ smartd*.html.
3.2 Forecasting
Electricity load forecasting is another important analytics task in the smart energy domain. See, for example, our previ-ous work and its bibliographic information [1]. Although in principle, any forecasting algorithm can be used, we extend SmartD by incorporating a simple (and interpretable) fore-casting method. In some application domain, e.g. demand response (DR), simplicity and interpretability of the mod-els is required (in addition to accuracy). For instance, since
3French is the language spoken in Lausanne, Switzerland, where our uni-versity is located.
DR baseline (or the forecasted demand) plays a key role in determining consumer’s incentive/payment, the method to produce DR baseline should be comprehensible by the stakeholders (the utility company/DR providers and the con-sumers). In this extension, we use one of the methods to compute DR baseline (which is essentially a forecasting al-gorithm): ISONE.4A more thorough discussion about DR
baseline and the performance can be found in [2]. Currently, SmartD is able to display the forecasted demand up toxdays ahead the latest day of the measurements, wherexis a user predefined parameter.5
4. REFERENCES
[1] S. Humeau, T. K. Wijaya, M. Vasirani, and K. Aberer. Electricity load forecasting for residential customers: Exploiting aggregation and correlation between households. InSustainable Internet and ICT for Sustainability (SustainIT), 2013, pages 1–6, Oct 2013. [2] T. Wijaya, M. Vasirani, and K. Aberer. When bias
matters: An economic assessment of demand response baselines for residential customers.IEEE Transactions on Smart Grid, 2014. doi:10.1109/TSG.2014.2309053.
4We use the implementation inhttps://github.com/tritritri/
baselines. Since this repository also contains various other methods, we can easily change ISONE with other methods as well. This can be done by changing the method call parameter insmartd-forecasting/src/ ch/epfl/lsir/smartd/forecast/Forecast.java.
5See variableforecast-horizonin the configuration filesystem.
Summary of Revision
Paper title: “SmartD: Smart Meter Data Analytics Dashboard”
a demo paper, accepted in e-Energy 2014, Cambridge, U.K.
June 5, 2014
General Remarks
We would like to thank the anonymous reviewers for their helpful comments. What we meant by thegithub page ishttps://github.com/LSIR/smartd.
Response to Reviewer 1
1.1 Comment: Critical components missing - how is this different from other energy dashboards proposed in research and existing in industry
Response: SmartD provides (1) data visualization and (2) analytics to estimate the load profile and infer demographic attributes that are relevant to the energy consumption. While the first functionality is commonly found in other energy dashboard or time series visualization tools, the second is SmartDs novel contribution. We have added this information to the revised paper as well.
1.2 Comment: Critical components missing - some benchmarking for their dashboard (how does it scale for large volume/missing datasets etc.) which are common characteristics for smart meter data.
Response: SmartD is developed on top of GSN. Its capability to receive and process data is inherited from GSN as well. For GSN performance we refer readers to:
K. Aberer, M. Hauswirth, and A. Salehi. A Middleware for Fast and Flexible Sensor Network Deployment. In Proceedings of the 32nd International Conference on Very Large Data Bases. VLDB Endowment, 2006.
What SmartD adds are the functionality to plot (visualize) the data, and the analytics layer. Both of them require shorter processing time compared to the time needed to retrieve the data. However, we agree that benchmarking the visualization and analytics functionality is needed. We plan to perform such evaluation in the future and post it in the github page.
1.3 Comment: I have not seen any smart metering deployment collecting data using GSN - can authors point to any such existing deployment and hence motivate why a visualization over GSN will be useful
Response: GSN has been widely used in sensor network deployments. The list of deployments, among others, includes: geosciences, hydrology, health monitoring, and pollution. See, e.g.,http://sourceforge. net/apps/trac/gsn and http://sourceforge.net/apps/trac/gsn/wiki/other_use_cases. In our case, a smart meter is a sensor that measures energy consumption, thus it can be well handled by GSN. What we want to emphasize here is the versatility of GSN. More specifically, GSN is able to retrieve data, not only from the sensor deployment, but also from the utility company database (even fromfrequently updated csv files). Developed on top of GSN, SmartD benefits from this versatility as well. Whether the current deployments use GSN or not, SmartD is still relevant:
• if the deployment uses GSN, then there is no problem,
• if the deployment does not use GSN, then SmartD is still able to retrieve the data from the database server, either directly or indirectly (for example, using csv files).
1.4 Comment: While you have motivated the paper describing high volume and velocity nature of the data, it is not clear how you solved these issues in your implementation. This may be worthy of explaining if the paper gets accepted.
Response: We agree that SmartD needs to (i) retrieve and process smart meter data with big volume and velocity, and (ii) visualize and extract valuable information from that data. While the first capability is provided by GSN, we explain the second in Section 2.1 and 2.2 in the main paper.
1.5 Comment: It may be further useful to give some numbers about dataset being used to evaluate the dashboard and provide some microbenchmarks for the same.
Response: The Irish CER dataset contains half-hourly measurements of around 5,000 customers over 1.5 years. The customers consist of residential houses and small and medium-sized enterprises. The measure-ments started in July 2009 and ended in December 2010. Since the trial was about dynamic pricing, we used only the data from the control group, composed of customers who are not affected by the different pricing schemes. More specifically, we chose residential customers that belong to the control group and have no missing values. This results in the selection of 782 customers. Because of the space limitation, we added only a brief information about the dataset in the main paper. Additionally, we are not allowed to provide the dataset in the github repository, since an agreement with CER has to be signed in order to obtain this data. Seehttp://www.ucd.ie/issda/data/commissionforenergyregulationcer/ for more information.
1.6 Comment: It is also mentioned that SmartD is easy to extend. However, no such information about APIs is provided even on the github link provided in the paper that may substantiate this comment.
Response: We have now added information about this to the github page. Since e-Energy submission deadline, we have also added new functionalities to SmartD, such as load forecasting (in case the user query for future data) and another language support1 — where both demonstrates the extendability of SmartD.
Response to Reviewer 2
2.1 Comment: The tool seems to be built exactly for the purpose of understanding the specific CER data set.
Response: SmartD can be used with any time series of smart meter data and consumer demographic profiles in the form of<attribute,value>tuples. We have now added this information as well to the main paper. The use of CER dataset in the main paper (including Figure 2 and 3) is only for demonstration purpose.
2.2 Comment: It is unclear how SmartD relates to other existing solutions for time series visualization.
Response: See Response 1.1.
2.3 Comment: The authors name smart meter analysis challenging due to “size” and “velocity” of the data, it is not clear from the paper how the tool addresses these challenges as the data set used for evaluation is relatively small and static (i.e., no stream data).
Response: See Response 1.4.
2.4 Comment: The technical details in section 2.2 are difficult to understand as they are too condensed and hardly motivated.
Response: We have revised Section 2.2 in the main paper. In addition, we added a more detailed explanation about this in the supplementary material that can be found in the github page. We hope that these revision made the paper clearer.
2.5 Comment: The authors present SmartD as a “first step for an open, advanced, and useful smart meter data analytics dashboard.” However they do not say what functionality they would include into such a dashboard.
Response: We have added the future work to the main paper.
2.6 Comment: The analysis presented in the paper should be given in more detail: Why is a classification approach needed? The paper says “This functionality is based on k-NN classification and correlation-based feature selection [4], where the features are the demographic characteristics and the target classes are the hourly consumption values of consumers for the given context.” I do not understand how (and why) electricity consumption - a continuous property - can be a target class for a k-NN classification. This needs more explanation in the paper. Why not select a subset of properties (that are apparently selected by their influence on the electricity consumption) and create the mean value of the consumption of all households that have the same value for the selected properties?
Response: The last sentence of this comment illustrates what actually SmartD does toestimate consumer typical load profile given certain demographic information. We have revised Section 2.2 in the main paper to make it more clear. In addition, we provided more detailed explanation about this aspect in the supplementary material that can be found in the github page.
2.7 Comment: Two typos: though→through; “..” →“.”
Response: We have fixed the typos.
Response to Reviewer 3
3.1 Comment: The paper describes a visualization and analysis tool for smart meter data. The interesting aspect of the tool is that it can provide contextual load estimations depending on demographic information. However, there is no discussion on related visualization tools
Response: See Response 1.1.
3.2 Comment: The last paragraph in Sec 2.2 is very vague. While I understand that a reasonable description of the classification mechanism cannot be given in 7-8 lines, the authors may consider to renounce giving an incomplete and confusing description and rather insist on other novel features of SmartD, especially concerning the future ones.
Response:
• See Response 2.4 for more details about the classification (learning) mechanism.
• SmartD’s novel features have been given an additional emphasize in the Section 1 in the main paper.
• We have now mentioned several possible interesting extensions for SmartD in the Section 3 in the main paper.