Administration on Aging
Chronic Disease Self-Management Program (CDSMP)
Process Evaluation
HHSP233201100492G
Final Report
April 30, 2013
Authors
:
Cynthia Woodcock, IMPAQ International
Holly Korda, Altarum Institute
Erkan Erdem, IMPAQ International
Sarah Pedersen, IMPAQ International
Michelle Kloc, Altarum Institute
Erik Tollefson, Altarum Institute
Submitted to:
Project Officer: Susan Jenkins Office of Performance and Evaluation
Administration for Community Living Department of Health and Human Services
330 Independence Ave SW # 4760 Washington, DC 20201
Submitted by:
Project Director: Tina Barretto IMPAQ International, LLC 10420 Little Patuxent Parkway
Suite 300 Columbia, MD 21044 Telephone: (443) 367-0088
TABLE OF CONTENTS
Page
EXECUTIVE SUMMARY... III
CHAPTER 1. INTRODUCTION ...1
1.1 Purpose of the Process Evaluation ...1
1.2 AoA’s Role in Funding CDSMP ...1
1.3 Stanford CDSMP ...2
CHAPTER 2. PROCESS EVALUATION DESIGN ...4
2.1 Process Evaluation Research Questions ...4
2.2 Data Sources ...4
2.3 Evaluation Approach ...5
CHAPTER 3: CHARACTERISTICS OF ARRA-FUNDED STATE GRANTEES ...8
3.1 Introduction ...8
3.2 Grantee Characteristics ...8
CHAPTER 4: POPULATIONS SERVED BY CDSMP ...13
4.1 Introduction ...13
4.2 Characteristics of CDSMP Participants ...14
4.3 Looking Ahead to the Future ...22
4.4 Reach of CDSMP ...24
CHAPTER 5: IMPLEMENTATION OF CDSMP ...26
5.1 Introduction ...27
5.2 Program Oversight and Administration ...28
5.3 Program Delivery Infrastructure ...33
5.4 Program Fidelity ...41
5.5 Partners ...46
5.6 Expanding CDSMP to New Populations ...50
5.7 Post-ARRA Changes ...52
CHAPTER 6: PROGRAM COMPLETION RATES ...54
6.1 Introduction ...55
6.2 Completion Rates for ARRA Grantees ...55
6.3 Regression Analysis of Completion Rates ...70
CHAPTER 7: DATA COLLECTION AND EVALUATION ...78
7.1 Introduction ...78
7.2 Findings ...79
7.3 Data Collection under ARRA Funding ...80
7.4 Data Use and Reporting ...82
7.5 Evaluation Efforts ...85
7.6 Post-ARRA Changes ...90
7.7 Future Plans ...93
CHAPTER 8: SUSTAINABILITY OF CDSMP ...95
8.1 Introduction ...96
8.2 Deliver CDSMP through Existing Networks ...98
8.3 Organizational Strategies ...99
8.4 Partner with Strong Organizations ... 104
8.5 Build Provider Referral Systems ... 105
8.6 Educate Students in the Health Professions ... 106
8.7 Leverage Grant Funding... 106
8.8 Build Third-Party Billing Capability ... 107
8.9 Integrate Evidence-Based Programs into Health Reform Initiatives ... 111
CHAPTER 9: BEST PRACTICES AND RECOMMENDATIONS ... 113
9.1 Best Practices ... 113
EXECUTIVE SUMMARY
The U.S. Administration for Community Living (ACL) supports states in their efforts to develop and implement delivery systems for Chronic Disease Self-Management Education programs. This includes the Chronic Disease Self-Management Program (CDSMP) developed by Stanford University. CDSMP, one of the most recognized evidence-based health promotion programs, provides participants with the education and tools they need to help them manage chronic conditions such as diabetes, heart disease, or arthritis. The highly developed protocol for delivering Stanford CDSMP makes it possible to disseminate, evaluate, and bring the program to scale.
This process evaluation examines state CDSMP programs funded through Communities Putting
Prevention to Work: Chronic Disease Self-Management Program, an initiative of the
Administration on Aging (AoA)—now a part of ACL1—in collaboration with the Centers for Disease Control and Prevention (CDC) and the Centers for Medicare & Medicaid Services (CMS). Under this initiative, AoA awarded two-year grants totaling $27 million to 45 states, the District of Columbia, and Puerto Rico in 2010. Grant funds were authorized by the American Recovery and Reinvestment Act (ARRA) of 2009.
In their ARRA grant applications, each state was to provide “a vision for long-term sustainability of CDSMP as part of its overall approach to helping older adults remain independent and living in their own home and communities.”2 AoA endeavored to support states in developing strong, sustainable delivery systems for CDSMP that would continue to thrive after federal funding came to an end. AoA promotes these key elements for an integrated, sustainable service delivery system:
1. State-level aging and public health leadership. Regardless of which agency is the lead for CDSMP implementation, AoA encourages states to develop effective collaborations between the state unit on aging and the public health agency.
2. Effective partnerships to embed CDSMP into statewide health and long-term services and supports systems. AoA encourages states to strategically recruit and partner with organizations that can embed CDSMP into their ongoing operations, with priority to delivery system partners with multiple delivery sites, the capacity to reach large populations, and a commitment to offering workshops on an ongoing basis beyond the grant period.
3. Delivery infrastructure/capacity to provide programs throughout the state. AoA encourages states to develop adequate capacity to deliver CDSMP workshops throughout the state.
1 In April 2012, AoA, the Office on Disability, and the Administration on Developmental Disabilities were combined
into ACL, a single agency with the U.S. Department of Health and Human Services. AoA is now a part of ACL. Throughout this report, we refer to AoA as the sponsor and administrator of the agency’s CDSMP initiative.
4. Centralized or coordinated processes for recruitment, intake, referral, and registration/enrollment. AoA encourages states to develop centralized or coordinated outreach and marketing efforts and to coordinate with ADRCs in the state.
5. Quality assurance program and ongoing data systems and procedures. States are strongly encouraged to have a strong quality assurance program to ensure fidelity and facilitate continuous quality improvement, as well as data collection systems to support these functions.
6. Business planning and financial sustainability. States are expected to develop and execute business or sustainability plans to help ensure financial sustainability beyond the grant period, working with government agencies, foundations and corporations, health care providers, employer groups, and public and private insurers.
In September 2011, AoA awarded Contract No. HHSP233201100492G entitled CDSMP Process
Evaluation and Detailed Outcome Evaluation Design to IMPAQ International and Altarum
Institute. AoA was particularly interested in learning about states’ experiences in delivering CDSMP to adults aged 60 and older, the agency’s target population. This report details findings from the process evaluation of CDSMP.
Research Questions
The process evaluation addresses five research questions:
1. Who do ACL CDSMP grantees serve? How do the individuals served through the ACL CDSMP grants compare with populations studied through other CDSMP evaluations?
2. How are local sites implementing the CDSMP? For example, how do their organizational structure, financial resources and allocation and their fidelity compare to the Stanford CDSMP model? Are there common adaptations being made at ACL supported sites? Are there adaptations which specifically improve the applicability of the CDSMP to seniors (age 60+) with chronic diseases?
3. What are program completion rates, in general and by important sub-groups? What barriers and supports affect the existing completion rates?
4. What data are ACL CDSMP grantees collecting and what is the state of their records systems? What is the evaluation capacity of state-level grantees and/or local sites including whether they have conducted or participated in program evaluations?
5. Have these grantees built sustainable statewide distribution and delivery systems which increase the availability of evidence-based self-management programs and provide an ongoing distribution channel for other evidence-based programs that may be delivered by community based organizations?
Process Evaluation Approach and Data Sources
The research team employed a multi-method approach using multiple qualitative and quantitative data sources (Exhibit ES1). We consulted with AoA program and regional staff and formed a Technical Advisory Group (see Appendix A) to inform the process evaluation design. The team conducted site visits to six states in January-February 2012 to observe program implementation on the ground and further inform development of the process evaluation. For the site visit interviews, we mapped the five research questions to research domains and then developed interview questions for each domain. Next, during April-June 2012 we conducted one-hour telephone discussions with key informants representing each of the 47 state grantees as part of AoA’s ARRA grant close-out activities. We used an abbreviated list of questions that focused on the current landscape for CDSMP and the anticipated changes in the post-ARRA funding environment in order to assess the current status of each program and prospects for sustainability. We also analyzed program data submitted to the National Council on Aging (NCOA) by the state grantees to present a descriptive analysis of participants, workshops, and leaders. The program data were also used to conduct regression analyses to examine the influence of various factors on participant completion rates, such as participant demographics and chronic conditions, size and location of the workshops, seasonal factors, and characteristics of the state’s CDSMP delivery system.
Summary of Findings
Characteristics of State Grantees
1. The lead agency in the majority of states is the state unit on aging. In two-thirds of the ARRA-funded states, the lead agency is the state unit on aging. The department of health is the state lead for one-third of the states.
2. Grant awards varied by state. Grant awards totaled $27 million; awards to states ranged from $50,000 to $1.19 million.
3. Most state grantees had received prior funding to implement CDSMP. Only ten grantees had never before received significant Federal funding to develop a CDSMP program; the other states had received prior funding from AoA, the Centers for Disease Control and Prevention (CDC), and/or CDC’s National Association of Chronic Disease Directors (NACDD) so already had experience implementing the program.
4. All but one state met their goals for the number of participants and completers. ARRA grantees agreed to goals at the outset of their awards that were based on the number of Medicare beneficiaries in each state. Only one grantee did not achieve their goals during the two-year grant period or during a no-cost extension. Nine grantees exceeded their goals by more than 200 percent.
CDSMP Participants
1. ARRA grantees provided CDSMP to nearly 90,000 participants. During the two-year ARRA grant period, 22,043 individuals under age 60, 57,870 individuals aged 60 and older, and 9,945 individuals of unknown age participated in CDSMP workshops in grantee states, for a total of 89,861 participants.
2. Disproportionately more CDSMP participants were served by state units on aging. Eighty percent of participants were enrolled in CDSMP operated by state units on aging; 20 percent participated in programs operated by public health departments even though two-thirds of grantees were state units on aging.
3. The majority of participants attended workshops in metropolitan areas. Seventy-nine percent of participants attended workshops in metro areas; 21 percent participated in workshops in non-metro areas.
4. Participants were largely white and female, although grantees were targeting more diverse populations. Among those aged 60 and older, 72 percent of participants were female, just over half were white, and 15 percent were African American. Many state grantees reported targeting special populations, particularly Latinos, Asians, and Native Americans.
5. On average, participants reported 2.44 chronic conditions. However, women reported more chronic conditions than men (an average of 2.51 for women; 2.17 for men). Hypertension/high blood pressure and arthritis/rheumatic disease were the most commonly reported chronic conditions for participants aged 60 and older. Rates of cancer, heart disease, stroke, and osteoporosis tended to increase with increased age. Depression or anxiety disorders and diabetes tended to be more prevalent among those younger than age 60 and those aged 60 to 64, with rates decreasing with age thereafter. 6. Longer funding histories were not associated with serving more diverse populations. Although the research team hypothesized that grantees with longer and more diverse funding histories for CDSMP implementation would be serving more diverse populations, this was not the case. Participant demographics were generally consistent across the three types of funding histories examined.
Implementation of CDSMP
1. CDSMP was implemented successfully in a diverse set of organizational arrangements.
Aging services networks served as grantees in most states, using aging services providers such as AAAs, state and local public health departments, and private health systems as key partners for CDSMP program oversight and delivery. Grantees used centralized, decentralized and shared infrastructures.
Oversight: Grantees used centralized program administration and oversight in 14 states, decentralized models in 23 states, and shared systems of oversight in 10 states.
Delivery: Most grantees (37) used decentralized delivery systems to deliver CDSMP through public and private organizations including AAAs, 9 used centralized infrastructures such as private or public health systems, and one grantee used a mixed approach. Grantees that used centralized systems to deliver CDSMP typically centralized communications, licensing, and referral as well.
2. No single approach works best in all contexts. However, centralized approaches offer advantages such as standardization of training and delivery, leverage for data collection, and certain economies of scale—while decentralized approaches can be more responsive to local conditions and resource availability. CDSMP oversight and delivery arrangements typically reflected historical funding and partnerships, geographical relationships, or political structures already established within the state. 3. Marketing and recruitment continue to be challenges for many grantees, especially
those with limited staff and financial resources for outreach. Grantees that leveraged established partnerships and networks (e.g., AAAs, Area Health Education Centers, etc.) to market and recruit participants were more likely to be successful reaching older adults and filling workshops.
4. Retaining participants throughout the 6 workshop sessions can be difficult—but grantees have identified successful strategies to support retention. Transportation and weather problems, illness, and participant motivation or interest can all interfere with attendance. Grantees and workshop leaders reported using small incentives such as gift cards, key chains, and other giveaways; scheduling workshops at convenient times and places; and assisting participants with transportation to and from workshops as key strategies for improving retention.
5. Reaching cultural and ethnic minorities can be difficult, especially if funding for outreach is limited. However, many sites have been able to reach and serve these populations successfully. Once enrolled, these populations are likely to stay with the program and show high rates of completion. Several grantees have expanded reach and reported success serving special populations including prisoners and disease-specific populations. More information is needed about grantees’ experiences with these groups.
6. Program success depends highly on the commitment of key leaders and champions.
Program champions are key to the success and sustainability of CDSMP programs, especially at start up. Grantees of programs lacking champions or continuity of leadership encountered more problems with ongoing program operations and had more difficulty making the case to sustain the program at the end of ARRA funding. Grantees should be sure to start establishing policy and infrastructure immediately so the program does not fail if the champion is gone.
7. Fidelity is multi-faceted, with multiple components identified as important to program success in the Stanford protocols. Grantees reported fidelity as a priority and approached it in various ways. The relative importance of specific items to program success is unclear. Grantees and workshop leaders questioned some items, including class size and presentation format. Questions were also raised regarding the relative importance of specific workshop sessions. Some grantees suggested a study of the relative importance of CDSMP fidelity requirements would be helpful to shed light on these and other issues.
8. Grantees called out a need for state-specific information about the effectiveness, cost effectiveness, and return on investment of CDSMP. This information is often requested by legislators and is needed to support third-party payment and funding to continue program availability.
Completion Rates
Grantees were expected to track the number of participants and “completers” (i.e. the number of individuals who completed at least four out of six workshop sessions).
1. The average completion rate for CDSMP participants was 75 percent. However, average completion rates varied from 63 percent in Oregon to 86 percent in Oklahoma. Completion rates for individuals aged 60 and older were slightly higher than for those under age 60 (77.2 percent compared to 74.5 percent). At 77 percent, female participants had higher completion rates than males. Workshops that were held by faith-based organizations had the highest completion rates of any type of implementation site.
2. Completion rates varied by type of program oversight. States that instituted a centralized model to oversee CDSMP had the highest completion rates for participants under age 60 (75.4 percent) and over age 60 (79.3 percent). Average completion rates were slightly higher for programs led by state units on aging than for programs led by public health agencies.
3. Individuals with certain chronic conditions were more likely to complete CDSMP. Individuals reporting hypertension and osteoporosis had greater odds for completion. Not unexpectedly, individuals reporting depression were less likely to complete CDSMP, suggesting the need for more supports for this population.
4. Smaller workshops tend to have higher completion rates. Participants in smaller workshops (i.e., with no more than 5-6 participants) had significantly higher completion rates even though workshops of this size are not recommended in Stanford’s program fidelity guidelines. Greater camaraderie and peer pressure combined with possibly more individualized attention from leaders may explain the higher completion rates.
5. Leader experience matters. Participants who attended workshops with leaders who taught a workshop in the previous quarter or with leaders who had taught together previously had higher odds of completion.
6. Completion rates were higher for Spanish language CDSMP (Tomando Control de su
Salud). Cultural elements included in the Spanish language CDSMP curriculum may have
a positive effect on completion rates and should be examined more carefully for applicability to English language CDSMP.
7. Completion rates in non-metro areas were higher than in metro areas. This was despite barriers common in rural areas such as a lack of public transportation, long travel distances to classes, and a greater impact of inclement weather reported by grantees.
8. The relationship between Class Zero and completion rates is unclear. Regression analysis did not find strong evidence that participation in Class Zero improved the overall odds of completing CDSMP. Participants in workshops that offered an introductory Class Zero had slightly higher completion rates than other participants (75.8 percent compared to 74.7 percent) and the difference is statistically significant.
Taken together this suggests that additional research on which populations and in which situations Class Zero might prove beneficial is needed.
Data Collection
1. More than half (31 of 47) of grantees reported using CDSMP data required under the ARRA grant, often supplemented with other primary and secondary data on programs, for program management or process evaluation, and 17 grantees reported conducting special studies of health outcomes, cost or utilization. Grantees often evaluate participant (and sometimes workshop leader) satisfaction, with 3-, 6- and 12-month follow up after completion of the workshops. Even states collecting only the data requested under the grant were able to use the information for program planning (e.g., to target need for leader training and to target populations and locations for workshops).
2. Grantees used a wide array of approaches to collect data on CDSMP participants required under their ARRA grants. All grantees were able to collect and submit program data. Some used basic commercially available software such as Excel or Access to track or collect additional data, while others developed or expanded data collection programs used by state agencies, contracted organizations or host sites. Data collection activities were typically conducted by program staff funded by the CDSMP grant or integrated as part of other grantee infrastructure for CDSMP or other programs.
3. Several grantees reported partnering with universities to conduct rigorous research studies. Grantees’ studies use many different types of measures, and are starting to build a research base for CDSMP as implemented at the state and local levels.
Measures track changes in functional status, health care utilization, cost and clinical indicators.
4. Grantees reported various benefits of data collection and reporting, including program planning and oversight, program improvement, and reporting to stakeholders. Some grantees and host sites have incorporated evaluation into their aging and public health programs. Data collection and monitoring require funding to support. Not all states are able to continue these activities post ARRA funding.
Program Sustainability
1. Strong leadership and vision at the state level will be a key factor in program sustainability. Whether a state opts for centralized or decentralized oversight or a centralized or decentralized delivery system, state-level commitment to CDSMP will be critical. Leaders at the state level who ensure that CDSMP is integrated into statewide strategic planning, actively support implementation at the local level through technical assistance and other supports, and advocate for statewide standards for fidelity monitoring are likely to be rewarded with stronger, more sustainable programs.
2. A symbiotic partnership between the state unit on aging and the public health department benefits CDSMP implementation and sustainability. Aging brings access to a state’s aging network, which is important for reaching older adults and, increasingly, persons with disabilities (through ADRCs). Public health brings a commitment to evidence-based health promotion and prevention programs and partnerships with established delivery systems. States in which aging and public health collaborate effectively tended to have stronger CDSMP delivery networks, even though the aging-public health partnerships vary significantly in structure and function across the states. 3. Agency leaders at the state level will not be successful in advocating for and sustaining
CDSMP unless they are able to effectively communicate the program’s benefits to the governor’s office, legislators, and other stakeholders. Many grantees reported that state officials and legislators want evidence of program benefits and cost-effectiveness before considering broader support for CDSMP.
4. While strong leadership is needed at the state level, regional and local leadership is also important to sustainability. Regional or local leaders committed to CDSMP, as well as “embedded” agency staff who are trained as CDSMP leaders, can bring stability and continuity at the local level. Embedded leaders can also reduce dependence on volunteers. Many sites reported that recruiting, training, and sustaining an all-volunteer corps of workshop leaders can be challenging and costly.
5. With their boundless energy and tenacity, state and local champions often play a pivotal role in launching successful programs; however, sufficient attention must be given to building a strong delivery system and broad support for the program.
Otherwise, a program may not be able to weather the loss of a champion or a change in leadership.
6. Strong infrastructure is key to sustainability, whether at the state level (centralized models) or the regional level (decentralized models). Some grantees advocated for centralized infrastructure to support multi-site, multi-program licenses and data collection and support for community-based organizations. Others advocated for decentralized approaches, making efforts to have community-based organizations take on program responsibilities to ensure sustainability of CDSMP in the event of state budget cuts or reorganizations might impact capacity to support ongoing program activities. There is not strong evidence for one approach over the other as a sustainability strategy.
7. Simultaneous pursuit of multiple strategies to promote sustainability can be beneficial in a program’s start-up phase, but a focus on the most effective strategies is ultimately the best approach. “Let a thousand flowers bloom” was the mantra of a number of ARRA grantees in their quest for sustainability; however, those who systematically evaluate the various strategies and ultimately focus only on those likely to result in the greatest benefit will be most successful over the long term.
8. Outsourcing program oversight and technical assistance can be an effective strategy as long as there is funding to do so. Grantees such as California and New York have been able to build strong programs by outsourcing program implementation responsibility to other organizations. However, this is a sustainable model only if there is a dedicated source of funding for these organizations (e.g., grant funding or a state budget line) or program revenue streams that can support them (e.g., technical assistance fees).
9. Perhaps most challenging for grantees was developing effective referral networks and few “best practices” emerged. While all but one grantee met their goals for workshop participants, virtually all reported difficulty recruiting participants. Developing more effective recruiting strategies will be an important factor for ensuring long-term sustainability of CDSMP.
10. “Smart” investment of program development funds can help to build sustainability. Many grantees avoided using ARRA funds to support state and/or local staff salaries, understanding that it would be difficult to find replacement funds when the ARRA grant came to an end. Instead, investing in infrastructure building was more likely to position a program for sustainability over the long term (e.g., developing marketing materials and Web sites, training program coordinators and leaders, establishing processes for fidelity monitoring).
11.Long-term sustainability is likely to depend on integration of CDSMP into new delivery system and financing models. States cannot rely on public or private grant funding to sustain CDSMP, which can ebb and flow as budgets and priorities change. Incorporating CDSMP into medical home models, large medical practices like Kaiser Permanente, and public and private managed care programs is likely to be a more sustainable strategy.
Best Practices and Recommendations
Our analysis of data collected during site visits and telephone discussions with grantees suggests a number of “best practices” for developing and sustaining CDSMP programs for older adults. Federal and state policies can advance adoption of evidence-based programs, such as the new federal requirement that Title IIID funding may only be used for evidence-based programs and Arkansas’ requirement that AAAs include at least one evidence-based program in their four-year State Plans on Aging. State health reform initiatives that incorporate CDSMP can have a significant impact on incentivizing program development and sustainability (e.g., Vermont’s Blueprint for Health). States that have developed effective referral networks (e.g., with physician practices, health plans, FQHCs, ADRCs) are more likely to have strong programs, as are states that have established strong and creative partnerships to expand the reach of CDSMP. Grantees also benefit from partnerships with universities (specifically, special centers, programs, or research groups) and other external organizations whose missions align with CDSMP. Organizations such as these can provide technical assistance, data collection, and evaluation expertise.
Ensuring long-term sustainability will require multiple strategies, but the evaluation team believes that positioning states to diversify their funding streams and receive third party payment should be a goal shared by all states and stakeholders. This will require documenting the effectiveness and efficiency of CDSMP delivery, conducting cost finding and establishing payment rates and approaches for delivering the program, and working with private health plans, Medicare Advantage plans, and Medicaid managed care organizations to incorporate CDSMP as a billable service for members. The time is right, with public and private health plans actively embracing health promotion, care coordination, and medical home models and states adopting more expansive managed care for public beneficiaries.
To continue to build and expand CDSMP, the evaluation team offers the following recommendations to ACL.
Recommendation 1: Support Grantees in Communicating the Benefits of CDSMP to State Policy Makers
State grantees often remarked that in order to convince state legislators and agency leaders of the importance of building and sustaining a strong CDSMP program, they must be able to demonstrate the benefits of CDSMP for residents of their state. Grantees stressed the importance of having data on both improved health outcomes and demonstrated cost savings. The peer-reviewed literature includes a number of evaluation studies in which improvements in health behaviors, health status, and health service utilization have been documented through self reports by CDSMP participants as well as more rigorous studies of impact and outcome including the original clinical trials that establish the evidence base for CDSMP by Stanford University. Grantees could benefit from guidance on which research studies could best support their advocacy efforts at the state level, as well as how to “message” research findings to convince policy makers that similar outcomes could be expected in their state.
ACL and CMS should continue to pursue studies of cost effectiveness using Medicare and Medicaid fee-for-service administrative data. In addition, cost-effectiveness studies in managed care settings could help persuade health plans to either provide CDSMP directly or offer members access to state programs. Several grantees reported interest from Medicare Advantage plans, Medicaid managed care plans, and private insurance plans. Health plans active in multiple states may be interested in multi-state demonstrations and evaluations. Once cost-effectiveness studies are completed, grantees will need assistance with messaging findings so that their applicability can be understood by state policy makers.
Grantees should also be encouraged in their efforts to continue collecting and monitoring program performance data (e.g., through technical assistance). It will be important for grantees to monitor participation and completion rates, participant satisfaction, leader performance, and fidelity in order to help convince state policy makers that program dollars are well spent and to continue funding the program. To support data collection efforts, ACL should continue to allow grantees to enter data into and receive reports from the NCOA database even if they are
no longer receiving AoA funding. Technical assistance could also be provided to states interested in collecting additional data. Encouraging grantees to partner with local university-based research centers to collect, analyze, and report performance data could be beneficial as well.
Recommendation 2: Assist States with Determining the Cost of CDSMP and Preparing for Third-Party Payment
States are eager to seek payment for provision of CDSMP from diverse funding sources but do not have an established methodology for determining the true cost of the program. While NCOA provides a cost calculator developed by the Lewin Group that states can use to estimate the costs of program delivery, more sophisticated state and region-specific information is needed to determine the actual per capita cost of providing a CDSMP session to ensure that the service is priced correctly and the program does not operate at a loss. As in any business model, the cost calculation should include product development, marketing, service provision, quality assurance, and indirect costs. States would benefit from a more complex model developed by a reputable accounting firm, as well as technical assistance in applying the model. Having defensible estimates for per capita cost will be important in negotiating payment with providers, third-party payers, and employers. Payment options range from fee-for-service payment per workshop or workshop session, to per capita completion payments, bundled rates, or global payments from health plans, patient-centered medical homes, accountable care organizations, and other purchasers.
The transformation from grant-funded programs to a third-party payment business model will require the capability to bill for services. A technical assistance program that aids states in developing billing system requirements, issuing procurements to prospective vendors, implementing new billing systems and linking them to other systems (e.g., Medicaid MMIS, electronic registration systems), and training staff to manage billing functions would be welcomed by states. Grants to states for purchase and implementation of systems would also be beneficial.
Accreditation processes and programs for Medicare reimbursement for community-based delivery of the Diabetes Self-Management Program (DSMP) are now available and several respondents in the evaluation interviews suggested that DSMP could well provide a model for CDSMP. ACL should continue to provide grants and technical assistance to states seeking to become accredited to receive Medicare reimbursement for DSMP. In addition to expanding access to DSMP, this will help states to build the capacity to bill for self-management programs, which will in turn support state efforts to bill health plans and Medicaid. Additionally, ACL and CMS should evaluate the DSMP experience and consider the prospects for statutory change that would permit Medicare reimbursement for CDSMP.
Recommendation 3: Promote Peer Learning Among Grantees
State grantees are eager to learn from the experiences of other grantees. Creative peer learning opportunities in which grantees are “matched” with other grantees to provide peer technical assistance could spur more rapid program expansion through the use of proven implementation strategies. This could be coupled with a Web site that organizes resources supplied by grantees (i.e., manuals, organizational charts, marketing plans and materials, legislative reports, sample contracts, requests for proposals, Medicaid rules, survey instruments, evaluation reports) around implementation topics (e.g., delivery system oversight and organization, outreach and marketing, recruitment and retention of leaders, building referral networks, fidelity monitoring, program evaluation). Mini-case studies on best practices and peer technical assistance that had a significant impact on program implementation could also be shared. Activities such as these are currently provided by NCOA. ACL should continue to support current and expanded options for peer knowledge transfer.
Recommendation 4: Develop an Electronic Registry for Leaders
Few states have electronic systems for registering leaders, scheduling leaders for workshops, and monitoring leader certification. An electronic registry could facilitate efficient training and leveraging of leaders within and across states and regions, including providing interstate access to leaders. ACL could sponsor the development of a web-based electronic registry that could be used by all states. The registry could be designed for states to use individually (i.e., each state would only have access to their own data, but all states could use the system) or by groups of states (e.g., smaller states in the northeast that may want to share leaders across state lines). Alternatively, ACL could sponsor the development of registry software that could be downloaded and customized for use by individual states (i.e., a freeware or shareware program).
Recommendation 5: Educate Health Professionals about Self Management
Universities in New Jersey, Ohio, and Illinois have incorporated education about self-management and evidence-based health promotion programs into their nurse training programs. In some states, health professions students are being trained as CDSMP leaders and are referred to organizations that are seeking volunteer leaders. While this strategy is not likely to significantly increase the leader workforce in the immediate future, educating health professionals about the importance of self management could, over time, have an impact in practice settings and in terms of referrals to self management programs. ACL could work with professional societies such as the American Association of Colleges of Nursing to develop curricula on self-management education that could be adopted by other nurse training programs. Curricula could also be developed for practicing professionals that could be offered online or at professional meetings, with continuing education unit (CEU) credits awarded to professionals completing the programs.
Recommendation 6: Assist Grantees in Developing More Effective Strategies for Building Referral Networks for Recruiting Participants
Grantees reported that building an effective referral network for recruiting participants was perhaps the most daunting challenge they faced. Given the pressures on today’s medical practices, getting physicians to directly refer patients was rarely a successful strategy. However, some grantees reported success with special mailings generated by physicians’ offices (signed by the physician) to patients whose medical records indicated they might benefit from CDSMP. Other grantees reported efforts to incorporate a “button” in the electronic medical record that could trigger a patient referral. Additionally, some health plans were identifying members who might benefit from a self-management program through medical record reviews—and in some cases, providing cash rewards for participation. Strategies such as these warrant further exploration. In addition, more research is needed to identify the personal, social-behavioral, and clinical characteristics of individuals most likely to participate, complete, and benefit from the program and how to effectively target these individuals using electronic medical records. With the growth of ADRCs, ACL has a unique opportunity to encourage referrals within the aging and disability services networks. ADRCs in many states are referring consumers to CDSMP. ACL’s technical assistance contractor for the ADRC program could develop a training module for ADRC staff on incorporating self-management program referrals into the ADRC screening and options counseling processes. This could include developing several questions related to chronic disease management for integration into the initial screening questions ADRCs use when a consumer contacts them for the first time, as well as developing guidelines for building self-management program counseling and referrals into options counseling. Nevada’s vision for integrating CDSMP into their ADRC Web site—using the portal for consumer information, workshop schedules and registration, communications with and reporting by leaders, and on-line leader training—could be promoted to other states through webinars and presentations at ADRC grantee meetings, as well as through technical assistance on implementing these functions.
CHAPTER 1. INTRODUCTION
1.1 Purpose of the Process Evaluation
To provide older adults with the education and tools they need to manage chronic diseases such as hypertension, diabetes, arthritis, and heart disease, the U.S. Administration for Community Living (ACL) supports states in their efforts to develop and implement delivery systems for the Chronic Disease Self-Management Program (CDSMP) developed by Stanford University. This process evaluation examines state programs funded through Communities
Putting Prevention to Work: Chronic Disease Self-Management Program, an initiative of the
Administration on Aging (AoA)—now part of ACL3—in collaboration with the Centers for Disease Control and Prevention (CDC) and the Centers for Medicare & Medicaid Services (CMS). Under this initiative, AoA awarded two-year grants totaling $27 million to 45 states, the District of Columbia, and Puerto Rico in 2010. Grant funds were authorized by the American Recovery and Reinvestment Act (ARRA) of 2009. Many of the states used grant funds to support CDSMP as well as other evidence-based, disease-specific self-management programs such as the Arthritis Self-Management Program (ASMP) and the Diabetes Self-Management Program (DSMP). However, the focus of the process evaluation is on the development and dissemination of CDSMP.
In September 2011, AoA awarded Contract No. HHSP233201100492G entitled CDSMP Process
Evaluation and Detailed Outcome Evaluation Design to IMPAQ International and Altarum
Institute. The process evaluation conducted under this contract was intended to examine the populations served by state grantees, how grantees implement their CDSMP programs, and how programs differ in terms of completion rates, distribution channels, delivery systems, and the capacity of grantees to disseminate and sustain their programs. AoA was particularly interested in learning about states’ experiences in delivering CDSMP to adults aged 60 and older, the agency’s target population. Prior studies of CDSMP did not focus specifically on the older adult population.
1.2 AoA’s Role in Funding CDSMP
The ARRA grants were awarded to state grantees for the two-year period March 31, 2010, to March 30, 2012. In each state, funding was awarded to either the state unit on aging or the state department of health as the lead agency. Development and delivery of CDSMP is carried out by the lead agency together with host and implementation sites. A host site is an organization that oversees program operations (e.g., an Area Agency on Aging (AAA)) and may also manage recruitment and enrollment of participants. An implementation site (also known as a program delivery site) is where the workshop is conducted (e.g., a senior center, YMCA, or
3 In April 2012, AoA, the Office on Disability, and the Administration on Developmental Disabilities were combined
into ACL, a single agency with the U.S. Department of Health and Human Services. AoA is now considered a program of ACL. Throughout this report, we refer to AoA as the sponsor and administrator of the agency’s CDSMP initiative.
faith-based organization). In some locations the host and implementation sites are the same organizations; in other locations they are different.
AoA has a cooperative agreement with the National Council on Aging (NCOA) to provide technical assistance to CDSMP grantees and other AoA grantees implementing evidence-based prevention programs. Technical assistance may include web-based training, on-site visits, targeted teleconferences, peer-to-peer mentoring, strategies and models for developing statewide CDSMP distribution systems, and strategies to sustain programs beyond the grant
cycle
including location, number, and characteristics of participants served, and workshops offered. Grantees submit program data to NCOA for inclusion in this database.
1.3 Stanford CDSMP
CDSMP was developed in 1992 by the Stanford Patient Education Research Center working with the Divisions of Family and Community Medicine and the Division of Rheumatology and Immunology. CDSMP consists of 2.5-hour workshops offered once a week for 6 weeks. CDSMP is generally administered in community settings such as churches, libraries, YW/MCAs, senior centers, public housing projects, community health centers, and cooperative extension programs. The program is also available online, named Better Choices, Better Health.4 Because the program is not disease-specific, people with different chronic health problems attend together. Several key characteristics of the Stanford CDSMP intervention make it unique when compared to other such evidence-based disease and disability prevention initiatives. The highly developed protocol for delivering Stanford CDSMP makes it possible to disseminate, evaluate, and bring the program to scale. CDSMP uses master and lead (lay) trainers and in-person workshops. Workshop leaders are trained to strictly adhere to specific program requirements and processes in order to attain and maintain fidelity to the program as originally designed. For example, they are asked to conform to guidelines regarding numbers of workshop participants, workshop content, duration, and more.
Master trainers. Master trainers provide some oversight of CDSMP workshops, train workshop leaders, work in pairs, and serve as workshop leaders themselves. In addition, master trainers:
Attend 4.5-day master training.
Facilitate one 4-day leader training within a year of completing master training. Lead a full 4-day leader training at least once a year to remain certified.
Lay Leaders. These are individuals who facilitate the CDSMP workshops. They work in pairs and commit to the following requirements:
Attend four 6-hour days of training over 2 weeks and complete two practice teachings during training.
Commit to facilitating at least one 6-week workshop in the year in which they were trained.
Must come from the same communities which the CDSMP intends to serve.
In-person workshops:
Are offered to group sizes of 10–16 participants. Are offered 2.5 hours a week over 6 weeks.
Are conducted by two lay leaders who received training from a master trainer.
Workshop topics include: 1) techniques to deal with problems such as frustration, fatigue, pain, and isolation; 2) appropriate exercise for maintaining and improving strength, flexibility, and endurance; 3) appropriate use of medications; 4) communicating effectively with family, friends, and health professionals; 5) nutrition; and 6) how to evaluate new treatments.
Findings from Stanford’s evaluation of CDSMP are available on the Stanford web site. They found that CDSMP participants—when compared to those who did not participate in CDSMP— had significant improvements in exercise, cognitive symptom management, communication with physicians, self-reported general health, health distress, fatigue, disability, and social/role activities limitations. Participants in a randomized trial also had fewer hospitalizations and spent fewer days in the hospital.5
5 See:
(1) Lorig KR, Sobel DS, Stewart AL, Brown Jr BW, Bandura A, Ritter P, González VM, Laurent DD, Holman HR. Evidence suggesting that a chronic disease self-management program can improve health status while reducing hospitalization: A randomized trial. Medical Care, 37(1):5-14, 1999
(2) Lorig KR, Ritter P, Stewart AL, Sobel DS, Brown BW, Bandura A, González VM, Laurent DD, Holman HR. Chronic Disease Self-Management Program: 2-Year Health Status and Health Care Utilization Outcomes.
CHAPTER 2. PROCESS EVALUATION DESIGN
2.1 Process Evaluation Research Questions
The process evaluation addresses five research questions:
1. Who do AoA CDSMP grantees serve? How do the individuals served through the AoA CDSMP grants compare with populations studied through other CDSMP evaluations? 2. How are local sites implementing the CDSMP? For example, how do their organizational
structure, financial resources and allocation and their fidelity compare to the Stanford CDSMP model? Are there common adaptations being made at AoA supported sites? Are there adaptations which specifically improve the applicability of the CDSMP to seniors (age 60+) with chronic diseases?
3. What are program completion rates, in general and by important sub-groups? What barriers and supports affect the existing completion rates?
4. What data are AoA CDSMP grantees collecting and what is the state of their records systems? What is the evaluation capacity of state-level grantees and/or local sites including whether they have conducted or participated in program evaluations?
5. Have these grantees built sustainable statewide distribution and delivery systems which increase the availability of evidence-based self-management programs and provide an ongoing distribution channel for other evidence-based programs that may be delivered by community based organizations?
Evaluation findings will assist AoA in its continuing efforts to work with grantees to refine, bring to scale, and sustain CDSMP and other evidence-based prevention programs. Specifically, findings will guide improvements to partnership building, marketing and outreach, development of referral systems, ensuring program fidelity and quality, program evaluation, and financial viability.
2.2 Data Sources
The evaluation team used a mix of qualitative and quantitative data sources in conducting the process evaluation. A description of data sources follows.
Technical Advisory Committee (TAG) input. During telephone meetings convened on March 2, 2012, and July 20, 2012, the TAG provided valuable insights that informed development of the process evaluation design (see Appendix A for TAG members).
State survey on program sustainability.AoA provided the evaluation team with data from a state survey conducted in 2011 that examines six elements identified by AoA as central to a sustainable infrastructure and delivery system. The survey instrument, entitled Sustainable Infrastructure and
Delivery System Self-Assessment, is available at
Conference calls with AoA regional and program staff.AoA has central office staff and regional staff all of whom are involved in monitoring AoA’s CDSMP grantees. The project team held two calls with AoA regional staff to gain a better sense of the on-the-ground experience with CDSMP in order to inform a) site selection criteria, site selection, and the interview guide for the site visits, and b) discussion topics, participant selection, and the discussion guide for the telephone discussions conducted with key informants as part of the grant close-out process. The IMPAQ team held calls with the AoA Regional offices on November 9, 2011, and December 1, 2011.
Site visits.The evaluation team site visited CDSMP programs in six states in January-February 2012 to observe program implementation on the ground and inform development of the process evaluation. During the two-day visits to Arkansas, California, Kansas, New York, Tennessee, and Vermont, the evaluation team met with state lead agency staff, host sites, implementation sites, leaders, program participants, and other stakeholders. To select the six states for site visits, the team used data from AoA’s Sustainable Infrastructure and Delivery System Self Assessment to develop a system for ranking state performance and then selected a mix of states.6 The site visit guide, organized around six research domains that address the process evaluation research questions, is provided in Appendix B. A summary of site visit findings can be found in Appendix C.
Telephone discussions with key informants.The evaluation team conducted telephone discussions with state grantees, partners, and host sites over the three-month period April-June 2012 as part of AoA’s ARRA grant close-out activities. The discussions focused on program status, challenges and opportunities, and plans for sustaining the program when ARRA funding comes to an end. Telephone discussion topics can be found in Appendix D.
CDSMP program data. NCOA, the technical assistance contractor, manages a web-based data collection system that states use to upload data on CDSMP participants, workshops, and leaders each quarter. NCOA provided the evaluation team with a dataset consisting of program data about CDSMP sessions conducted by the 47 grantees during the ARRA grant period (April 2010 to March 2012).
Grantee reports. Grantees are required to submit quarterly progress reports and final reports to AoA. The reports follow a format outlined in AoA program guidance and document program goals, history, progress in reaching milestones, and other accomplishments. The evaluation team consulted the reports in preparing for site visits and prior to conducting grant closeout interviews with key informants.
2.3 Evaluation Approach
To address the five research questions for the process evaluation, we employed a multi-method approach using the multiple data sources described above. Our approach is depicted in Exhibit 2.1 and a description follows.
1. Consultations with stakeholders: As discussed in Section 2.2, we consulted with AoA program and regional staff and the TAG to inform the process evaluation design, planning for the site visits, and planning for the key informant telephone discussions. 2. Site visits to six states: We mapped the five research questions to the research
domains listed below. Then, within each domain, we developed a series of questions and probes for site visit interviews with state grantee agency staff, representatives from host and implementation sites, CDSMP participants, and other stakeholders. See the interview guide in Appendix B. The site visit report can be found in Appendix C. Site visit findings were used to guide planning for the key informant telephone interviews.
S.No. Research Domains
1 CDSMP Populations, Marketing/Recruitment 2 Site Implementation
3 CDSMP Eligibility, Enrollment, and Completion 4 Data Collection
5 Statewide Distribution and Delivery System 6 Consumer and System-Level Environment
3. Telephone interviews with key informants: For the one-hour telephone discussions with groups of key informants representing each of the 47 state grantees that were conducted as part of the grant closeout process, we developed an abbreviated list of questions that mapped to the five research questions. The questions focused on the current landscape for CDSMP versus anticipated changes in the post-ARRA funding environment in order to assess the current status of each program and prospects for sustainability. The interview guide can be found in Appendix D. The evaluation team consolidated and analyzed interview notes by research domain.
4. Analysis of NCOA program data: The dataset provided by NCOA included information, by state grantee, on program participants, workshops, and leaders. We designed a data analysis plan that enabled us to use these quantitative data to complement the qualitative data and address, to the extent possible, the research questions for the process evaluation. Specifically, we examined CDSMP participant characteristics, program completion rates, workshop size and location, and leader experience. In addition to a descriptive analysis, we designed a series of regression analyses to examine the influence of multiple factors on workshop completion, such as participant characteristics, workshop size and location, and differences in funding history among state grantees.
In the following chapters, we describe the CDSMP programs in grantee states and discuss findings of our quantitative and qualitative data analyses related to populations served, program implementation, completion rates, evaluation capacity, and prospects for sustainability. We conclude with a summary of best practices and recommendations.
CHAPTER 3: CHARACTERISTICS OF ARRA-FUNDED STATE GRANTEES
Key Findings1. The lead agency in the majority of states is the state unit on aging. In two-thirds of the ARRA-funded states, the lead agency is the state unit on aging. The department of health is the state lead for one-third of the states.
2. Grant awards varied by state. Grant awards totaled $27 million; awards to states ranged from $50,000 to $1.19 million.
3. All but one state met their goals for the number of participants and completers. ARRA grantees agreed to goals at the outset of their awards that were based on the number of Medicare beneficiaries in each state. Only one grantee did not achieve their goals during the two-year grant period or during a no-cost extension. Nine grantees exceeded their goals by more than 200 percent.
3.1 Introduction
Forty-seven grantees7—45 states, the District of Columbia, and Puerto Rico—received ARRA funding under the Communities Putting Prevention to Work: Chronic Disease Self-Management
Program. This chapter presents information on funding levels, funding history, and the number
of CDSMP participants and completers in each grantee state. While our analysis does not extend to a regional analysis, the exhibits below do designate the 10 AoA regions in the event AoA is interested in comparing regions.
For the analyses below and in the chapters that follow, the NCOA database was our primary source for quantitative data. Because our process evaluation is limited to CDSMP, we eliminated two grantees from the sample for our quantitative analysis in Chapters 4 and 6— Delaware and the District of Columbia. These grantees chose not to implement CDSMP with their ARRA funding but instead developed Diabetes Self-Management Programs (DSMP).
3.2 Grantee Characteristics
As shown in Exhibit 3.1, the lead agency for 30 state grantees is the state unit on aging. The department of public health is the lead agency for 15 grantees, including a small cluster of western mountain states—Idaho, Utah, Colorado, New Mexico, and Arizona—with large rural populations.
Exhibit 3.1. States Receiving ARRA Grants for CDSMP in 2010
Exhibit 3.2 shows the amount of the funding awarded to each grantee. Awards ranged from $50,000 for Alaska and the District of Columbia to $1,190,610 for the State of New York. Eleven grantees received awards of $1 million or more: California, Florida, Illinois, Massachusetts, Michigan, New York, North Carolina, Ohio, Pennsylvania, Texas, and Virginia.
Exhibit 3.2. Funding Awarded to ARRA Grantees in 2010
Grantee Amount Grantee Amount Grantee Amount
Alabama $600,000 Kentucky $600,000 Ohio $1,000,000 Alaska $50,000 Louisiana $400,000 Oklahoma $400,000
Arizona $600,000 Maine $200,000 Oregon $478,873
Arkansas $400,000 Maryland $600,000 Pennsylvania $1,000,000 California $1,000,000 Massachusetts $1,141,783 Puerto Rico $400,000 Colorado $452,582 Michigan $1,106,479 Rhode Island $200,000 Connecticut $400,000 Minnesota $600,000 South Carolina $750,000 Delaware $100,000 Mississippi $400,000 Tennessee $800,000
DC $50,000 Missouri $632,864 Texas $1,000,000
Florida $1,000,000 Nebraska $200,000 Utah $298,660
Georgia $905,164 Nevada $200,000 Vermont $100,000
Hawaii $200,000 New Hampshire $200,000 Virginia $1,046,084 Idaho $200,000 New Jersey $974,835 Washington $652,582
Grantee Amount Grantee Amount Grantee Amount
Illinois $1,000,000 New Mexico $252,583 West Virginia $400,000 Indiana $600,000 New York $1,190,610 Wisconsin $810,328 Kansas $400,000 North Carolina $1,006,573 Total: $27,000,000
Source: Administration on Aging
Over the two-year period April 2010 to March 2012, 89,861 individuals participated in CDSMP workshops in grantee states. This includes 57,870 adults aged 60 and older, 22,043 individuals under age 60, and 9,948 of unknown age.
Exhibit 3.3 shows the total number of CDSMP participants of all ages in each state during the two-year grant period. More heavily populated states—such as California, Oregon, Florida, Michigan, Illinois, Ohio, Pennsylvania, New York, and New Jersey—each served more than 3,000 participants. Less populated states with large rural populations like Arkansas, Colorado, Maine, Nebraska, Nevada, and West Virginia typically served fewer than 1,000 participants. Exhibit 3.4 shows a similar pattern for the number of individuals completing CDSMP in each state.
Exhibit 3.4. ARRA Grantees: Number of CDSMP Completers, April 2010 to March 2012
Exhibit 3.5 shows the state grantees that met the goals they agreed to at the outset of their awards for the number of CDSMP participants and completers of all ages (e.g., individuals both older and younger than age 60). These goals were set based on the total number of Medicare beneficiaries in each state.8 State grantees achieving their goals during a no-cost extension to their ARRA grants (i.e., after March 2012) are indicated separately. It is worth noting that nine states exceeded their goals by more than 200 percent.
8 For Medicare data used to set state goals, see U.S. Administration on Aging. American Recovery and
Reinvestment Act, Communities Putting Prevention to Work, Chronic Disease Self-Management Program: Program Announcement for Cooperative Agreements. 2009, December 16.
Exhibit 3.5. ARRA Grantees Meeting Goals for Number of Participants and Completers, April 2010 to March 2012
CHAPTER 4: POPULATIONS SERVED BY CDSMP
Research Question 1: Who do AoA CDSMP grantees serve? How to individuals served through AoA’s CDSMP grants compare with populations studied through other CDSMP evaluations?
Key Findings
1. ARRA grantees provided CDSMP to nearly 90,000 participants. During the two-year ARRA grant period, 22,043 individuals under age 60, 57,870 individuals aged 60 and older, and 9,945 individuals of unknown age participated in CDSMP workshops in grantee states, for a total of 89,861 participants. 2. Disproportionately more CDSMP participants were served by state units on aging. Eighty percent of
participants were enrolled in CDSMP operated by state units on aging; 20 percent participated in programs operated by public health departments, while only two-thirds of grantees were state units on aging.
3. The majority of participants attended workshops in metropolitan areas. Seventy-nine percent of participants attended workshops in metro areas; 21 percent participated in workshops in non-metro areas.
4. Participants were largely white and female, although grantees were targeting more diverse populations. Among those aged 60 and older, 72 percent of participants were female, just over half were white, and 15 percent were African American. Many state grantees reported targeting special populations, particularly Latinos, Asians, and Native Americans.
5. On average, participants reported 2.44 chronic conditions. However, women reported more chronic conditions than men (an average of 2.51 for women; 2.17 for men). Hypertension/high blood pressure and arthritis/rheumatic disease were the most commonly reported chronic conditions for participants aged 60 and older. Rates of cancer, heart disease, stroke, and osteoporosis tended to increase with increased age. Depression or anxiety disorders and diabetes tended to be more prevalent among those younger than age 60 and those aged 60 to 64, with rates decreasing with age thereafter.
4.1 Introduction
AoA’s primary target population is individuals aged 60 and older. In addition to this primary target population, AoA encouraged CDSMP grantees to reach older adults within diverse populations. As described in the Request for Proposals (RFP) to potential grantees, AoA required grantees “to reach a broad population and demonstrate their capacity and ability to achieve health equity among disparately effected populations.”9 Grantees were also “expected to coordinate with tribal entities in their jurisdiction… and give special attention to serving low-income, minority, and limited English-speaking seniors.”
9 U.S. Administration on Aging. American Recovery and Reinvestment Act, Communities Putting Prevention to
Work, Chronic Disease Self-Management Program: Program Announcement for Cooperative Agreements. 2009, December 16.
This chapter describes who AoA grantees served during the ARRA grant period, with a particular focus on age, ethnic/racial groups, metro versus non-metro populations, and reported chronic conditions. Because AoA-funded CDSMP is intended to target individuals aged 60 and older, AoA was interested in learning the extent to which grantees actually served older adults. AoA was also interested in comparing the populations served by grantees to populations studied in prior evaluations to better understand the extent to which the findings from other evaluations can be generalized to populations served by AoA grantees.10
Data sources used to identify and describe populations served by ARRA grantees include AoA and NCOA data and reports, site visits, key informant interviews, and grantee reports. Our analysis of NCOA data examines only CDSMP (not the Diabetes Self-Management Program, or Arthritis Self-Management Program). Two grantees receiving ARRA funding but only implementing DSMP are therefore not included in the data analysis: Delaware and the District of Columbia.
4.2 Characteristics of CDSMP Participants
The tables below present characteristics of CDSMP participants based on NCOA data. These data illustrate who AoA CDSMP grantees served while receiving ARRA funding. Appendix E provides data on CDSMP participants by AoA region.
ARRA grantees operated CDSMP either under their state’s aging or public health agency. As shown in Exhibit 4.1, 80 percent of CDSMP participants (63,741) were enrolled in programs offered by aging agencies and 20 percent (16,172) participated in programs operated by public health agencies. Though public health agencies served fifth of CDSMP participants, one-third of grantees operated CDSMP through their public health agency. This difference may be because public health agencies tended to be the lead in states with lower populations and a higher proportion of rural residents. Within each age group (under age 60 and aged 60 and older), the percentages were similar for those enrolled in aging- versus public health-led programs.
Specifically, 72 percent of CDSMP participants were aged 60 and older (57,870 of 79,913 participants). Of the total number served by states with aging leads, 73 percent were 60 years of age and older; among those served by public health leads, 71 percent were aged 60 or older.
10 Findings from an evaluation design report conducted by IMPAQ under a prior contract reviews CDSMP populations studied in other evaluations.10 The mean age of participants in a majority of the studies was 60 years and older. However, many of the programs that were studied included adults under the age of 60. For example, Goeppinger et al. (2007) included adults 18 years of age and over in a comparative study of a small arthritis education program and traditional CDSMP and Gordon’s review of the CDSMP literature (Gordon, 2008) shows that many U.S. CDSMP programs include middle-aged adults (i.e., 40 years old and older). The participant samples described in the studies were predominately white and female, with a majority of study groups consisting of 60 percent or more females and 80 percent or more whites. In addition, a majority of the studies required participants to have one or more chronic conditions in order to be included.
Exhibit 4.1. CDSMP Participants by Age and Type of Lead Agency Operating Program Lead Agency Participants Under Age 60 Percent of Participants Under Age 60 Participants Age 60+ Percent of Participants Age 60+ Participants Total Percent of Participants Total Aging 17,408 79% 46,333 80% 63,741 80% Public Health 4,635 21% 11,537 20% 16,172 20% Total 22,043 100% 57,870 100% 79,913 100%
Note: Excludes participants with missing date of birth. Source: NCOA data
Exhibit 4.2 shows CDSMP participants by age group and sex. Across all age categories, CDSMP participants were more likely to be female. The percentage of female participants tends to increase slightly with age. Interestingly, males constituted a larger portion of participants in the younger than 60 age group than in other age categories.
Exhibit 4.2. CDSMP Participants by Sex
Note: Excludes participants with missing date of birth. Source: NCOA data
Total number of CDSMP participants by age group is as follows:
Age <60 60-64 65-74 75-84 85+ Total Total participants 22,043 9,717 23,044 18,165 6,944 79,913
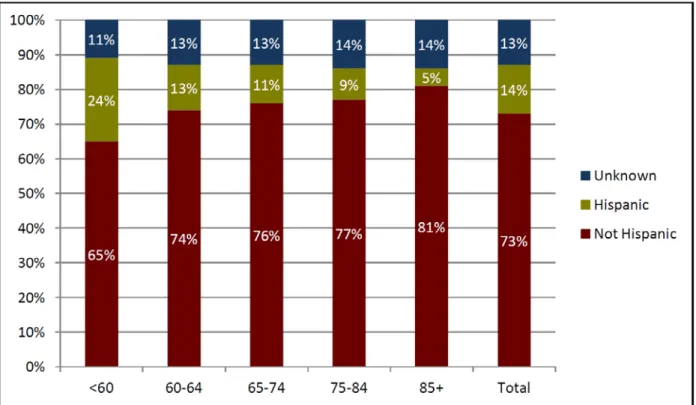
Exhibit 4.3 shows CDSMP participants by ethnicity. The proportion of those who identify as Hispanic or Latino tends to decrease as age increases. Twenty-four percent of participants younger than 60 identified as Hispanic or Latino, while only five percent of participants older than 85 identified as Hispanic or Latino.
Exhibit 4.4 shows CDSMP participants by race. White or Caucasian participants are the most numerous across all age groups, followed by African Americans. Exhibit 4.4 illustrates how the proportion of minority participants steadily declines as age increases. In the aged 85 and older group, almost three-quarters of participants are white. This could reflect the longer life expectancies of whites, as well as health and income disparities that tend to disadvantage people of color and could make participation more problematic.
Table 4.3. CDSMP Participants by Ethnicity
Note: Excludes participants with missing date of birth. Source: NCOA data
Total number of CDSMP participants by age group is as follows:
Age <60 60-64 65-74 75-84 85+ Total Total participants 22,043 9,717 23,044 18,165 6,944 79,913