Publication date Statistics Netherlands website: 8 November 2010
Noortje Urlings, Fintan van Berkel
9
10
Turnover and output
measurement for the
cleaning activities and
facilities services in
Centre for Policy Related Statistics
Publisher Statistics Netherlands Henri Faasdreef 312 2492 JP The Hague PrepressStatistics Netherlands - Grafimedia
Cover
TelDesign, Rotterdam
Information
Telephone +31 88 570 70 70 Telefax +31 70 337 59 94
Via contact form: www.cbs.nl/information
Where to order E-mail: verkoop@cbs.nl Telefax +31 45 570 62 68 Internet www.cbs.nl ISSN: 1877-3036
© Statistics Netherlands, The Hague/Heerlen, 2010.
Reproduction is permitted. ‘Statistics Netherlands’ must be quoted as source. Explanation of symbols
. = data not available
* = provisional figure
** = revised provisional figure
x = publication prohibited (confidential figure) – = nil or less than half of unit concerned
– = (between two figures) inclusive
0 (0,0) = less than half of unit concerned
blank = not applicable
2008–2009 = 2008 to 2009 inclusive
2008/2009 = average of 2008 up to and including 2009
2008/’09 = crop year, financial year, school year etc. beginning in 2008 and ending in 2009 2006/’07–2008/’09 = crop year, financial year, etc. 2006/’07 to 2008/’09 inclusive
Table of contents
Introduction 4
1. Definition of service being collected 5
1.1 Classifications 5
1.2 Facilities services 5
1.3 Cleaning activities 5
2. Unit of measure to be collected 7
3. Market conditions and constraints 8
3.1 Market conditions and constraints in the Dutch cleaning business 8
3.2 Statistics on cleaning activities in the Netherlands 9
3.3 Figures on cleaning activities in the Netherlands 9
4. Standard classification structure and product detail/levels 13
5. Evaluation of standard vs definition and market conditions 14
6. National Accounts concepts and measurements issues for cleaning
activities related GDP meausurement 15
7. Turnover/output data method(s) and criteria for choosing various
output methods 16
8. Comparability of turnover/output data with price index practices 17
4
Introduction
The aim of this paper is to describe the turnover and output measurement for the cleaning activities and facilities services in the Netherlands. We begin by describing the classifications (paragraph 1.1) and the definition of the service (paragraphs 1.2 and 1.3). Then, we have a closer look on the unit of measure to be collected (chapter 2). In chapter 3 we explain market conditions and constraints (paragraph 3.1), along with statistics and figures on the cleaning activities (paragraph 3.2 and 3.3). The standard classification structure and product detail/levels are discussed in chapter 4. After that, we evaluate the standard versus definition and market conditions (chapter 5). For the bigger picture we discuss National Accounts concepts and measurement issues for the cleaning activities related to GDP measurement in chapter 6. The chapters7 and 8 are closely related. In the 7th chapter we begin by describing turnover/output data method(s) and criteria for choosing various output methods. Subsequently we have a closer look at the comparability of turnover/output data with price index practices in the 8th chapter. We end this paper with a summary (chapter 9).
The ideas expressed in this paper are the opinionsof the authors and donotnecessarily represent the views of Statistics Netherlands.
1. Definition of service being collected
1.1 Classifications
The ISIC (International Standard Industrial Classification of all economic activities) is used in many countries. All countries within the European Union work with the NACE classification (Nomenclature statistique des Activités économique dans la Communauté Européenne). NACE and the ISIC have the two first digits of the classification in common; the third and fourth may differ. The SBI (Standard Industrial Classification) is used in the Netherlands. SBI and NACE have the first four digits in common. The fifth digit is a Dutch differentiation.
1.2 Facilities services
The facilities activities are a very diverse branch and include technical maintenance, postal services, reception and so on. In the old NACE classification (Rev. 1.1) the facilities services were not a specific category. The new NACE classification (Rev. 2) does have a specific category for the facilities services: NACE 8110. Since the new classification has only been used for a short period, we do not have a population of facilities services enterprises at the moment. That is why we will focus only on cleaning activities in this paper.
1.3 Cleaning activities
There is detailed information on cleaning activities available at the national level, as is shown in table 1. This table shows the old classification. The cleaning activities (NACE 7470) include all types of cleaning activities. Besides the regular window cleaning and cleaning of offices, schools and hospitals (SBI’93: 74701), the branch also includes fire and soot cleaning, cleaning in manufacturing, façade cleaning and cleaning of means of transport such as buses, trains and airplanes (SBI’93: 74702).
In 2008, the NACE was revised. Because of the growing significance of services industries for the national economies they receive far more attention, and are shown in more detail in the statistics.
The classification distinguishes general cleaning of buildings, other building and industrial cleaning activities, and other cleaning activities (see table 2). This new classification will suit the information needs better than the old one. So far, only statistics on business demography (SBS) and short-term business statistics on turnover have switched to NACE Rev. 2. Table 1
Cleaning activities and related activities according to the old SBI, NACE and ISIC classification ISIC Rev. 3.1 NACE Rev. 1.1 SBI’93 Description
7493 7470 7470 Cleaning activities
74701 General cleaning of buildings
74702 Other building and industrial cleaning activities
Table 2
Cleaning activities and related activities according to the current SBI, NACE and ISIC classification ISIC Rev. 4 NACE Rev. 2 SBI’08 Description
812 812 812 Cleaning activities
8121 8121 8121 General cleaning of buildings
8129 8122 8122 Other building and industrial cleaning activities
6
To get an idea about the magnitude of the cleaning activities in the Netherlands we provide an overview of the main variables (see table 3). We also compare the cleaning activities with the whole of business services. On January 1, 2008 the cleaning activities consisted of 7 thousand enterprises. This represents 4.4 percent of all enterprises in the business services. The cleaning branch employs almost 165 thousand people (17.5 percent of total business services), 99 thousand FTE (14.5 percent) and has a turnover of 4.7 billion euro (5.3 percent) a year. In chapter 3 we will discuss the market conditions in more detail.
Table 3
Overview of the cleaning activities in the Netherlands
Cleaning activities Business services Share cleaning activities in total business services % Number of enterprises 7,040 158,645 4.4 Employees 164,600 940,800 17.5 FTE’s 99,000 681,700 14.5
Turnover (million euro) 4,696 87,909 5.3
Turnover per person employed in FTE’s (euro) 47,434 128,955 . Source: Structural Business Statistics 2008, NACE Rev. 1.1
2. Unit of measure to be collected
Turnover is measured as net turnover: proceeds from sales, exclusive of value-added tax (VAT), after deducting discounts, premiums, deposits and freight charges. The enterprise is used as statistical unit; where at least one person works 15 hours a week or more. For the cleaning activities we use direct data collection, by means of electronic and (a decreasing amount of) paper questionnaires. In the near future we will use tax data for small enterprises instead of questionnaires. We have positive experiences with the use of tax data in other NACE categories.
8
3. Market conditions and constraints
3.1 Market conditions and constraints in the Dutch cleaning business
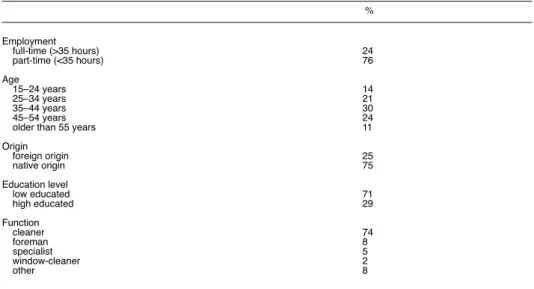
The Netherlands has approximately 165 thousand cleaners, mostly women with little education. Some have multiple jobs in the branch. Most cleaners work for large companies.
Table 4 shows specific characteristics of the workforce in the cleaning business.
The cleaning companies have been engaged in a fierce competition for several years. They cut their prices in order to win contracts. Now clients are less willing to pay much for cleaning. The low price is recovered by letting cleaners do more work in less time. This has created an imbalance, because the cleaners wanted higher wages while the contractors did not want to pay more for the same work. The working conditions and quality deteriorated. All this led to a strike that lasted for almost nine weeks, the longest strike in the Netherlands since 1933. Finally, a structural wage increase of 3.5 percent was agreed in the new collective labour agreements1).
The image of the branch is important. In the new collective labour agreements it is also agreed to invest more in skills of the cleaners2). New workers in the cleaning business
must follow professional training and, if necessary, a course in Dutch – one on four cleaners is foreign (see table 4). Foreign workers often take a job in cleaning at the start of their career. Besides this, cleaners nowadays work more during office hours rather than at night. So they are more visible. This leads to a greater understanding by contractors, cleaners and others3).
Other trends in cleaning
Large cleaning companies made joint ventures with home care to strictly separate cleaning from care. This will give companies lower overhead and the staff more flexible schedules4).
The importance of sustainability in the cleaning business increases. Environmental Certification, obtaining an ecolabel and preparing a sustainability report are growing trends. Also, having cleaners work more during office hours instead of at night significantly cuts energy consumption and costs5).
1) NRC Handelsblad (2010, 22 April), Schoonmakers stoppen staking na cao-akkoord. 2) FNV (2009, December), Schoon genoeg!
3) FD (2010, 31 May) Gezamelijke inkoop gezondheidzorg mislukt.
4) www.zorgvisie.nl/Nieuws/Artikel/Schoonmaak-en-thuiszorg-smeden-allianties.htm,
(2007, 24 April).
5) SenterNovem (2008, 21 October), Criteria voor duurzaam inkopen van schoonmaak.
Table 4
Specific characteristics of the workforce in cleaning
% Employment full-time (>35 hours) 24 part-time (<35 hours) 76 Age 15–24 years 14 25–34 years 21 35–44 years 30 45–54 years 24
older than 55 years 11
Origin foreign origin 25 native origin 75 Education level low educated 71 high educated 29 Function cleaner 74 foreman 8 specialist 5 window-cleaner 2 other 8
3.2 Statistics on cleaning activities in the Netherlands
The statistical information on cleaning activities published in the Netherlands consists of:
Structural Business Statistics (SBS)
These are annual statistics on business demography, employment, turnover and costs. The statistics are available for NACE Rev.1.1. For the year 2008 business demography is also available for NACE Rev. 2.
Short-Term business Statistics (STS)
These are quarterly statistics on turnover, vacancies and output prices. Statistics on turnover have already switched to the NACE Rev. 2. These statistics are available for the NACE 812 and 8121. Vacancies and producer prices provide information on the old NACE 7470. Output prices are also available on the five digit category of the national level. Since there are European regulations on both structural and short-term business statistics, comparable statistics are available in all countries of the European Union, and coordinated statistical information is available on the website and in the publications of Eurostat.
Business Tendency Survey
This is a survey in which entrepreneurs in the cleaning activities are asked to give their opinions on orders, the economic climate, and indications of recent developments and expectations, with respect to orders, turnover, prices and personnel. We publish statistics on monthly basis for the old NACE 7470.
Working population
This is a yearly survey on jobs of employees. This survey is available for the old NACE 7470. The figures are based on the Policy Administration of Employee Insurance Agency.
National Accounts
The National Accounts provide information on production, intermediate consumption and value added for the old NACE 7470 on an annual basis.
Many countries all over the world use the SNA (System of National Accounts, developed by EC, Eurostat, IMF, OECD and UN, under the auspices of the inter-secretariat working group on National Accounts). In the European Union the ESA (European System of national and regional Accounts) is used. It is largely consistent with SNA, but it incorporates some differences, particularly in its presentation.
3.3 Figures on cleaning activities in the Netherlands Structural Business Statistics
On January 1, 2009 a total number of 7 600 enterprises were active in cleaning activities in the Netherlands (see graph 1). Over the past three years the number of companies in other building and industrial cleaning activities (NACE 8122) and in other cleaning activities (NACE 8129) have both grown around 10 percent. The number of companies in general cleaning of buildings (NACE 8121) grew even faster. In 2009 the number of companies in that underlying branch was well over one fifth higher than in 2006. At the same time, the total number of enterprises in cleaning activities grew by 17 percent.
Some 86 percent of all enterprises in cleaning employed one to ten people and 11 percent employed ten to fifty people. Only 3 percent of the enterprises employed over 50 people on 1 January 2009. In the underlying branches the shares are generally comparable with those of the aggregated branch. Other building and industrial cleaning activities had the relatively largest share (91 percent) of companies employing one to ten people. Companies employing ten or more people were most prevalent (17 percent) in the general cleaning of buildings.
The general cleaning of buildings represents around 85 percent of total turnover (see table 5). Personnel costs are relatively high compared to the personnel costs in the other
10
number of people employed. General cleaning of buildings employs about twenty times more people than other building and industrial cleaning activities. However, in FTE’s, this factor is only fourteen times. Apparently employees have more part-time jobs in the general cleaning of buildings than in the other building and industrial cleaning services.
In general the other building and industrial cleaning activities have to be done by specialists. That is why the personnel costs per person employed (in FTE’s) are slightly higher than in the general cleaning of buildings. On the other hand, because of their more specialist work, employers in other building and industrial cleaning activities generate much more turnover per person employed (in FTE’s) than the general cleaners of buildings.
1. Number of enterprises in cleaning activities in the Netherlands 2006–2009
8121 General cleaning
of buildings 8122 Other building andindustrial cleaning activities 8129 Other cleaningactivities Source: Structural Business Statistics, NACE Rev. 2.
0 1,000 2,000 3,000 4,000 5,000 6,000 7,000 8,000 2009 2008 2007 2006 Table 5
Results from the Structural Business Statistics for cleaning activities in the Netherlands 2007, NACE Rev. 1.11)
747 Cleaning activities 74701 General cleaning of
buildings 74702 Other building and industrial cleaning activities
Turnover, net million euro 4,222 3,649 573
Personnel costs million euro 2,476 2,250 226
Persons employed, annual average x 1000 188.0 180.0 8.7
Persons employed, annual average in FTE’s x 1000 99.6 93.0 6.6
Turnover per person employed in FTE’s euro 42,390 39,237 86,818
Personnel costs per person employed in FTE’s euro 24,859 24,194 34,242
1) The 2008 results for the other building and industrial cleaning activities were not reliable. We used the 2007 results to give more detailed information on the cleaning
activities.
2. Shares of male-female workers in the cleaning activities in 2008
Female Male
Source: Policy Administration of Employee Insurance Agency, NACE Rev. 1.1.
% 0 20 40 60 80 100
74702 Other building and industrial cleaning activities 74701 General cleaning
of buildings 747 Cleaning activities
Working population
The share of women is still increasing in the total Dutch economy. The cleaning activities are following this trend – the share of female workers has increased from 61 to 66 percent in 2006-2008. This increase is caused by a nearly equivalent increase in the underlying branch general cleaning of buildings. The share of women in the other building and industrial cleaning activities fell by 1 percent in 2006-2008. These seem to be typical male activities because they are specialized and physically demanding. In 2008 only 18 percent was a woman there (see graph 2).
Short-Term business Statistics
The short-term business statistics reveal turnover changes on a quarterly basis. They are the essential basic input for the first flash figures on economic growth. In table 6 we give the results from the short-term business statistics of the cleaning activities for the period 2006– 2010. The cleaners achieved their strongest turnover growth in the third quarter of 2006. In that quarter turnover increased almost 10 percent on the same quarter of 2005. The highest index figure was reached in the fourth quarter of 2008. In the comparable quarter one year later the cleaners registered the first decline in turnover since the start of the series. In the first quarter of 2010 turnover declined by 5 percent. It is typical that the general cleaners of buildings did relatively worse in this quarter for the first time since the start of the economic crisis than the cleaning activities as a whole. Looking at the total business services, cleaning activities perform better than average. This has been the trend ever since the economic crisis started. Apparently cleaning activities are less sensitive to the economic situation than other business services – after all, buildings must be cleaned. However, a higher bankruptcy rate can pose a threat for the cleaning activities, as more buildings are not in use.
Business Tendency Survey
We derive the most up-to-date information on turnover from our business tendency survey. In this monthly survey Statistics Netherlands asks entrepreneurs to indicate whether turnover, prices and personnel are increasing, stable or decreasing, to evaluate the economic climate and to give their expectations for the coming three months. The results of this survey are shown in table 7.
Entrepreneurs were most optimistic in 2007. From the third quarter of 2008 onwards - the start of the economic crisis - the cleaners were quite pessimistic. Especially the development and expectations about personnel, and the evaluation of the economic climate have shown large numbers of negative responses. The (extremely) negative developments and expectations for turnover seem to be more occasional.
Table 6
Indices of turnover of the cleaning activities in the Netherlands and their year-on-year changes, 2006- 2010 812 Cleaning activities 8121 General cleaning of buildings
turnover index year-on-year changes turnover index year-on-year changes
2005 = 100 % 2005 = 100 % 2006 Q1 96 3.1 97 7.3 2006 Q2 106 5.7 104 3.9 2006 Q3 108 9.8 107 7.5 2006 Q4 118 8.0 119 7.9 2007 Q1 104 8.5 105 8.7 2007 Q2 111 4.8 110 5.4 2007 Q3 110 2.2 109 2.1 2007 Q4 121 2.8 121 2.3 2008 Q1 111 7.0 110 5.2 2008 Q2 118 6.8 117 6.0 2008 Q3 119 7.8 117 7.5 2008 Q4 129 6.5 129 6.3 2009 Q1 116 4.6 118 7.0 2009 Q2 119 0.4 120 2.7 2009 Q3 121 2.1 122 3.8 2009 Q4 126 –2.5 127 –1.3 2010 Q1 110 –5.0 111 –6.0
12
Table 7
Results from the Business Tendency Survey for cleaning activities in the Netherlands 2006–2010, NACE Rev. 1.1
Evaluation Development Expectations
economic
climate turnover personnel turnover personnel prices
% of optimistic entrepreneurs minus % of pessimistic entrepreneurs
2006 Q1 –12 –14 4 34 28 –1 2006 Q2 –8 28 6 21 13 2 2006 Q3 2 11 8 29 31 5 2006 Q4 18 32 12 13 15 46 2007 Q1 10 52 16 27 17 4 2007 Q2 7 45 25 27 26 0 2007 Q3 27 26 5 23 10 4 2007 Q4 0 1 –6 64 11 74 2008 Q1 1 9 15 11 26 46 2008 Q2 –4 43 17 19 22 –5 2008 Q3 –39 –2 18 –13 –31 –6 2008 Q4 –66 9 –24 –3 –18 87 2009 Q1 –66 –13 –24 0 –13 16 2009 Q2 –63 10 –4 –2 –19 –2 2009 Q3 –52 9 –21 –33 –35 –2 2009 Q4 –20 3 –23 11 10 48 2010 Q1 7 –31 –9 38 –8 25
4. Standard classification structure and product detail/levels
There is no further breakdown into product categories in the annual structural business statistics, nor in the short-term business statistics.
14
5. Evaluation of standard vs. definition and market conditions
In table 8 we broke down the main variables from the structural business statistics into size classes to see which type of companies dominate the cleaning activities. Again the outcomes of the cleaning activities as a whole and the outcomes of the underlying branch general cleaning of buildings are almost equal. However, we saw some interesting differences between the cleaning branches. In the general cleaning of buildings large enterprises account for around a half in business turnover, employees, personnel costs and operating costs. Medium enterprises active in this underlying branch contribute for the least in the variables mentioned. Looking at the other building and industrial cleaning activities, the shares of the types of enterprises are more widespread. Nevertheless, the small enterprises have a much bigger share of the persons employed than the large ones. The personnel and operating costs concerned, micro enterprises account for far less than the other types.
We also calculated the turnover and personnel costs per person employed (in FTE’s) for the different types (see table 9). For the cleaning branch as a whole the results of those calculations were almost in proportion. Only the personnel costs per person employed in micro enterprises were half of those in the other types. This has to do with the presence of self-employed professionals in the micro enterprises. If we have a closer look on the underlying branches, it is typical that turnover per employed person (in FTE’s) is the lowest in large general cleaning of buildings companies. The large enterprises in the other building and industrial cleaning activities generate by far the highest turnover per person employed. Table 8
The shares of micro, small, medium and large enterprises1) in the cleaning activities in the Netherlands
Enterprises
micro small medium large
% 747 Cleaning activities
Business turnover, net 19 24 14 42
Persons employed, annual average 15 20 14 50
Persons employed, annual average in FTE’s 20 22 13 44
Personnel costs 12 23 14 51
Operating costs 15 25 15 45
74701 General cleaning of buildings
Business turnover, net 19 23 12 44
Persons employed, annual average 15 19 13 52
Persons employed, annual average in FTE’s 19 21 12 46
Personnel costs 12 22 13 53
Operating costs 14 24 13 47
74702 Other building and industrial cleaning activities
Business turnover, net 22 25 24 27
Persons employed, annual average 23 40 21 14
Persons employed, annual average in FTE’s 25 30 24 19
Personnel costs 12 28 27 31
Operating costs 17 27 26 28
Source: Structural Business Statistics 2007, NACE Rev. 1.
1) Companies are broken down into Micro: 1 to 10, Small: 10 to 50, Medium: 50 to 200 and Large: 200 or more persons
employed. Companies without personnel are excluded.
Table 9
Turnover and personnel costs per person employed (FTE’s) in the micro, small, medium and large enterprises in the cleaning activities in the Netherlands
Enterprises
micro small medium large
euro
747 Cleaning activities
Turnover per person employed in FTE’s 41,794 46,152 45,337 39,969 Personnel costs per person employed in FTE’s 14,749 26,103 27,070 28,494 74701 General cleaning of buildings
Turnover per person employed in FTE’s 38,687 43,464 39,369 37,509 Personnel costs per person employed in FTE’s 14,591 25,456 25,375 27,677 74702 Other building and industrial cleaning activities
Turnover per person employed in FTE’s 75,444 72,720 87,316 124,953 Personnel costs per person employed in FTE’s 16,460 32,496 38,996 56,740 Source: Structural Business Statistics 2007, NACE Rev. 1.1
6. National Accounts concepts and measurements issues for cleaning
activities related to GDP measurement
The National Accounts provide statistical information on production, intermediate consumption and value added for the cleaning activities (see table 10). They use several source statistics to compile macro figures. The concepts used in these source statistics sometimes differ from concepts used in the National Accounts. The National Accounts estimate some items not covered by source statistics (e.g. illegal activities) and adjust the data so that everything fits. For this reason figures based on source statistics are not always exactly the same as the National Accounts figures.
Statistics Netherlands has had some problems with different outcomes on turnover changes. Table 11 compares the outcomes of three statistics on turnover changes for 2006-2008. The sign of the changes is the same, but the magnitude is not. These differences are caused by different goals of statistics, population shifts and estimates for illegal activities. With population shifts we mean companies added to the population of the cleaning activities, while they were not accounted for in the previous year(s). This will boost the turnover figure. The short-term business statistics as well as the National Accounts exclude these non-real population shifts.
In the near future we will use more tax data in the short-term business statistics. Then the turnover of the short-term business statistics will be used in the structural business statistics. Aim of this exercise is to reduce the difference between outcomes on turnover changes in the short-term business statistics and those in the structural business statistics. Table 10
Production, intermediate consumption and value added of the cleaning activities in the Netherlands 2006–2008 Production Intermediate
consumption Gross value added (market prices)
million euro
2006 4,524 1,396 3,129
2007 4,791 1,501 3,290
2008 5,161 1,581 3,580
Source: National Accounts, NACE Rev. 1.1
Table 11
Comparing turnover changes of three different statistics for the cleaning activities 2006–2008 Short-term business statistics Structural business statistics National Account 1)
%
2006 6.7 0.2 5.5
2007 4.4 6.2 5.9
2008 7.0 11.0 7.7
16
7. Turnover/output data method(s) and criteria for choosing various
output methods
Since Statistics Netherlands does not survey cleaning companies on their ‘volume changes’, we have to make an approximation (deflation) for this variable. In the cleaning activities monitor we subtract the producer price changes from the STS turnover changes. There is a quite good match between the populations of both statistics, even for the underlying branch general cleaning of buildings. The results are shown in chapter 8. Of course we know that an approximation of the volume changes is only the next best thing. If it were not for the administrative burden, we would definitely ask companies directly for this information.
8. Comparability of turnover/output data with price index practices
In table 12 we present the producer price indices and developments from the first quarter of 2006 onwards. Looking at the total industrial cleaning, the producer price has risen 10 percent in the last four years. Especially the industrial cleaning services (7470B) show some volatile yearly changes. The producer price of this underlying branch has risen almost 12 percent since the start of the series. With almost 10 percent the growth in the cleaning services (7470A) was less strong.
If we subtract the producer price changes from the STS turnover changes, we can estimate the volume changes in cleaning activities in the Netherlands. In graph 3 the volume changes are shown from the last quarter of 2006 onwards. Having a closer look on this graph, we see that the volume changes in the general cleaning of buildings (8121) seem to be less sensitive to the economic situation than those in the cleaning activities as a whole. It is typical that the developments in the first quarter of 2010 are the only exception to this rule. In the total branch the volume had a temporary stagnation in the last two quarters of 2007. The economic crisis had a negative influence on this volume after the third quarter of 2008. In the second quarter of 2009, there were less cleaning activities compared to the same period a year earlier for the first time.
Table 12
Producer Price Indices and their year-on-year changes for cleaning activities in the Netherlands 2006–2010, NACE Rev. 1.1
7470 Total industrial cleaning 7470A Cleaning services1) 7470B Industrial cleaning services
price index year-on-year changes price index year-on-year changes price index year-on-year changes
2006=100 % 2006=100 % 2006 = 100 % 2006 Q1 100.0 . 99.9 . 100.5 . 2006 Q2 99.9 . 100.0 . 99.2 . 2006 Q3 100.1 . 100.0 . 100.1 . 2006 Q4 100.0 1.7 100.0 1.9 100.2 0.4 2007 Q1 102.4 2.4 101.9 1.9 106.4 5.9 2007 Q2 102.4 2.5 101.9 1.8 106.4 7.3 2007 Q3 102.5 2.4 101.9 1.9 106.4 6.2 2007 Q4 102.4 2.4 101.9 1.9 106.0 5.8 2008 Q1 105.0 2.5 104.4 2.5 109.3 2.7 2008 Q2 105.7 3.2 105.0 3.1 110.4 3.8 2008 Q3 105.9 3.3 105.1 3.1 111.4 4.7 2008 Q4 106.2 3.6 105.2 3.3 112.5 6.2 2009 Q1 108.8 3.6 108.1 3.6 113.2 3.5 2009 Q2 108.9 3.0 108.2 3.1 113.6 2.9 2009 Q3 109.0 2.9 108.4 3.2 113.0 1.4 2009 Q4 108.9 2.6 108.3 2.9 113.1 0.2 2010 Q1 110.0 1.1 109.7 1.4 112.2 –0.9
1) Except industrial cleaning services
3. Volume changes of cleaning activities in the Netherlands 2006–2010
year-on-year-changes % I IV III II I IV III II I IV III II I IV ’06 2007 2008 2009 ’10 –10 -8 -6 -4 -2 0 2 4 6 8
18
9. Summary
In the Netherlands the cleaning activities are an important branch within business services – 17.5 percent of all the employees works in this branch. At the national level we had already split the cleaning activities into ‘other building and industrial cleaning activities’ and “general cleaning of buildings”. The NACE revision of 2008 has led to even more detail in our statistics on the cleaning branch.
Since Statistics Netherlands does not survey cleaning companies about the ‘volume changes’, we have to make an approximation (deflation) for this variable. The producer prices are on hand and match quite well with the short-term business statistics, even for the underlying branches. A subtraction of the producer price changes from the STS turnover changes is only the next best thing to approximate the volume changes. Unfortunately we cannot ask companies directly for ‘volume changes’, because of the administrative burden.
As for the facilities services, we do not have a population. Maybe the use of tax data can give us more information on active enterprises in the facilities services. Another aim of the use of tax data will be reducing the difference between outcomes on turnover changes in the short-term and the structural business statistics, and the National Accounts.