Traffic in the Cities Preliminary Communication Submitted: 7 June 2018 Accepted: 4 Apr. 2019
ABSTRACT
The phenomenon of affordable housing emerges in Chi-nese cities to meet low-income residents’ living needs in the city. Because affordable housing projects tend to be located far away from the city centre, their residents tend to face long commuting times to go to work. Although several stud-ies have analysed commuting travel times, none have con-sidered the commuting pattern of residents living in these affordable housing projects. This study employs a decision tree classifier to examine the commuting time patterns of affordable housing residents, fusing the data from the 2010 Nanjing Household Travel Survey and supplementary data collected through Google maps. Results show that attributes of the built environment and distance to work are the factors mostly influencing commuting time patterns of affordable housing residents in Nanjing. The availability of a subway service, job type, household car ownership, job location, trav-el mode choice, and departure time have logical but varying effects on commuting trip duration. These results provide a better understanding of these residents’ commuting pat-terns and provide urban planners insights about the effects of their affordable housing policies on travel behaviour. KEY WORDS
affordable housing; travel behaviour; trip time duration; decision tree classifier; built environment;
1. INTRODUCTION
Affordable housing, a housing concept subsidized by the government, emerges in several Chinese cities to meet the explosive dwelling needs of urban resi-dents during the on-going process of urbanization, alleviating the housing inequality triggered by mar-ket-oriented housing reform. The McKinsey’s report [1] reported that approximately 13.4 million affordable housing units were built across China between 2012 and 2014. In 2016, Nanjing completed the construc-tion of affordable housing projects providing 39,153 affordable housing units to accommodate the grow-ing number of low-to-medium income households who cannot afford the spiralling housing prices at the overheating commercial housing market [2]. Local governments are partly responsible for these housing constructions and prefer developing the low-cost land at the urban fringe because of serious fiscal burdens [3]. Consequently, many affordable housing projects in China are located on the outer boundary of the cities such as Beijing, Nanjing, Shanghai, and Wuhan [4, 5]. Although the provision of affordable housing has solved the dwelling problem for these residents, it also created new problems. At the time of housing reloca-tion, the industries around the housing sites lacked
JINGXIAN WU, Ph.D.1 E-mail: wujingxian321@gmail.com MIN YANG, Ph.D.2 (Corresponding Author) E-mail: yangmin@seu.edu.cn SOORA RASOULI, Ph.D.3 E-mail: s.rasouli@tue.nl LONG CHENG, Ph.D.4 E-mail: chenglong010203@gmail.com
1 Department of Transportation Engineering
University of Shanghai for Science and Technology Jungong Road #516, Shanghai, 200093, P. R. China
2 School of Transportation
Jiangsu Key Laboratory of Urban ITS
Jiangsu Province Collaborative Innovation Center of Modern Urban Traffic Technologies
Southeast University, Road of Southeast University 2, Nanjing, 211189, P. R. China
3 Urban Planning Group
Eindhoven University of Technology
PO Box 513, 5600 MB Eindhoven, The Netherlands
4 Geography Department, Ghent University
Krijgslaan 281 S8, B-9000 Ghent, Belgium
INVESTIGATING COMMUTING TIME PATTERNS OF RESIDENTS
LIVING IN AFFORDABLE HOUSING: A CASE STUDY
closely associated with residents’ commuting times [11, 12, 14-18]. Increased commuting time in the US context mainly resulted from the spatial mismatch be-tween job location and affordable housing locations. However, socio-demographic characteristics, housing reform, and transport mode have influence on com-muting times. Given work schedule and comcom-muting distance, trip duration is largely decided by commut-ers’ mode choice. Commuting by private vehicles pro-vides people more flexibility in adjusting travel speed, departure time and routes when the circumstances allow, while commuting by public transit makes people captive to its specific schedules and predetermined routes and stops. This contention is confirmed in stud-ies by Kwan and Kotsev [16] and Vincent-Geslin and Ravalet [19], who found that transit users spent more time on their trips than car users.
Studies taking a gender perspective found that life-cycle phase, household structure, number of workers, gender attachment to labour force markets, presence of young children and gender roles are important de-terminants of travel time [11, 13, 15]. The compound responsibilities of females between household and employment and gender roles lead to gender differ-ences in commuting time patterns. Scheiner and Holz-Rau [20] and Kwan and Kotsev [16] found that the fe-male’s mobility features less car use and shorter work trips, and longer commuting time due to their relative dependence on public transport modes. In contrast, Gimenez-Nadal and Molina [17] concluded that the disproportional household burden, such as household chores and childcare, results in shorter commuting time of females because they are more reluctant to accept job that involves longer commuting. Investigat-ing gender roles, Fan [18] found that gender disparity in commuting times still exists within couples and sin-gle-parent households with children.
Other socio-demographic factors such as age, household income, work status, driving license pos-session, car availability, and level of education are also associated with long duration commuting [19, 21, 22]. For instance, Selima [22] in a case study conducted in the Atlanta area found that high-income workers have longer mean commuting times, while Black workers who are still heavily concentrated in city centre had shorter commuting times. Dargay and Ommeren [23] found that the effect of increasing income on ing time is ambiguous, mainly conditioned by commut-ers’ attitudes towards time savings.
Controlling for socio-demographics, Schwanen et al. [15] investigated the relationship between urban form and commuting time and found that travel times tend to be longer in decentralized regions. Susilo and Maat [13] examined the influence of urban form and transport accessibility on commuting times in the Neth-erlands and found that urbanization and increased development, most development staying dispersedly.
Therefore, the relocation of housing to suburbs result-ed in decreasresult-ed job accessibility and increasresult-ed com-muting times [6-8]. Longer comcom-muting distances gen-erated a higher potential demand for car ownership [9]. However, constrained by their socio-demograph-ic status, most residents living in affordable hous-ing cannot afford the high cost of car purchase and usage. They depend on available public transport in their neighbourhood or on slow transportation modes. Moreover, the lack of high-quality transit services im-plies that these economically disadvantaged residents face miserable commuting trips. As Morris and Guerra [10] concluded, lengthy commuting not only impacts commuters’ travel moods but also negatively influenc-es human well-being. Therefore, analysing the factors influencing the commuting pattern of residents living in affordable housing is of great relevance.
A range of factors including socio-demographics, land use pattern, transportation system characteris-tics and job accessibility are claimed to be associated with commuting time [6, 11-13]. Several studies have examined commuting times for people with different profiles, but to the best of our knowledge, no stud-ies have ever explicitly investigated the commuting time patterns of these economically disadvantaged residents. Therefore, this study analyses one-way commuting time of these residents, addressing the following questions: (1) what factors influence these residents’ commuting times considering socio-demo-graphics, and features of the built environment; (2) how do these factors affect commuting time patterns in different contexts. In answering these questions, we use the affordable housing travel survey conducted in Nanjing in 2010, which is the latest available data. Al-though this data set is relatively old, the fundamental relationships in the data change unlikely fast. Applying Decision Tree Classifiers, we assess the influence of socio-demographics and characteristics of the built environment and capture the commuting time pat-terns of 387 affordable housing residents in different contexts.
The remainder of this paper is organized as follows. Section 2 presents literature review of factors affect-ing commutaffect-ing times. In Section 3, the data sources and study context are described. Section 4 presents the proposed methodology, followed by a discussion of the results and policy implications. The paper is com-pleted with conclusions and a discussion of possible avenues of future studies.
2. LITERATURE REVIEW
Several studies have concluded that urban form, job accessibility, socio-demographics, and job-housing related policies (e.g. market-oriented housing reform, management of labour force and labour market) are
covered three affordable housing communities: Heng-sheng Homeland, Yadong Town, and Chujiang New-town. In the survey, the respondents were required to provide their personal and household characteristics as well as their trip details. After removing cases with missing data or unreasonable travel times, the final sample consists of 387 commuting trip diaries from 99 residents in Hengsheng Homeland, 138 in Yadong Town, and 150 in Chujiang Newtown. Our study fo-cused on commuting trips before 10 a.m. as this is the time frame within which most commuting trips take place.
Using Google maps, we measured the job-home distances and attributes of the built environment in-cluding proximity to CBD, job-housing co-location, job location, and public transport accessibility. To measure job-housing distance, the shortest driving distance ac-cording to Google maps was used. The proximity to the CBD that measures the centrality of the home location tends to be associated with land use patterns in the residential neighbourhood in the sense that a closer distance to the CBD tends to be associated with a more diverse and dense land use pattern. To get an idea of the traffic around the workplaces during com-muting hours, job sites were geographically split into the centre, middle, and suburbs. Job-housing co-loca-tion, an indicator of job-housing balance at the district scale, was measured by indicating whether workplac-es are located in the same district with the rworkplac-esidenc- residenc-es. Public transport accessibility was measured by bus service accessibility and subway availability. Bus service accessibility is quantified by the availability of bus lines that directly connect workplaces and home within a 600 m buffer, while subway accessibility was measured in terms of the accessibility of subway stations within 1 km. Data obtained from Google maps may not perfectly represent the situation in 2010, but this information is the best available data for Nanjing. Figure 1 illustrates the three typical affordable housing communities: Hengsheng Homeland, Yadong Town, and Chunjiang Newtown. Table 1 provides a brief summary of the geographical locations and transport mode share of the surveyed communities.
– Hengsheng Homeland is located north of the CBD and has the smallest built-up area (140,000 m2) with the closest distance (8.7 km) to the city centre. The community was developed quite early between 1999 and 2005 when the urban boundary was not as large as now. The mode shares show that pub-lic transit (42.4%) and active transport (54.6%) are the dominant transport modes, which may be as-cribed to its advantaged geographic location. – Yadong Town is a medium-sized area (500,000
m2) located in the northeast of Nanjing. Despite the longest distance (17.6 km) to the city centre, its neighbouring area has a subway service. 57.2% of transport-network density and accessibility reduced
commuting distances but increased commuting times. Increasing congestion may be the explanation for this finding. Bento et al. [24] and Frank et al. [25] argued that commuting time is the result of a household res-idential locational decision that depends on employ-ment and relative salary opportunities, housing price, community amenities, school quality, urban structure and traffic patterns, and transport mode choices. Zhao et al. [26] found that job-housing balance at the individual level, measured by the co-location of jobs and houses in the same sub-district, has a statistical-ly significant and positive effect on the reduction of commuting time. Using data from 164 Chinese cities, Sun et al. [27] quantified the impact of urban spatial structure on travel time at the city level and found that the average commuting times are positively associat-ed with the city size and job housing separation, and negatively correlated with average population density and employment polycentricism.
Methodologically, most studies have applied statis-tical methods such as multiple regressions analysis, providing general insights into factors affecting trip duration such as gender, urban form, transport ac-cessibility, and job-housing distance [13, 18, 26, 28]. However, trip duration may also depend on the context (e.g., the change in commuting distance or the depar-ture time). Apart from the fact that the dependent vari-able (time) does not always satisfy the assumptions of the chosen statistical analysis, a more important drawback of these analyses is that the chosen linear additive structure of the statistical model does not capture the typical, complex interdependencies of the explanatory variables on commuting time.
Therefore, a decision tree classifier is applied to represent the complex non-linear relationships be-tween these factors and commuting time patterns. Our contribution to the literature can be summarized as fol-lows. First, the special features of affordable housing in China in terms of its specific objectives (low-income) and unique residential contexts differentiate this study from earlier work conducted around the world. Second, insight on how commuting time patterns vary within job housing distances will be given and this mechanism will be graphically interpreted by the con-structed decision tree. Third, this study adds to the scarce literature on this topic in the Chinese context.
3. DATA
To capture commuting patterns of residents who live in affordable housing, the 2010 Nanjing Affordable Housing Household Travel Survey was fused with at-tributes of the built environment, extracted from the Google maps. The survey conducted by Nanjing local government and sponsored by the World Bank has
longer time commuting than those without (31.94 min vs 27.08 min). However, consistent with the view that households with preschool children need to spend more time on childcare, households with children younger than 6 tend to spend less time on commuting (27.82 min). Workers or service attendants, represent-ing 51.8% of the sample, commute longer (31.59 min) than others (29.04 min). Small differences are shown among different income groups. Consistent with a pre-vious study conducted by He and Zhao [21], educated residents commute about three minutes longer than less educated residents.
In the sample, 56.8% of the respondents have jobs in the same district as their residence and commute nearly 17.5 minutes less than those who do not work in the same area they live in. Residents having jobs in the city centre spend more time commuting (34.82 min), which may be caused by the extra distance to the CBD and/or to the congested road network during morning peak hours. The mean commuting time of af-fordable housing residents having access to a direct bus service connecting home and work (27.72 min) or a subway service (24.43 min) indicates that both the provisions of a direct bus line or subway service in the neighbourhood helps in reducing the commuting time. 54.0% of the respondents commute by active trans-port, 33.3% use public transtrans-port, while the remaining 12.7% use motorised modes (private car or motorcy-cle). Public transit commuters (bus users and subway riders) take the longest time (42.89 min) to go to work. Figure 2a displays a positive relationship between commuting time and commuting distance. To gain fur-ther insight, the distance was aggregated into three categories (<2.5 km, 2.5-7.5 km, and ≥7.5 km) using the equal frequency discretization method [38] and additionally accounting for the service ranges of three main commuting modes. One third of the respondents commute more than 7.5 km; 35.9% between 2.5 and 7.5 km, and 30.0% less than 2.5 km. Figure 2b shows that the majority of residents depart between 7:00 a.m. and 8:00 a.m. and their commuting time has high variability. The medium commuting time ‘30 min’ shown in Figure 2 is used as the standard for discretiz-ing the commutdiscretiz-ing time intervals (< 30 min and ≥ 30 min) in the following part.
its residents commute by active transport modes, 17.4% commute by public transport (11.6% by bus and 5.8% by subway), while 25.4% choose private motorised modes (car and motorcycles) for the work commute.
– Chunjiang Newtown covers the largest built-up area (722,000 m2) and is located in the south of Nanjing. It mainly serves low-income households whose residences were demolished during urban renewal. It has a medium distance to the city cen-tre (10.2 km). As to mode share, 48.7% of the re-spondents use active transport modes, 42% take the bus, while 9.3% use private motorised mode. Table 2 summarizes the sample characteristics. The average time men spend on commuting is 2.5 min-utes more than women do. The gender difference in commuting time is not very large, which may be partly attributed to the high ratio of dual-earner households. Their economic status demands more women to work. Also, it may reflect the diminishing trend of gender differences in the labour market in large cities such as Nanjing. Nevertheless, this finding differs from the gendered nature of work commutes found elsewhere in the world. Across all age groups, commuters aged over 39 commute longer (31.93 min). Residents who have access to cars (owning cars or driving licenses) commute 2-7 minutes less than others, while resi-dents possessing IC cards (public transit cards) spend Table 1 – Basic information for the three communities (N=387)
Community
(respondents) area [mBuilt-up2] to CBD [km]Proximity
Mode share [%]
Active transport Public transit Motorised mode
Hengsheng (99) 140,000 8.7 54.6 42.4 3 Yadong (138) 500,000 17.6 57.2 17.4 25.4 Chunjiang (150) 722,000 10.2 48.7 42.0 9.3 Yadong Town Chunjiang Newtown Center Hengsheng Homeland Metro line Completed Under construction In planning Figure 1 – Locations of affordable housing communities in
commuting time intervals as the dependent variable was applied to the data. Decision tree classifiers have been employed in some areas of transportation research, such as road safety analysis and travel be-haviour analysis [29-33]. These classifiers have sever-al powerful features. First, the tree-like structure sever-allows an intuitive interpretation of the complex, non-linear
4. METHODOLOGY
4.1 Research design
To further understand the commuting patterns of residents living in affordable housing in Nanjing, particularly how the selected factors influence their commuting time, a decision tree classifier with binary Table 2 – Sample description (N=387)
Socio-demographics Variable
Gender* Age Education
Female Male 20-29 30-39 40-59 Middle schooland below High school or aboveCollege
Proportion [%] 41.3 58.7 37.5 27.9 34.6 24.0 56.1 19.9
Mean time [min] 29.51 32.24 30.03 31.56 31.93 28.55 31.82 32.21
Variable Car ownership** Driver license Annual household income (CNY) Own it Not yet Own it Not yet <20,000 2-50,000 >50,000
Proportion [%] 21.4 78.6 25.1 74.9 35.4 43.7 20.9
Mean time [min] 25.57 32.57 29.49 31.66 30.78 31.09 31.73
Variable WorkerJob**Other Own itIC card** Not yet Pre-school children**Yes No
Proportion [%] 51.8 48.2 82.9 17.1 29.5 70.5
Mean time [min] 31.59 29.04 31.94 27.08 27.82 32.49
Built environment characteristics
Variable Direct bus** Subway availability** Distance to CBD**
Yes No Available No 8.7km 10.2km 17.6km
Proportion [%] 84.0 16.0 35.7 64.3 25.6 38.7 35.7
Mean time [min] 27.72 48.90 24.43 34.82 28.43 39.03 24.43
Variable Job-housing co-location** Worksite location**
In the same zone In different zones Centre Middle Suburb
Proportion [%] 56.8 43.2 49.6 23.5 26.9
Mean time [min] 23.58 41.04 34.82 29.98 25.26
Commuting trip characteristics Variable
Job-housing distance (OD distance)** [km] Commuting mode**
<2.5 2.5-7.5 ≥7.5 transportActive transportPublic motorisedPersonal
Proportion [%] 30.0 35.9 34.1 54.0 33.3 12.7
Mean time [min] 16.87 30.85 43.91 25.05 42.89 25.98
Note: *significant at 0.1 level; ** significant at 0.05 level
80 60 40 20 0 Commut e trip duration 80 60 40 20 0 Commut e trip duration 0 2.5 5.0 7.5 10.0 12.5 15.0 17.5 20.0 4:00 5:00 6:00 7:00 8:00 9:00 10:00
a) OD distance b) Departure time
30.0 30.0
time differences. Based on the results of information gain statistics, these variables were selected for the subsequent analysis. ODDIS T MODE DEP AR TT COL OCA
TION BUS WSITE
SUB W AY DIS TT CBD CAR JOB LICENSE AG E
PRECHILD INCOME EDUCA
TION GENDER IC CARD 0.35 0.30 0.25 0.20 0.15 0.10 0.05 0.00
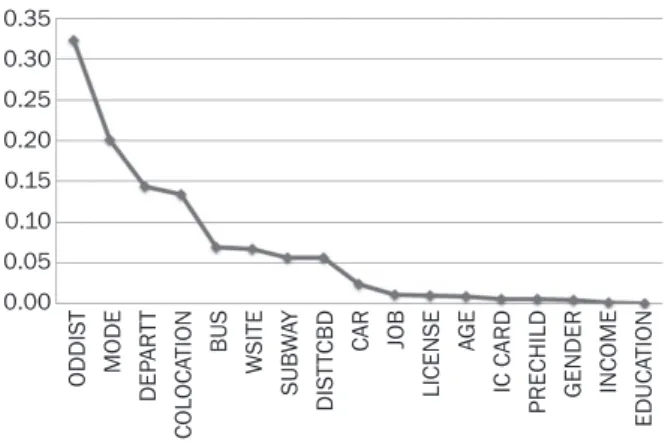
Figure 3 – Information gain of attributes
To learn and validate the decision tree, we random-ly split the cases into two approximaterandom-ly equalrandom-ly-sized sets. There were 193 instances used as the training set for decision tree structure learning and the remaining 194 instances were used for validation. Table 3 lists the overall estimation results for both the training and test datasets. Table 4 shows the confusion matrix classified by commuting time intervals, while Table 5 details the evaluation results for both the training and test dataset. The overall estimation accuracies of the decision tree, shown in Table 3, are 87.56% and 85.57%. The small difference of less than 2% indicates that the trained tree structure is valid. As the target variable ‘commut-ing time’ is binary, various evaluation criteria such as true positive rate (TP rate), false positive rate (FP rate), precision, F-measure and receiver operating charac-teristic (ROC) curve can be applied to judge the quality of the solution [36, 37]. These performance measure-ments are commonly used for classification tests and performance results for both training and test datasets are presented in Table 5. TP rate measures the ratio of instances that are correctly predicted. It further means it encompasses the cases where the commuting time interval is predicted consistent with the observation. The exact value of the FP indicators is calculated as the ratio of the correct prediction to the total sample. The FP rate, on the other hand, is the proportion of instanc-es that are incorrectly predicted. TP ratinstanc-es are 0.798 (< 30 min) and 0.910 (≥ 30 min) for the test data, which indicates a high classification power of the tree model in both situations. The low FP rate also implies a small probability of incorrect classification. The precision values calculated by the equation TP/(TP+FP) in both commuting time intervals are 89.3% and 82.7%, with no significant difference, which suggests that the in-duced classifier predicts well in both commuting time intervals.
relationships among the independent and dependent variables. The induced structure illustrates how the at-tributes influence residents’ commuting times. Second, the decision tree classifiers can be used to deal with inter-correlated variables no matter what the categories of the variables are (discrete and continuous variables). In view of these advantages, we decided to apply this technique in this study.
A typical decision tree is composed of two types of nodes and several branches. The nodes by which the tree splits are condition nodes. More precisely, the con-dition nodes represent the explanatory attributes that split the data in different classifications. The branches represent features that split the data. The condition root on top of the tree is called “root” which is highly correlat-ed with the final node at the end of each branch is deci-sion node. Decideci-sion node specifies the decideci-sion / action that is taken if the conditions across the corresponding branch hold. In our study, three types of variables were used for tree structure learning (as condition nodes): socio-demographics, commuting trip characteristics, and features of the built environment (see Table 2).
To find the optimal set of contributors to commuting time, the learning starts with attribute selection, where methods such as forward/backward stepwise selection are commonly used [34]. However, its one-by-one step-wise feature is sometimes to blame for their disability to find the optimal but local optimal set of predictors. To reduce the odds of this mistake, we employed the in-formation gain measure, whose performance has been proven in previous studies [33], to select the best set of variables. The information gain of data set D with the split attribute A is measured as [35]:
,
Gain D A Entropy D D Entropy DDv
v Value A v = -! ^ ^ ^ ^ h h h h
/
(1)where v is one possible value of variable A, Value (A) is the full set composed by all possible v, and Dv is the subset including all instances with A=v. Compared to the original entropy of data set D, the reduced entropy is the information gained in this partition. It indicates the importance of attribute A in dataset D. We applied the J48 algorithm for structure learning. For more de-tails, readers are referred to Quinlan [35].
4.2 Model results
Following the learning procedure, we calculated the information gain for each attribute, which are shown in Figure 3. Attributes ‘ODDIST’, ‘MODE’, ‘DEPARTT’, ‘COLO-CATION’, ‘BUS’, ‘WSITE’, ‘SUBWAY’, ‘DISTTCBD’, ‘CAR’, and ‘JOB’ have an information gain of more than 0.01, indicating that, in order of importance, job-housing dis-tance, commuting mode, departure time, job housing co-location, direct bus accessibility, job location, subway availability, distance to the CBD, car ownership, and job type are most important in understanding commuting
5. DISCUSSION AND POLICY IMPLICATIONS
5.1 Commuting times
Figure 5 shows the resulting structure of the extract-ed decision tree. There are 20 nodes and 12 leaves in the tree. For each ‘commuting time interval’, two numbers representing respectively the number of training cases and the predicted error are shown in the brackets. The variables ‘ODDIST’ (job-housing dis-tance), ‘SUBWAY’ (the availability of subway service in the neighbourhood), ‘CAR’ (household car ownership), which appear in top two levels of the tree, are found to be the three most important predictors that split the sample. Next, job type and commuting mode choice play a role in the subsets. The job status decides the on-time requirement and once the trip distance is giv-en, the travel mode choice largely determines how much time is spent on the trip. Further, job location and departure time, both of which mainly relate to traffic on the road, traffic rules or regulations on differ-ent transport modes, and availability of public transit facilities, contribute to the classification into homoge-neous subsets.
These branches can also be viewed as different rules that depict differences in commuting time pat-terns of affordable housing residents.
Occasion 1: if the job-housing distance of affordable housing resident is within 2.5 km, a decisive effect of job-housing distance is presented that 48 out of 52 commuters had their commuting time of less than 30 minutes.
The ROC curve is another important validation mea-surement that is more comprehensive and frequently used for classification evaluation. Figure 4 presents the overall ROC curves obtained. Both curves are located above the diagonal line with an under area of 0.910. The area under the curve (AUC) and the F-Measure are important performance indicators that range from 0 to 1: the closer their value approximates 1, the better the performance of the decision tree model. As shown in Table 5, the values of the ROC area and the F-measure (0.910 and 0.855) are above 0.8, indicating that the model has good predictive power.
ROC curves for commuting time (AUC=0.9103)
True positiv
e rat
e
False postive rate
< 30 min ≥ 30 min 1 0.5 0 0 0.5 1
Figure 4 – ROC curves for commuting times Table 3 – Decision tree performance results
Training Testing
Number Percentage Number Percentage
Correctly classified instances 169 87.56% 166 85.57%
Incorrectly classified instances 24 12.43% 28 14.43%
Total number of instances 193 194
Table 4 – Decision tree classification confusion matrix for the test dataset
Predicted instances classified by commuting time < 30 min (84) ≥ 30 min (110) Observed instances classified by commuting time <30 min (94) 75 19
≥30 min (100) 9 91
Table 5 – Decision tree estimation accuracy classified by commuting time
Commuting time TP rate FP rate Precision F-Measure ROC Area: AUC
Train Test Train Test Train Test Train Test Train Test
<30 min 0.793 0.798 0.063 0.090 0.903 0.893 0.844 0.843 0.914 0.910 ≥30 min 0.937 0.910 0.207 0.202 0.860 0.827 0.897 0.867 0.914 0.910 Weighted 0.876 0.856 0.146 0.148 0.878 0.859 0.874 0.855 0.914 0.910
duction for long job-housing distances. Its sibling node ‘MODE’ explains that despite the available car usage, affordable housing commuters are still likely to choose other transport modes. This is congruent with Yang et al. [39] that the travel pattern of low-income commut-ers is more shapeable and is more sensitive to the provision of economically effective travel modes (e.g. buses and subway) in their neighbourhoods. A similar job effect is found in the structure in Figure 5.
5.2 Policy implications
These results indicate that job-housing distance, subway service availability, and job location are found to have detrimental influence on their commuting time pattern particularly in medium-to-long distance muting. This role of transit and urban design in com-muting pattern is critically important for these disad-vantaged social residents living in affordable housing. Working in the city centre implies high probability of encountering traffic jams or tidal traffic flows during commuting. Wang and Zhou [42] stated that the pro-gressive planning that provides effective public transit modes could moderate the spatial job-housing sepa-ration caused by the disadvantaged housing location, and the meanwhile developments in suburbs would meet the needs of job seekers and reduce the pos-sibility of long-distance commuting to other regions. In this case, the availability of bus lines that directly connect to job sites is not significantly associated with commuting time, partly due to its low reliability in the time schedule.
Occasion 2: the job-housing distance ranges from 2.5 to 7.5 km and there is no subway service available, 42 out of 52 residents commute more than half an hour. But when subway services are available, the occasion of trip duration on 2.5~7.5 km commuting will become more complicated but logically interesting. Then, job type makes effects. Within such context, affordable housing residents of the ‘workers’ status are more likely to take less than 30 minutes for the 2.5~7.5 km commuting trip. For residents who are not workers, their commuting time will be somewhat different. After that, the working site location takes effects. It is plau-sible. As working sites usually associate with on-road traffic status and land use pattern, the additional infor-mation on working site location to the given job-hous-ing distance range and home site location could help foresee the traffic on road and the occurrences of tid-al traffic flows that commuters could meet. Then, the commuting trip duration would be more identifiable. As shown in the figure, three fourths of affordable housing residents working in the centre went on a trip of more than 30 minutes. However, to residents who have jobs in the suburbs, one extra split takes place on the departure time in order to reach relatively homoge-nous response to the commuting time.
Occasion 3: Faced with long distance commuting, eco-nomically disadvantaged residents usually have to suf-fer. The tree structure shows that with job-housing dis-tances beyond 7.5 km, there are 49 out of 52 residents who cannot afford a car and have to commute for more than 30 minutes. Against our expectation, the car own-ership among affordable housing residents does not show a significant superiority in commuting time
re-Tree view ODDIST MODE DEPARTT WSITE SUBWAY CAR JOB JOB Center No Available No Own it Suburb Middle
8 am or earlier later than 8 am
Other Worker
Other Worker
Active mode Public transit Motorized
Less than 2.5 2.5-7.5 km More than 7.5 km
< 30 min (3/0)
< 30 min (4) ≥ 30 min (6/2)
< 30 min (0)
< 30 min (13/3) ≥ 30 min (0) ≥ 30 min (3)
≥ 30 min (4/1) ≥ 30 min (52/10)
< 30 min (52/4)
≥ 30 min (52/3)
≥ 30 min (4/1)
Three conclusions may be drawn from the results of our analysis. First, the job-housing distance within specific range, here less than 2.5 km, is to have deci-sive effects on the commuting time, while socio-demo-graphics and built environment attributes for people who have this very short commuting distance, hardly contribute to the discrimination of residents’ trip dura-tion. Second, for residents whose commuting distance ranges from 2.5 to 7.5 km, the availability of subway services and job location starts to make great effects influencing affordable housing residents’ time used in commuting. Third, with the increasing job-housing distance more than 7.5 km, these socio-demographic variables such as car ownership, and job status start to play great roles in their commuting time. These find-ings would suggest that the influence of different con-text may vary from one occasion to another.
Although this research has provided interesting in-sights in commuting time patterns, some limitations remain to be addressed in the future research. First, unfortunately the sample size was rather small, imply-ing that some features of the data may not be detect-ed by the decision tree. Moreover, the small sample size forced us to ignore some features in the model-ling process. Third, due to the lack of data, additional variables such as employment type for these afford-able housing communities on a specific scale could not be incorporated in the analysis. Finally, with time moving along, in the future, the longitudinal effect of the changing environment on commuting time could be analysed.
It goes without saying that the findings of this study are confined to the study area. One may argue that the location of these affordable housing communities was not too extreme. In fact, many residents in most coun-tries in the world face similar or longer commuting. In that sense, it would be of interest to replicate this study in cities such as Beijing and Shanghai, where rapidly increasing housing prices have forced low-in-come people to find residences much further out of the city centre.
ACKNOWLEDGEMENT
This research has been funded by the Natural Sci-ence Foundation of China (71771049, 51678132 and 71801041) and the Six Talent Peaks Project in Jiangsu Province (2016-JY-003). 吴静娴1 Email: wujingxian321@gmail.com 杨敏2(通讯作者) Email: yangmin@seu.edu.cn Soora Rasouli3 Email: s.rasouli@tue.nl 程龙4 Email: chenglong010203@gmail.com 1上海理工大学交通工程系,上海,200093;
Contrary to previous studies, socio-demographics except car ownership and job types are not statistical-ly associated with the commuting time. The negligible effects of gender and income on commuting time may be attributed to the faint economic difference of this group, most of which are low-paid dual-earner house-holds. The segmentation of commuting distance has further diffused the small differences between differ-ent gender and income groups in data description. Car users here are shown to be captives of their out-lying living environment. Therefore, their commuting behaviour can possibly be reshaped by high-quality public transit service. Transit policies can be flexibly designed in these affordable housing communities, such as providing demand-responsive shuttle buses connecting home and job locations and arranging bus routes and operation schedules as needed. Similarly, differences in commuting times between people in other socio-characteristics are not reflected in the tree structure, which also proves the inability of statistical descriptions in explaining the intrinsic mechanism or giving root solutions for long-time commuting.
Lastly, travel characteristics in terms of mode choice and departure time affect commuting times. Due to the low income status of affordable housing residents, the increasing distances did not statistical-ly increase car commuting as expected. Therefore, a cost-effective transport mode is in great need for this group of people. TOD (Transit Oriented Development) policies improving public transport service or service accessibility with land use development are of great necessity. Meanwhile services such as the bike-shar-ing mode that serves the first- and last- mile of subway trips could be provided to strengthen and guarantee the efficiency of multimodal transit travel.
6. CONCLUSION
This study is aimed at investigating commuting times of residents living in affordable housing in Nan-jing, China. Commuting time was examined within dif-ferent job-housing distance categories. The affordable housing, which is the product of government interven-tion in response to urbanizainterven-tion and rapidly increasing housing prices, tends to be located on the city fringe. As the name indicates, these housing communities serve low-income residents who cannot afford the high living cost in more central parts of the city.
Inspired by findings in the countries other than China which indicated that the overall commuting dis-tance and time of urban residents increased [40, 41], led to the question how these residents in affordable housing communities commute and what their com-muting time patterns look like. Using trip diaries of 387 affordable housing residents from the 2010 Nan-jing Household Travel Survey, a decision tree classifier was used to answer these questions.
residential space based on residents’ travel behavior: taking Dalian as an example. Geographical Research. 2007;5:020. Chinese.
[10] Morris EA, Guerra E. Are we there yet? Trip duration and mood during travel. Transportation Research Part F: Traffic Psychology and Behaviour. 2015;33: 38-47. [11] Schwanen T, Dijst M, Dieleman FM. A microlevel
analy-sis of residential context and travel time. Environment and Planning A. 2002;34(8): 1487-1507.
[12] Wang D, Chai Y. The jobs–housing relationship and commuting in Beijing, China: the legacy of Danwei. Journal of Transport Geography. 2009;17(1): 30-38. [13] Susilo YO, Maat K. The influence of built environment
to the trends in commuting journeys in the Nether-lands. Transportation. 2007;34(5):589.
[14] Cervero R. Jobs-housing balancing and regional mo-bility. Journal of the American Planning Association. 1989;55(2): 136-150.
[15] Schwanen T, Dieleman FM, Dijst M. Car use in Nether-lands daily urban systems: does polycentrism result in lower commute times? Urban geography. 2003;24(5): 410-430.
[16] Kwan MP, Kotsev A. Gender differences in commute time and accessibility in Sofia, Bulgaria: a study us-ing 3D geovisualisation. The Geographical Journal. 2014;181(1): 83-96.
[17] Gimenez-Nadal JI, Molina JA. Commuting time and household responsibilities: Evidence using propen-sity score matching. Journal of Regional Science. 2016;56(2): 332-359.
[18] Fan Y. Household structure and gender differences in travel time: spouse/partner presence, parenthood, and breadwinner status. Transportation. 2017;44(2): 271-291.
[19] Vincent-Geslin S, Ravalet E. Determinants of extreme commuting. evidence from Brussels, Geneva and Lyon. Journal of Transport Geography. 2016;54: 240-247. [20] Scheiner J, Holz-Rau C. Gendered travel mode choice:
a focus on car deficient households. Journal of Trans-port Geography. 2012;24: 250-261.
[21] He M, Zhao S. Determinants of long-duration commut-ing and long-duration commuters' perceptions and attitudes toward commuting time: Evidence from Kun-ming, China. IATSS Research. 2017;41(1): 22-29. [22] Sultana S. Job/housing imbalance and commuting
time in the Atlanta metropolitan area: exploration of causes of longer commuting time. Urban Geography. 2002;23(8): 728-749..
[23] Dargay JM, Van Ommeren J. The effect of income on commuting time using panel data. 45th Conference of
the European Regional Science Association at the Vri-je Universiteit Amsterdam; 2005.
[24] Bento AM, Cropper ML, Mobarak AM, Vinha K. The ef-fects of urban spatial structure on travel demand in the United States. Review of Economics and Statistics. 2005;87(3): 466-478.
[25] Frank L, Bradley M, Kavage S, Chapman J, Lawton TK. Urban form, travel time, and cost relationships with tour complexity and mode choice. Transportation. 2008;35(1): 37-17.
[26] Zhao P, Lu B, De Roo G. Impact of the jobs-housing bal-ance on urban commuting in Beijing in the transforma-tion era. Journal of Transport Geography. 2011;19(1): 59-69. 2东南大学交通学院,江苏 南京,211189; 3埃因霍温理工大学城市规划组,荷兰 埃因霍温, 5600 MB 4根特大学地理系,比利时 根特,B-9000 城市经济适用房居民通勤时间模式特征研究——以 中国南京为例 摘要 中国当前大量兴建的经济适用房已逐步成为城市低收 入群体的主要房源。由于经济适用房项目多建于偏离城市 中心的区域,该群体住户常常不得不忍受长时间的通勤, 而现关于通勤时间的研究极少能关注该群体的通勤模式特 征。因此,本研究将融合2010年南京经济适用房居民出 行调查数据和谷歌地图补充数据,利用分类决策树分析经 济适用房居民通勤时间模式特征。研究结果显示建成环境 指标和职住通勤距离是影响南京经济适用房群体通勤时间 模式的主要因素。轨道服务可达性、工作类别、家庭汽车 保有量、工作区位、通勤方式选择以及出发时间均对个体 的通勤时耗存在逻辑性且不同程度的影响。研究益于加深 人们对经济适用房群体通勤模式特征的理解,并可为城市 规划者制定利于个体出行的经济适用房优化政策提供见 解。 关键词 经济适用房;出行行为;出行时耗;分类决策树;建成 环境; REFERENCES
[1] Woetzel J. Meeting China’s affordable housing chal-lenge. McKinsey; 2015. Available from: http://mck- inseychina.com/meeting-chinas-affordable-hous-ing-challenge/
[2] Nanjing Land Bureau. Nanjing Real Estate Yearbook; 2017. Available from: http://data.cnki.net/Trade/year-book/single/N2018060115?z=Z005
[3] Zhou Y. Contradictions in China's affordable hous-ing policy: Goals vs. structure. Habitat International. 2014;41: 8-16.
[4] Guo D, Li J, Wang Z. Research on spatial distribution characteristics of indemnificatory housing in Nanjing and optimizing strategies. Modern Urban Research. 2011;3: 83-88.
[5] Song W. Characteristics, social problems and solutions of the spatial distribution of government-subsidized houses in Chinese mega-cities. International Journal of Urban Sciences. 2011;15(2):107-119.
[6] Zhao P. The impact of the built environment on indi-vidual workers’ commuting behavior in Beijing. In-ternational Journal of Sustainable Transportation. 2013;7(5): 389-415.
[7] Wang D, Zhou M. The built environment and travel behavior in urban China: A literature review. Transpor-tation Research Part D: Transport and Environment. 2017;52: 574-585.
[8] Gan X, Zuo J, Wu P, Wang J, Chang R, Wen T. How affordable housing becomes more sustainable? A Stakeholder Study. Journal of Cleaner Production. 2017;162: 427-437.
[35] Quinlan JR. Induction of decision trees. Machine Learning. 1986;1(1): 81-106.
[36] Fawcett T. ROC graphs: Notes and practical consider-ations for researchers. Machine Learning. 2004;31(1): 1-38.
[37] Davis J, Goadrich M. The relationship between Preci-sion-Recall and ROC curves. Proceedings of the 23rd
international conference on Machine learning, 25-29 June 2006, Pittsburgh, Pennsylvania, USA. New York: ACM; 2006. p. 233-240.
[38] Kotsiantis S, Kanellopoulos D. Discretization tech-niques: A recent survey. GESTS International Trans-actions on Computer Science and Engineering. 2006;32(1): 47-58.
[39] Yang M, Wu J, Rasouli S, Cirillo C, Li D. Exploring the impact of residential relocation on modal shift in com-mute trips: Evidence from a quasi-longitudinal analy-sis. Journal of Transport Policy. 2017;59: 142-152 . [40] Cervero R, Day J. Residential Relocation and
Commut-ing Behavior in Shanghai, China: The Case for Tran-sit Oriented Development. Institute of Transportation Studies, UC Berkeley. Research Reports, Working Pa-pers, Proceedings qt0dk1s0q5, 2008.
[41] Yang J. Transportation implications of land develop-ment in a transitional economy: evidence from hous-ing relocation in Beijhous-ing. Journal of the Transportation Research Board. 2006;1954: 7-14.
[42] Wang D, Zhou M. The built environment and travel behavior in urban China: a literature review. Transpor-tation Research Part D: Transport and Environment. 2017;52: 574-585.
[27] Sun B, He Z, Zhang T, Wang R. Urban spatial structure and commute duration: an empirical study of china. International Journal of Sustainable Transportation. 2016;10(7): 638-644
[28] Zhao P, Lu B. Exploring job accessibility in the trans-formation context: an institutionalist approach and its application in Beijing. Journal of Transport Geography. 2010;18(3): 393-401.
[29] Arentze T, Timmermans H. Parametric action decision trees: Incorporating continuous attribute variables into rule-based models of discrete choice. Transpor-tation Research Part B: Methodological. 2007;41(7): 772-783.
[30] Kashani AT, Mohaymany AS. Analysis of the traf-fic injury severity on two-lane, two-way rural roads based on classification tree models. Safety Science. 2011;49(10): 1314-1320.
[31] De Oña J, de Oña R, Calvo FJ. A classification tree ap-proach to identify key factors of transit service qual-ity. Expert Systems with Applications. 2012;39(12): 11164-11171.
[32] Zhang J, Yu B, Chikaraishi M. Interdependences be-tween household residential and car ownership behav-ior: a life history analysis. Journal of Transport Geogra-phy. 2014;34: 165-174.
[33] Tang L, Xiong C, Zhang L. Decision tree method for modeling travel mode switching in a dynamic behavior-al process. Transportation Planning and Technology. 2015;38(8): 833-850.
[34] Kohavi R, John GH. Wrappers for feature subset se-lection. Artificial intelligence. 1997;97(1-2): 273-324.