D
OES THE
C
HINESE
I
NTEREST
R
ATE
F
OLLOW THE
US
I
NTEREST
R
ATE
?
YIN-WONG CHEUNG
DICKSON TAM
MATTHEW S. YIU
CESIFO WORKING PAPER NO. 1943
C
ATEGORY6:
M
ONETARYP
OLICY ANDI
NTERNATIONALF
INANCEM
ARCH2007
An electronic version of the paper may be downloaded
• from the SSRN website: www.SSRN.com
• from the RePEc website: www.RePEc.org
CESifo Working Paper No. 1943
D
OES THE
C
HINESE
I
NTEREST
R
ATE
F
OLLOW THE
US
I
NTEREST
R
ATE
?
Abstract
One argument for floating the Chinese renminbi (RMB) is to insulate China’s monetary policy from the US effect. However, we note that both theoretical considerations and empirical results do not offer a definite answer on the link between exchange rate arrangement and policy dependence. We examine the empirical relevance of the argument by analyzing the interactions between the Chinese and US interest rates. Our empirical results, which appear robust to various assumptions of data persistence, suggest that the US effect on the Chinese interest rate is quite weak. Apparently, even with its de facto peg to the US dollar, China has alternative measures to retain its policy independence and de-link its interest rates from the US rate. In other words, the argument for a flexible RMB to insulate China’s monetary policy from the US effect is not substantiated by the observed interest rate interactions.
JEL Code: F33, E5, G15.
Keywords: policy dependence, interest rate interactions, exchange rate regime. Yin-Wong Cheung
Department of Economics University of California, Santa Cruz
USA – CA 95064 cheung@ucsc.edu Dickson Tam
Hong Kong Institute for Monetary Research
55/F, Two International Finance Centre 8 Finance Street, Central
Hong Kong
Matthew S. Yiu
Hong Kong Institute for Monetary Research
55/F, Two International Finance Centre 8 Finance Street, Central
Hong Kong This Draft: March 2006
The authors are grateful to Lilian Cheung, Menzie Chinn, Mardi Dungey, Ben Fung, Chris Graham, Guonan Ma, and participants of the 2006 HKIMR conference on “International
Financial Markets and the Macroeconomy” and the 2006 HKEA 4th Biannual Conference for
their helpful comments and suggestions. Steven Chan provided excellent research assistance. The views expressed in this paper are those of the authors and do not necessarily reflect those of the institutions they are affiliated with including the Hong Kong Institute for Monetary Research, its Council of Advisors, or Board of Directors.
1. Introduction
Building upon its successful economic story in the last two decades, China has entered the new millennium with rapid export growth and continuing penetration into the global market. With its increasing influences, China’s economic policy is under close scrutiny by the
international community. One topic that has attracted much attention is China’s exchange rate policy. Since 1994, China has adopted a de facto peg to the US dollar. In the aftermath of the 1997 financial crisis, the fixed rate policy was praised for its role in stabilizing the regional and world economy. In the recent years, however, the same de facto fixed exchange rate policy has become the centre of a contentious controversy. Specifically, some countries, among which the US is the most vocal one, accuse China of gaining unfair advantages by maintaining an
undervalued renminbi (RMB) and, as a result, running a huge trade surplus and exacerbating global imbalances, which can destabilize the global economic system.1
To resolve the global imbalance problem, some countries, economists, and commentators urge China to adopt a flexible exchange rate policy and allow the RMB to appreciate. In fact, on July 21st, 2005 China re-valued its currency and announced the policy of pegging to a basket of currencies. Even though the move was warmly, albeit cautiously, welcomed, it does not soften the international demand for further RMB flexibility. Indeed, the behaviour of the RMB after July 2005 is akin to a peg to the US dollar more than to a basket of diversified currencies.
There is no shortage of proposals in both the media and academia for China to reform its foreign exchange market and policy stance.2 One argument offered by advocates of a flexible RMB is that it is to China’s benefit to float its currency. It is based on the merits of exchange rate flexibility presented in the long-standing debate of exchange rate regime choices.3 With a (de
facto) fixed exchange rate, China has to give up monetary policy independence and follow the
policy set by the US, which is the anchor currency country in order to maintain the pegged
1
The estimated degree of RMB undervaluation varies with the model under consideration. Cheung, Chinn and Fujii (2005), however, point out that there is a high degree of uncertainty surrounding the estimated degree of undervaluation.
2
Some more recent examples are Eichengreen (2006),Goldstein (2004), Goodfriend and Prasad (2006), Roberts and Tyers (2003), and Williamson (2005). McKinnon (2005, 2006) and Mundell (2004) are among the few that favor RMB stability. McCallum (2004) and Schwartz (2005) represent yet another view on the issue: China, and not outside sovereignties, should determine the complex issue of reforming its foreign exchange policy.
3
exchange rate. Despite its increasing integration into the world economy, there is no apparent evidence that China and the US share common business cycles. In the absence of similar cyclical behaviour, it is very costly for China to follow the US monetary policy.
On the other hand, a flexible currency will isolate China from external shocks and, thus, allow China to pursue an independent monetary policy to address its own domestic economic issues. Thus, China stands to gain policy autonomy and the associated economic benefits by improving its exchange rate flexibility.
The relevance of the argument is, nonetheless, not beyond doubt. A natural question to ask is: Does exchange rate flexibility allow China to pursue an independent monetary policy?
It is well known that the insulation property of a flexible exchange rate system can be imperfect.4 In an extreme theoretical setting, a fixed exchange rate arrangement implies complete monetary policy dependence, which, in the current content, means that there is a one for one pass through of the US interest rate to the Chinese domestic interest rate.5 The actual degree of pass through can be hampered by capital controls and sterilization operations. The link between exchange rate regimes and interest rate pass through is further complicated by the “fear of floating” phenomenon – a situation in which countries adopt a de jure flexible system and, at the same time, restrict the variability of their exchange rates and, thus, limit the effectiveness of exchange rate insulation property.6
Besides the “fear of floating,” there are other reasons that countries with floating rates behave like those with exchange rates pegged to the US. For instance, countries with a
substantial trade relationship with the US may find it beneficial to follow the US lead. Further, countries can take the US monetary policy as an important input to their own policy making process if they perceive the US has a good gauge of the economic conditions and an adept monetary policy decision process. The observed monetary policy dependence can go beyond the
4
See, for example, Corden (1985), Devereux and Engel (1999), Mussa (1979), and Salant (1977).
5
To be sure, interest rate interactions are one of the ways to infer monetary policy
dependence. Linkages induced by a fixed exchange rate arrangement can also be gauged by, say, interactions between inflation (Cheung and Yuen, 2002; Ghosh et al., 1997; Quirk, 1994). Bergin and Jordà (2004), for example, use central bank issued policy rate targets to measure monetary policy interdependence.
6
See Calvo and Reinhart (2000) and Hausmann et al. (2001) for an explication of the “fear of floating” phenomenon. Dooley et al. (2003) assert the peg to the US dollar is part of the
extent implied by exchange rate arrangements.
The extant empirical evidence on the effect of fixing exchange rates on monetary policy dependence is mixed. Some recent studies including Borensztein et al. (2001) and Shambaugh (2004) find that pegged countries tend to follow their anchor currency country’s interest rates more than the non-pegged ones and, thus, suggest that exchange rate flexibility enhances monetary policy independence. On the other hand, Frankel (1999), Frankel et al. (2004), and Hausmann et al. (1999) find no substantial evidence of exchange-rate-regime effects on
monetary policy dependence – the interest rate pass through behaviour is similar across countries with different exchange rate regime choices.7
Apparently, both theoretical and empirical results are ambivalent on the issue. There is not a definite verdict that the prescription of RMB flexibility will give China an independent monetary policy.
Without the benefit of foresight, we turn our attention to a related question: Has China lost its policy independence and is the Chinese interest rate following the US interest rate under the current de facto pegged exchange rate arrangement? Apparently, this question has received less discussion in the debate on RMB policy. If the current Chinese interest rate is not driven by the US rate and if the Chinese economy is performing reasonably well, then abandoning the peg for policy independence may not be a relevant argument. Even a causal observer will not rule out the possibility of imperfect interest rate pass through when one takes into consideration the effects of capital restrictions (even though China’s capital account is perceived porous), sterilization, and other possible policy measures.
To shed some insights on China’s dependence on the US monetary policy, we follow, for example, Frankel et al. (2004) and Shambaugh (2004) and infer policy dependence based on interest rate interactions between these two countries.8 Specifically, we consider data on the Chinese one-month interbank interest rates and US one-month Fed fund interest rates.
We anticipate the empirical study of interest rate interactions has to overcome the uncertainty about data persistence. In general, interest rates are bounded and do not fit the
7
Frankel et al. (2004) also reported that a floating regime offers “temporary monetary independence” in the sense that the interest rate adjustment speed is lower under a floating regime than under a fixed regime.
8
Chinn and Frankel (1995) employ real interest rates to assess the impacts of US and Japanese policies on Pacific Rim economies.
description of a nonstationary I(1) process. In most empirical exercises, however, it is difficult to reject the I(1) hypothesis for data on interest rates. To ensure that our inferences are robust to the assumption of data persistence, we employ different empirical techniques that allow us to handle various possible scenarios. The empirical strategy will be discussed in the subsequent sections.
2. Data Description
As mentioned earlier, one-month Chinese interbank interest rates and one-month US Fed fund interest rates are used to infer the pattern of interest rate pass through.9 Arguably, there is little doubt that the US Fed fund interest rate movements are market driven and reflect policy intentions. The Chinese interest rate, one the other hand, may not be as well understood as the US one. Thus, we provide a brief background description of the Chinese interbank market.
The interbank market is one component of the growing Chinese money market.10 In the early 1980s, it was an informal market for township and village enterprises. In 1985, the market got official endorsement and stated-owned specialized banks were allowed to participate in the lending and borrowing activities. The major change came in January 1996. At that time, China revamped the interbank market and instituted a unified interbank trading mechanism that
responds to demand and supply conditions. Indeed, it is perceived that the interbank market is an efficient segment of the Chinese money market and, say, the one-month interbank rate is
representative of other short-term interest rates and is an indicator of the Chinese monetary policy.11
To facilitate interpretation, we also examine the dependence of the Hong Kong
one-month interbank interest rate on the US rate. The choice of Hong Kong is driven by a few considerations. First, the theoretical insulation property of the exchange rate arrangement can be illustrated quite clearly within the framework of a small open economy without capital controls.
9
The official rates set by the Fed and the People’s Bank of China are not used because these rates change only infrequently and, thus, are deemed not suitable for the statistical analysis adopted in the current study.
10
The other main components are the interbank bond market and the bond repo market. The description of the Chinese interbank market is mainly drawn from Imam (2004), Li and Peng (2002), and Xie (2002).
11
The interbank lending rate ceiling was abolished. Foreign licensed banks were allowed to borrow RMB in the interbank market after May 1998. See Imam (2004), Li and Peng (2002), and Xie (2002) for a more detailed discussion.
The academic description of a small open economy without capital controls, however, represents some stringent conditions in reality. Hong Kong is a small open economy that is renowned for its laissez-faire policy, minimum government intervention, and free capital mobility. Arguably, Hong Kong is one of the few economies that has attributes very close to the theoretical description of a small open economy without capital controls. Thus, Hong Kong is a good reference point in evaluating exchange rate regime effects.
Second, Hong Kong has a de facto fixed exchange rate against the US dollar since adopting a currency board system in 1983. During the sample period under consideration, both Hong Kong and China follow a similar de facto exchange rate arrangement.
Third, Hong Kong has significant linkages with China – at least, geographically and economically. The close tie between these two economies helps compare the responses of their interest rates to the US interest rate. In sum, these features make Hong Kong a good benchmark for evaluating the interest rate interacts between China and the US.
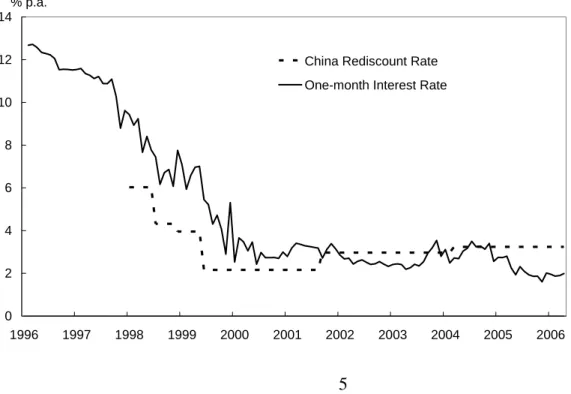
In view of the development of the Chinese interbank market, we consider the sample period from February 1996 to April 2006. The monthly data were retrieved from Bloomberg L.P. and CEIC. Graphs of the one-month and official discount rates are plotted in Figure 1 to Figure 3. Figure 4 contains the official rates from the three economies.
Figure 1. The Chinese one-month interbank rate and official discount rate
0 2 4 6 8 10 12 14 1996 1997 1998 1999 2000 2001 2002 2003 2004 2005 2006 % p.a.
China Rediscount Rate One-month Interest Rate
Figure 2. The Hong Kong one-month interbank rate and official discount rate 0 2 4 6 8 10 12 14 1996 1997 1998 1999 2000 2001 2002 2003 2004 2005 2006 % p.a.
HK Discount Base Rate One-month Interest Rate
Figure 3. The US one-month Fed fund rate and official discount rate
0 1 2 3 4 5 6 7 1996 1997 1998 1999 2000 2001 2002 2003 2004 2005 2006 % p.a.
US Federal Funds Target Rate One-month Interest Rate
Figure 4. The official discount rates 0 1 2 3 4 5 6 7 8 9 1996 1997 1998 1999 2000 2001 2002 2003 2004 2005 2006 % p.a.
US Federal Funds Target Rate China Rediscount Rate HK Discount Base Rate
Two observations are apparent from these graphs. First, the three one-month interest rates in general move around their respective official rates and track their movements quite well. Thus, these market interest rates reflect the policy intentions and are suitable for studying interest rate dependence among these economies.
Second, the Hong Kong and US official rates appear to move in tandem, as expected. During the sample period, Hong Kong had a currency board arrangement. As a small open economy with almost no capital controls, Hong Kong is expected to have its interest rates follow the interest rates of its reserve currency – in this case the US dollar interest rates. While their official rates move in lockstep, the Hong Kong and the US market interest rates diverged a few times during the 1997 Asian financial crisis and in 1998 when the interest rate policy was used to defend the currency board arrangement. Around 2004, the Hong Kong interest rate moved away from the US interest rate for a different reason. During that time, because of the expectations of its currency’s revaluation, Hong Kong experienced a large influx of hot money that kept its interbank interest rates lower than the US rates.12
The Chinese and US interest rates, on the other hands, display no obvious similarities. Thus, despite China has a defacto peg, the Chinese interest rate does not vary along with the US
12
To be exact, the market expected an imminent RMB evaluation and that the HK dollar will follow the RMB move.
one. Formal statistical evidence on the dependence between these interest rate data is presented in the following sections.
3. Preliminary Analyses
The augmented Dickey-Fuller (ADF) test is employed to assess the persistence of interest rate data. The ADF test is based on the regression equation:
1 1 1 p it i i i it j ij it j it Y ω τt δY − =−ϕ Y − ε Δ = + + +
∑
Δ + (1)where Yit is the generic notation of economy i’s interest rate at time t for i = China, Hong Kong,
and the US. Δ is the differencing operation. Under the unit-root null hypothesis, δi =0. Equation (1) includes both a constant and a time trend. The trend term is included to ensure the test result does not depend on the value of ωi (Evans and Savin, 1984). West (1987) also points out that the ADF test is inconsistent if the process is stationary around a time trend and the trend term is not included. The inclusion of an irrelevant trend term, on the other hand, will lower the power of the test. In fact, for the interest rates under consideration, the trend term is only significant in a few instances. However, as a safeguard against misleading inferences, we choose to keep the trend term in the regression and accept a power loss. For completeness, we reported test results based on (1) with and without the trend term.
The ADF test results from the whole sample and two non-overlapping subsamples (1996-2000 and 2000-2006) are presented in Table 1. The lag parameter was chosen to eliminate serial correlation in the estimated residuals. The choice of the two subsamples allows us to examine whether interest rate interactions before and after the crisis are similar.13 The results in Table 1 do not present unambiguous evidence on interest rate persistence. While the two ADF tests do not offer strong evidence against the unit root hypothesis for the entire sample, they give mixed results in the subsamples. Specifically, the Hong Kong and US interest rate data reject the unit root hypothesis in the 1996-2000 subsample but not in the second subsample. The results for the Chinese data are comparable to the other two economies but the evidence of stationarity in the first subsample is weaker than the evidence for the other two economies.
One can speculate that the interest rates follow a stationary process in the first subsample and a unit root process in the second subsample period. The whole period results are driven by
13
the 2000 to 2006 data. However, such an interpretation may not be correct. For instance, during the first subsample, the extraordinary economic events including the crises may have masked the true underlying interest rate dynamics.
Table 1. Unit Root Test Results
1996:2 – 2006:4 1996:2 – 2000:6 2000:7 – 2006:4 Constant Constant + Trend Constant Constant + Trend Constant Constant + Trend A. China ADF -2.830** -1.091 0.326 -5.212* -1.489 -2.108 Lag 2 2 2 0 1 1 B. Hong Kong ADF -1.229 -1.496 -3.479 * -3.438** -2.257 -0.430 Lag 7 7 0 0 7 1 C. US ADF -1.911 -2.114 -4.708* -3.676* -3.009* -1.071 Lag 12 12 12 12 4 1
Note: The table reports results of applying the ADF tests to the Chinese, Hong Kong, and the US interest rates in Panel A, Panel B, and Panel C. The first row lists the time periods covered by the full sample, the first subsample, and the second subsample. “ADF” gives the ADF test statistics. “LAG” gives the lag parameters used in the test procedures. “*” and “**” indicate the rejection of the unit root null hypothesis at the 5% and 10% level, respectively. The Cheung and Lai (1995) finite sample critical values are used. In all cases, the Box-Ljung Q-statistics calculated from the first 5 and 10 estimated residual autocorrelations are not significant.
The unit root test is notorious for its inability to offer a sharp inference to differentiate a unit root process from a persistent but stationary one. Thus, instead of forcing a definite
inference, we opted to examine evidence under both stationary and unit-root specifications for interest rate data. Such an approach will alleviate the possibility that the empirical interest rate interactions are driven by the stationarity assumption.
4. Interest Rate Dependence
The proper choice of a statistical technique to investigate interest rate interactions crucially depends on the presence or absence of a unit root in the data. For instance, if the data contain unit roots, then a cointegration rather than a vector autoregression setup should be used. Unfortunately, the unit root test results do not provide an incisive inference. In view of the ambivalence, a few approaches are considered to cover various possible scenarios. Thus, instead of betting on a specific technique, we contemplate evidence derived from procedures that may provide the correct inferences.
4.1 Cointegration
First, we assume the interest rate data have a unit root and the cointegration framework is adopted to investigate the empirical long-run and short-term interactions. Specifically, the
Johansen approach, which offers a unified and multivariate setting to test for the presence of cointegration is used to analyze the interest rate data (Johansen, 1991).
Let Yt be a 2x1 vector containing US and the Chinese (or US and Hong Kong) interest
rate series. The Johansen test for cointegration is based on the sample canonical correlations between ΔYt and Yt-p-1, where p is a lag parameter. To implement the test, two least squares
regressions: t i t p i i t C Y Y 1 1 1 1+ γ Δ +ε = Δ
∑
= − (2) and t i t p i i p t C Y Y 2 1 2 2 1 = + =γ Δ − +ε − −∑
(3)are estimated, where the Ci's are constant vectors and the lag parameter p is chosen to eliminate serial correlation in the estimated residuals. The sample canonical correlations between ΔYtand
Yt-p-1, adjusting for all intervening lags, are given by the eigenvalues, λ1 >λ2, of 12
1 11 21Ω Ω
Ω −
with respect to Ω22 where Ω =
∑
′−
t it jt ij T εˆ εˆ
1
, i, j = 1,2. The trace and the maximum eigenvalue statistics are given by, respectively:
∑
= + − − = 2 1ln(1 ) r j j r T t λ (4)and ) 1 ln( 1 1 + + =− − r r r T t λ , 0 ≤ r ≤ 1. (5)
The former statistic tests the hypothesis that there are at most r cointegrating vectors and the latter one tests the hypothesis of r against the alternative hypothesis of r+1 cointegrating vectors. The eigenvectors associated with λ1 and λ2are sample estimates of the cointegrating vectors. The cointegration test results are reported in Table 2.
Table 2. Cointegration Test Results
1996:2 – 2006:4 1996:2 – 2000:6 2000:7 – 2006:4
EIGENV TRACE EIGENV TRACE EIGENV TRACE
A. China/US r=1 6.1668 6.1668 0.1763 0.1763 2.5143 2.5143 r=0 12.7248 18.8916 2.3018 2.4781 9.1555 11.6698 B. Hong Kong/US r=1 2.2839 2.2839 0.0437 0.0437 4.1058 4.1058 r=0 9.4839 11.7679 8.9298 8.9736 6.5875 10.6932
Note: The results of testing for cointegration between the Chinese and the US and between the Hong Kong and the US interest rates are reported in Panel A and B. The first row lists the time periods covered by the full sample, the first subsample, and the second subsample. Eigenvalue and trace statistics are given under the columns “EIGENV” and “TRACE.” “r=0” corresponds to the null hypothesis of no cointegration and “r=1” corresponds to the hypothesis of one cointegration vector. The no-cointegration null is not rejected in all cases. The Cheung and Lai (1993) finite sample critical values are used. In all cases, the lag parameter used is selected using information criteria and the resulting Box-Ljung Q-statistics calculated from the first 5 and 10 estimated residual autocorrelations are not significant.
Quite surprising, there is very limited evidence of cointegration in these interest rate series. The null hypothesis is marginally rejected in only one case – the Chinese and the US interest rates in the full sample. For this case, the estimated cointegration vector is (1, 4.690)
with the Chinese coefficient being normalized to 1. The estimated vector implies that the two interest rates move in opposite directions in the long run; a result that is not consistent with the notion that the Chinese interest rate follows the US rate. Thus, we do not consider it an evidence of the dependence of the Chinese interest rate on the US rate.
One possible explanation of the negative result is that the data are noisy and, thus, make it difficult to reject the null hypothesis of no cointegration. One way to improve the test
performance is to impose the theoretical relationship on the data. Theoretically, under a fixed exchange rate arrangement, the dominating economy should dictate the common interest rate movement. In the current context, it means the interest rates in China and Hong Kong should equal the interest rates in the US, apart from, say, a risk premium. Assuming that the risk
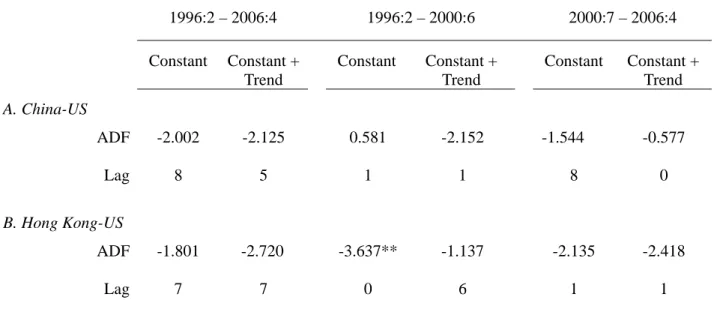
premium is stationary, the three interest rate series should move one to one in the long run. Thus, we impose the (1, -1) restriction and examine the stationarity of interest rate differentials
between the US interest rates and the other two interest rate series.
Table 3. Stationarity of Interest Rate Differentials
1996:2 – 2006:4 1996:2 – 2000:6 2000:7 – 2006:4 Constant Constant + Trend Constant Constant + Trend Constant Constant + Trend A. China-US ADF -2.002 -2.125 0.581 -2.152 -1.544 -0.577 Lag 8 5 1 1 8 0 B. Hong Kong-US ADF -1.801 -2.720 -3.637** -1.137 -2.135 -2.418 Lag 7 7 0 6 1 1
Note: The table reports results of applying the ADF tests to the interest rate differentials
between China and the US, and between Hong Kong and the US in Panel A and Panel B. The first row lists the time periods covered by the full sample, the first subsample, and the second subsample. “ADF” gives the ADF test statistics. “LAG” gives the lag parameters used in the test procedures. “**” indicates the rejection of the unit root null hypothesis at the 10% level. In all cases, the Box-Ljung Q-statistics calculated from the first 5 and 10 estimated residual autocorrelations are not significant.
The results of testing for the stationarity of interest rate differentials are presented in Table 3. There is only one case in which there is evidence of a stationary interest rate differential series. The ADF test suggests that the Hong Kong and US interest rate differential is stationary between 1996 and 2000.
In sum, there is only very weak evidence of long-run interest rate interactions between China and the US. There is a caveat: the validity of these results depends on whether the interest rate series are stationary or follow a unit root process.
4.2 Vector Autoregression
In this subsection, we consider a few additional specifications for studying interest rate interactions. Specifically, three variants of the vector autoregression (VAR) model are
considered: 1 p t i i t i t Y = +μ
∑
= ΓY− +ε , (7) 1 ' p t i i t i t Y = +μ τ t+∑
= ΓY− +ε , (8) and 1 p t i i t i t Y μ = Y− ε Δ = +∑
Γ Δ + . (9)The three equations have different implicit assumptions about interest rate dynamics. Equations (7) and (8) implicitly assume the interest rate data are stationary around a constant and around a time trend, respectively. Equation (9) accounts for the case in which the data are difference stationary but are not cointegrated; see Shambaugh (2004).
The Wald-type causality test based on exclusion restrictions under the VAR framework is employed to investigate interest rate interactions between the three economies. Four different null hypotheses are considered. They are a) the US interest rate does not cause the Chinese interest rate, b) the Chinese interest rate does not cause the US interest rate, c) the US interest rate does not cause the Hong Kong interest rate, d) the Hong Kong interest rate does not cause the US interest rate. Given the de facto exchange rate arrangements and the dominance of the US, one expects the test will reject the null hypotheses (a) and (c) but not (b) and (d).
The causality test results are summarized in Table 4. For the China and US pair, the results vary across the three VAR specifications and sample periods. The evidence of the US interest rate affecting the Chinese interest rate, in general, is not strong. Instead, there are
non-negligible signs that the US interest rate is influenced by the Chinese interest rate – a result that is not expected from traditional considerations.14
Table 4. Causality Test Results from Vector Autoregression Specifications
US does not cause China
China does not cause US US does not cause HK HK does not cause US Lag Lag A. 1996:2 – 2006:4 Model (7) 12.393 (0.088) 51.956 (0.000) 7 24.781 (0.002) 7.026 (0.534) 8 Model (8) 12.265 (0.092) 50.862 (0.000) 7 27.822 (0.001) 6.534 (0.588) 8 Model (9) 8.924 (0.112) 40.741 (0.000) 5 6.773 (0.010) 6.118 (0.410) 6 B. 1996:2 – 2000:6 Model (7) 0.177 (0.915) 19.725 (0.000) 2 0.262 (0.609) 0.214 (0.643) 1 Model (8) 9.662 (0.290) 33.582 (0.000) 8 0.379 (0.538) 0.012 (0.912) 1 Model (9) 0.144 (0.704) 17.856 (0.000) 1 0.279 (0.597) 0.245 (0.621) 1 C. 2000:7 – 2006:4 Model (7) 5.545 (0.063) 2.502 (0.286) 2 13.327 (0.001) 4.702 (0.095) 2 Model (8) 2.802 (0.246) 0.310 (0.856) 2 7.470 (0.024) 5.454 (0.065) 2 Model (9) 2.525 (0.112) 0.034 (0.854) 1 9.180 (0.002) 3.343 (0.068) 1
Note: The causality test statistics calculated from models (7), (8), and (9) are reported. The null hypotheses are listed in the first row. The lag parameters selected for the VAR models are given under column labeled “Lag.” Panels A, B, and C give results from the full sample, the first subsample and the second subsample, respectively. P-values are included in parentheses underneath the statistics.
For the entire sample, the statistics strongly reject the hypothesis that the Chinese interest
14
While we do not necessarily subscribe to it, there is a view that the US interest rate is affected by China’s policy. For instance, consider the “revived Bretton Woods system” interpretation (Dooley et al., 2003; 2005). China maintains a low currency value to promote exports and, hence, economic growth. It invests its accumulated dollar surpluses in, say US treasuries and, keeps the US interest rate at a low level.
rate does not Granger cause the US interest rate in all the three VAR models – these statistics have a p-value less than 1%. The significant China effect seems contradictory to the conventional argument. On the other hand, the US effect on China is relatively weak – the hypothesis that the US interest rate does not cause the Chinese interest rate is only rejected at the 8.8% level under specification (7), at the 9.2% level under (8), and at the 11.2% level under (9). The most one can infer from these results is that the evidence points to feedback between the two interest rates but China’s effect on the US is more significant that the US effect on China.
For the subsample 1996 to 2000, there is no evidence that the US influenced the Chinese interest rate. China, on the other hand, appears to have had a significant impact on the US interest rate under all the three specifications, with the statistics having p-values of less than 1%. The results for the 2000-2006 subsample are mostly insignificant. The only significant case is found under specification (7) in which the hypothesis of the US does not cause China’s interest rate is rejected at the 6.3% level. There is no evidence that China influenced US interest rates during this period. The results in the first and second subsamples are not consistent with the common belief that China is increasingly integrated with the global economy and its influence on the world is growing in the new millennium.
The full sample results pertaining to the Hong Kong and US pair are largely in line with the US dominance story. The statistics underscore the US influence on the Hong Kong interest rate. In all the three VAR models, the hypothesis of the US interest rate does not cause the Hong Kong interest rate is soundly rejected. Hong Kong, on the other hand, is found not to affect the US interest rate. The result is in accordance with the conventional wisdom that the Hong Kong interest rate should follow the US one because it is a small open economy with capital mobility and is pegged its currency to a large US economy.
The two subsamples, however, give a different picture on the causal relationship between the Hong Kong and the US interest rates. There is evidence of no causality in both directions in the first subsample that covers 1996 to 2000 – the US does not affect Hong Kong and vice versa. The effect of the US on Hong Kong interest rates shows up in the sample spanning 2000 to 2006. During that period, the hypothesis of the US does not cause Hong Kong interest rates is rejected at the 2.4% level or lower. Interestingly, Hong Kong is found to not affect the US at the 5% level but to affect the US at the 10% level. Thus, the Hong Kong effect is detected in the second subsample but not in the whole sample. Since the sample size is smaller in the second subsample,
the results are likely to be driven by some period-specific factors and not by the power argument. Overall, the China and US interest rate interactions revealed by the VAR results are not easily explained by conventional considerations. Specifically, the finding of the weak US effect on China and the significant China effect on the US is not in line with the argument that China loses its monetary policy independence under the de facto fixed exchange rate policy.
The Hong Kong and US results, on the other hand, are a little bit more comforting. They point to the big economy effect on a small open economy Hong Kong. Nonetheless, it is still puzzling to observe the Hong Kong effect on the US.
One observation is that, within each sample period, the causality results are relatively similar among the three VAR specifications, which encompass several assumptions of interest rate dynamics. Thus, the observed limited US effect on Chinese interest rates is not likely due to the model and the related assumed data dynamics.
4.3 The PSS Bounds Test
The validity of the inferences presented in the previous two subsections depends on the stationarity assumption – the data included in the model are assumed to have the same degree of integration. Recently, Pesaran, Shin and Smith (2001) propose a procedure to detect the
dependence of one variable on the others that is robust to the stationarity assumption. We call the test the PSS bounds test. In the current context, the PSS bounds test for testing the dependence between Chinese and US interest rates is based on the following autoregressive distributed lag model of order (p,q): 1 1 , , 1 , 1 1 , , 1 , , , p q CN t CN CN t US US t j CN j CN t j j US j US t j US t t Y c ϕ Y − ϕ Y − =−ψ Y − =−ψ Y − ω Y ε Δ = + + +
∑
Δ +∑
Δ + Δ + , (10)where YCN t, and YUS t, are, respectively, the Chinese and the US interest rates. Under the null hypothesis of ϕCN= ϕUS = 0, there is no relationship between the Chinese and US interest rates. As suggested by Pesaran, Shin and Smith (2001), we use a flexible dynamic specification and do not restrict changes in the Chinese and US interest rates to have the same lag structure.
One important assumption underlying the test is that the Chinese level variable YCN t,
does not cause the US level variable YUS t,. Thus, the test implicitly imposes a conditional relationship between the two variables. It, however, does not preclude the possibility that changes in YUS t, (ΔYUS t, ’s) are affected by changes in YCN t, (ΔYCN t, ’s). The assumption may
appear innocuous given the prominence of the US in both the international financial market and the global economy. To shed some light on the assumption, we will apply the PSS bounds test to an alternative specification later in this subsection.
Pesaran, Shin and Smith (2001) derive critical value bounds based on two sets of distribution functions to cover cases in which the right-hand-side variables in (10) are
individually trend or individually difference stationary. Thus, the price for the robustness is the possibility of an inconclusive inference if the test statistic falls within the bounds.15 For the Hong Kong and US interest rates, their interactions are investigated with the Hong Kong data replacing the Chinese data in (10).
Table 5. Bounds Tests on the Dependence of the Chinese Interest Rates
2/1996 – 4/2006 2/1996 – 6/2000 7/2000 – 4/2006 Constant 0.107 (1.015) 0.279 (0.147) 0.216 (1.109) 1 − CN -0.052* (-2.719) -0.018 (-0.430) -0.088 (-1.294) 1 − US -0.002 (-0.062) -0.087 (-0.263) 0.001 (0.072) 1 − ΔCN -0.583* (-6.574) -0.659* (-4.194) -0.228* (-2.055) 2 − ΔCN -0.184* (-2.049) -0.269 (-1.768) - 5 − ΔCN 0.143 (1.828) - - 6 − ΔCN - - -0.119 (-1.727) 12 − ΔCN 0.183* (2.301) 0.460* (2.557) - 2 − ΔUS -0.440 (-1.970) - - 2 Adjusted R 0.395 0.425 0.144 F-statistic 5.110 0.114 0.846 15
The exact critical value can be derived with information about the stationarity of the explanatory variables. The situation is similar to the use of Durbin-Watson statistic – the exact distribution of the statistic depends on information about the explanatory variables.
Note: The PSS bounds test results with the change in the Chinese interest rate as the dependent variable are reported. The first row lists the time periods covered by the full sample, the first subsample, and the second subsample. The row labelled “F-statistic” gives the statistics for testing the hypothesis that both the coefficients of CN−1 and US−1 are zero
(that is, the hypothesis of ϕCN=ϕUS= 0). The upper bound of the 5% critical value is 5.73 for the three sample periods.
The PSS bounds test results for the Chinese data are presented in Table 5. To facilitate discussion, estimates of (10) are also included. The lag parameters p and q are chosen to render insignificant serial correlation in the estimated residuals. Only significant lagged differences are reported for brevity.
The F-statistics for the null hypothesis of ϕCN= ϕUS = 0 are listed in the last row of the Table. According to the critical values tabulated in Pesaran, Shin and Smith (2001) the bounds test statistics are not significant for the three samples under consideration. There is no evidence of the presence of a level relationship and the US impact on the Chinese interest rate. It is noted that the test results based on a less stringent assumption on data dynamics corroborate the cointegration results reported in the previous subsection.
Despite the absence of a level relationship, estimates of (10) show that changes in the Chinese interest rates respond to variations in the US interest rates. The US effect is, however, only revealed in the full sample but not in the two subsamples. Further, changes in the US rates have an overall negative effect on the Chinese rates in the entire sample. The negativity result, again, does not lend strong support to the contention that China’s policy follows the US policy.
The bounds test and the associated regression results for the Hong Kong specification are given in Table 6. The adjusted R-squares in Table 6 range from 70% to 47%, which are higher than the range of 43% to 14% reported in Table 5. Apparently, the autoregressive distributed lag (p,q) model (10) fits the Hong Kong data better than the Chinese data. It is interesting to note that, in both cases, the second subsample gives the lowest adjusted R-squares.
There are a few observations from Table 6. First, using the appropriate bounds test critical values, the F-statistic rejects the hypothesis of ϕHK=ϕUS= 0 in the full sample and the first subsample. Second, the ϕHK and ϕUS estimates are similar in magnitudes but different in their signs during the full sample and the second subsample. Third, changes in the US interest rate have almost a one to one impact on changes in the Hong Kong interest rate in the full sample
and first subsample. Fourth, even the F-statistic does not reject the null hypothesis, the second to fourth observations hold for the second subsample.
Table 6. Bounds Tests on the Dependence of the Hong Kong Interest Rates
Note: The PSS bounds test results with the change in the Hong Kong interest rate as the dependent variable are reported. The first row lists the time periods covered by the full sample, the first subsample, and the second subsample. The row labelled “F-statistic” gives the statistics for testing the hypothesis that both the coefficients of HK−1 and US−1
are zero (that is, the hypothesis of ϕHK=ϕUS= 0). The upper bound of the 5% critical value is 5.73 for the three sample periods.A significant 1997 financial crisis dummy variable is included in the full sample and first subsample.
While the results are not uniformly confirmative, the observations listed above are indicative of the presence of the US effect and the dependence of the Hong Kong interest rate on the US rate. Further, in comparing results in Tables 5 and 6, we observe that the US effect on Hong Kong is more prominent than on China.
Tables 7 and 8 give the bounds test and regression results pertaining to the specification
2/1996 – 4/2006 2/1996 – 6/2000 7/2000 – 4/2006 Constant -0.188 (-1.874) - -0.110 (-1.776) 1 − HK -0.265* (-6.328) -0.395* (-4.684) -0.121* (-2.086) 1 − US 0.298* (5.304) 0.429* (4.256) 0.136* (2.282) 1 − ΔHK 0.128* (2.393) 0.210* (2.282) - 2 − ΔHK 0.168* (3.065) 0.231* (2.486) - 3 − ΔHK -0.251* (-3.273) - - 11 − ΔHK - - -0.169* (-2.013) US Δ 1.074* (5.198) 1.078* (2.129) 0.931* (6.270) 2 .R Adj 0.792 0.809 0.471 F test 20.851 12.394 2.661
1 1 , , 1 , 1 1 , , 1 , , , p q US t i i t US US t j US j US t j j i j i t j i t t Y c ϕY − ϕ Y − =−ψ Y − =−ψ Y − ω Y ε Δ = + + +
∑
Δ +∑
Δ + Δ + , (11)where i = China and Hong Kong. Similar to the remark made for (10), if we apply the PSS bounds test to (11) to infer the level relationship between the US and, say, the Hong Kong interest rates, we implicitly assume that the US interest rate YUS t, does not cause the Hong Kong rate YHK t,. Knowing that this may not be a viable assumption, we do not literally interpret the statistics reported in the table but, rather, treat them as preliminary results that are indicative of interest rate interactions.
Table 7. Bounds Tests on the Dependence of the US Interest Rates (on the Chinese Rates)
2/1996 – 4/2006 2/1996 – 6/2000 7/2000 – 4/2006 Constant 0.047 (1.176) 1.242* (3.293) 0.185 (1.663) 1 − CN 0.004 (0.550) -0.013 (-1.826) -0.027 (-0.697) 1 − US -0.017 (-1.522) -0.205* (-2.894) -0.040* (-3.830) 1 − ΔUS 0.419* (4.830) 0.310* (2.601) 0.467* (4.967) 2 − ΔUS - 0.387* (3.267) - 3 − ΔUS 0.208* (2.500) 0.413* (3.676) - 4 − ΔUS - 0.253* (2.438) 0.293* (3.103) 5 − ΔUS - 0.322* (3.471) - 12 − ΔUS 0.473* (5.575) 1.410* (10.178) 0.175* (2.313) 13 − ΔUS -0.393* (-4.376) - - 2 Adjusted R 0.409 0.782 0.600 F-statistic 1.216 7.676 7.481
Note: The PSS bounds test results with the change in the US interest rate as the dependent variable are reported. The first row lists the time periods covered by the full sample, the first subsample, and the second subsample. The row labelled “F-statistic” gives the statistics for testing the hypothesis that both the coefficients of US−1 and CN−1 are zero
for the three sample periods.
Table 8. Bounds Tests on the Dependence of the US Interest Rates (on the Hong Kong Rates) 2/1996 – 4/2006 2/1996 – 6/2000 7/2000 – 4/2006 Constant 0.059 (1.382) 0.409 (1.156) 0.104* (2.625) 1 − HK 0.007 (0.475) -0.009 (-0.714) -0.013 (-0.371) 1 − US -0.022 (-1.076) -0.061 (-0.882) -0.027 (-0.724) 1 − ΔUS 0.425* (4.895) 0.556* (3.283) 0.476* (5.107) 3 − ΔUS 0.203* (2.465) - - 4 − ΔUS - - 0.302* (3.223) 12 − ΔUS 0.471* (5.567) 1.163* (8.233) 0.173* 2.242 13 − ΔUS -0.392* (-4.336) -0.957* (-4.177) - 2 Adjusted R 0.408 0.722 0.598 F-statistic 1.177 1.066 7.268
Note: The bounds test results with the change in the US interest rate as the dependent variable are reported. The first row lists the time periods covered by the full sample, the first subsample, and the second subsample. The row labelled “F-statistic” gives the statistics for testing the hypothesis that both the coefficients of US−1 and HK−1 are zero (that is, the hypothesis of ϕHK=ϕUS= 0). The upper bound of the 5% critical value is 5.73 for the three sample periods.
One observation from both Tables 7 and 8 is that all the differences between the Chinese and Hong Kong interest rates are not significant and, thus, not reported. That is, the variations of the US interest rate respond neither to the Chinese nor Hong Kong interest rate changes. While two bounds test statistics in Table 7 and one statistic in Table 8 are significant, the lagged levels of the Chinese and Hong Kong rates; YCN t, 1− and YHK t, 1− , do not appear significant. Even with the reservation about inference stated in the previous graph, the two tables offer some heuristic evidence that the US interest rate is independent of the Chinese or Hong Kong interest rate.
5. Discussion
For an astute reader, the statistical evidence presented in the previous section just
formalizes the inferences about interest rate interactions depicted in Figures 1 to 4. However, it is noted that the empirical evidence does not rule out the possible dependence of the Chinese policy on the US policy. Theoretically, the degree of interest rate pass through under a fixed exchange rate arrangement depends on, for example, the extent of capital control and the relevancy of the small economy assumption. China does not appear to meet the assumptions for perfect interest rate pass through. Our empirical evidence indicates China has alternative measures to de-link its interest rates from the US rate.
The goal of China’s monetary policy is to “preserve the value of (its) currency and promote economic growth”.16 Even before the 1997 Asian financial crisis, China has
emphasized the importance of stability for economic growth. With its exchange rate effectively pegged to the US dollar, China has a number of policy measures to manage its domestic
economy and to avoid significant economic turmoil. These measures include interest rate
adjustment, reserve requirements, and open market operations. Recently, the Chinese authorities have been experimented with these policy options to manage its economy. There is evidence that China has increased the reign of market mechanisms. For instance, the changes in official
interest rates and reserve requirements in 2005 and 2006 are widely interpreted as the evidence of an increasing role for these policy measures in macroeconomic management.
Even with the increasing deployment of market mechanisms, capital control is the often cited administrative means that shields China from external financial disturbances. It is perceived that the de jure capital control is less effective than the de facto regulation. Nonetheless, the latter can be proved important at the time of crisis in managing capital flows. Last, but not the least, official guidelines and fiats are still important elements of the conduit of monetary policy despite the recent reduction of direct government intervention. Apparently, these policy and
administrative measures help insulate China from the US monetary policy even under a de facto
fixed rate arrangement.
One indicator of China’s ability to manage its economy is its economic performance after 1994, the year that the RMB adopted the de facto peg. In the post-1994 era – including the Asian
16
financial crisis period – China has enjoyed relatively stable inflation and strong economic growth. Apparently, China is able to use various policy and administrative measures to keep its economy under control and avert major fiascos with the de facto peg in place. Nonetheless, it suggests neither that there is no (substantial) cost in maintaining the peg with the US dollar nor that macro management is free of troubles.
The Chinese experience should be proved an interesting case study of migrating from a centrally planned economy to a market-driven economy. The emphasis on stability in general and on exchange rate stability in particular, offers a credible environment to implement the
gradualism approach of economic reform. While the reform process has encountered difficulties of various natures, the overall result is very impressive. So far, the reform process leads to one of the most successful economic expansion stories in history.
While the quest for a flexible RMB exchange rate policy may be of good intention, it implicitly assumes that China does not understand what is good for itself. From China’s point of view, the 1997 crisis and the recent 2006 Thailand financial market turmoil buttress the
importance of stability for economic development. Against this backdrop, it is not difficult to comprehend the China’s policy of pursuing a measured program to liberalize its exchange rate policy and, at the same time, to strengthen its financial markets and re-tool its real sector.
6. Concluding Remarks
In this exercise, we examine one argument put forth in the recent debate on China’s exchange rate policy. Specifically, we consider the assertion that a flexible RMB exchange rate is beneficial to China because exchange rate flexibility offers policy independence and allows China to pursue its own monetary policy to tackle domestic economic issues.
We do not predict whether a flexible RMB exchange rate will enhance China’s policy autonomy. Instead, we investigate the degree of dependence under the existing de facto pegged exchange rate arrangement via interest rate pass through between the two economies. The
interaction between the Hong Kong and US interest rates is used as a benchmark for comparison. In general, the empirical evidence of the US effect on the Chinese interest rate is quite weak while the US interest rate pass through is quite strong for Hong Kong.
One feature of the current study is that interest rate interactions are examined under several possible scenarios. The general inference of weak US effects on Chinese interest rates is
drawn from models and techniques that allow for different assumptions of data persistence and from a few historical periods. In other words, the result is not driven by a specific choice of model specification. The robustness of the finding casts serious doubt on the relevance of the argument that the existing de facto fixed exchange rate arrangement ties China’s policy to the US policy. Even with the current de facto fixed exchange rate arrangement, there is no substantial evidence that the Chinese interest rate is driven by the US rate.
Conceivably, there is antagonism towards the statistical evidence of the absence of China’s policy dependence. Our intention is not to divert the discussion of RMB policy to a pure statistical analysis. Instead, our objective is to provide a reasonably robust empirical evidence to facilitate the discussion of the presence or absence of policy dependence. Given the extant ambivalent theoretical and empirical results on the exchange rate regime effect on policy
dependence and our findings of weak US effects on China’s interest rates, it seems prudential to be circumspect in asserting the benefit of policy independence from floating RMB.
The point is, given the current economic reality, whether it is the right time for China to exit from the current exchange rate system that has worked quite well in the last decade. While we believe that a market determined RMB exchange rate offers considerable economic benefits including an efficient allocation of resources, our concern is whether the relatively
underdeveloped Chinese financial markets can effectively handle the associated volatility and uncertainty. One practical view is to take full RMB convertibility a medium to long-term policy objective. Some commonly mentioned preconditions for the RMB to exit from the peg include reforms in the financial sector and in the setting of monetary and policies. It is also perceived that some obstacles to liberalize the exchange rate arrangement are the high level of
non-performing loans in the banking industry, the lack of corporate governance, and rigidities in the labor market. In sum, there is substantial risk in liberalizing the RMB before China’s
economy has established a sound financial sector and capital market and reduced impediments in the real sector.
Given China’s increasing influence, a badly-timed and hasty exit from the pegged RMB policy may create adverse rippling effects in the international community. Undeniably, China faces some very complex problems. It is not our objective here to elaborate on various arguments for China to maintain the status quo of its exchange rate system. Instead, our exercise, at the risk of repeating ourselves, indicates that the argument for a flexible RMB to insulate China’s
References
Bergin, Paul R. and Òscar Jordà (2004), “Measuring monetary policy interdependence,” Journal
of International Money and Finance,23, 761–783.
Borensztein, Eduardo, Jeromin Zettelmeyer, and Thomas Philippon (2001), “Monetary Independence in Emerging Markets: Does the Exchange Rate Regime Make a Difference?” IMF Working Paper WP/01/1.
Calvo, Guillermo and Carmen Reinhart (2002), “Fear of Floating,” Quarterly Journal of
Economics, 117, 379-408.
Cheung, Yin-Wong and Jude Yuen (2002), “Effects of U.S. inflation on Hong Kong and Singapore,” Journal of Comparative Economics, 30, 603-619.
Cheung, Yin-Wong, Menzie D. Chinn, and Eiji Fujii (2005), “The Overvaluation of Renminbi Undervaluation,” manuscript, UCSC.
Cheung, Yin-Wong and Kon S. Lai (1995), “Lag Order and Critical Values of the Augmented Dickey-Fuller Test,” Journal of Business & Economic Statistics, 13, 277-280.
Cheung, Yin-Wong and Kon S. Lai (1995), “Finite-Sample Sizes of Johansen's Likelihood Ratio Tests for Cointegration,” Oxford Bulletin of Economics and Statistics, 55, 313-328. Chinn, Menzie and Jeffrey A. Frankel (1995) “Who Drives Real Interest Rates around the Pacific
Rim: The US or Japan?” Journal of International Money and Finance, 14, 801-821. Corden, Max W. (1985), Inflation Exchange Rates and the World Economy, Oxford: Clarendon
Press.
Dai, Xianglong (2004), “China’s Monetary Policy in the Coming Years,” Speech given at the Bank of China Forum, March 16, 2002, Beijing.
Devereux, Michael B. and Charles Engel (1999), “Fixed vs. Floating Exchange Rates: How Price Setting Affects the Optimal Choice of Exchange-Rate Regime.” National Bureau of Economic Research Working Paper No. 6867, Cambridge: NBER.
Dooley, Michael, David Folkerts-Landau, and Peter Garber (2003), “An Essay on the Revived Bretton Woods System,” NBER Working Paper No. 9971, Cambridge: NBER
Dooley, Michael, David Folkerts-Landau, and Peter Garber (2005), International Financial Stability: Asia, Interest Rates, and the Dollar, Deutsche Bank Global Research. Eichengreen, Barry (2006), “China’s Exchange Rate Regime: The Long and Short of It,”
Evans, G.B.A. and Savin, N.E. (1984), “Testing for unit roots: 2,” Econometrica, 52, 1241-1269. Frankel, Jeffrey A. (1999), “No Single Currency Regime is Right for All Countries or at All
Times.” NBER Working Paper No. 7338, Cambridge: NBER.
Frankel, Jeffery A., Sergio L. Schmukler, and Luis Serven (2004), “Global Transmission of Interest Rates: Monetary Independence and Currency Regime,” Journal of International
Money and Finance, 23, 701-734.
Friedman, Milton (1953), “The Case for Flexible Exchange Rates,” in Milton Friedman, eds.,
Essays in Positive Economics, pp. 157-203, Chicago: University of Chicago Press. Ghosh, Atish R., Anne-Marie Gulde, Jonathan D. Ostry, and Holger C. Wolf (1997), “Does the
Nominal Exchange Rate Regime Matter?” NBER Working Paper No. 5874, Cambridge: NBER.
Goldstein, Morris (2004), “Adjusting China’s Exchange Rate Policies,” manuscript, Institute for International Economcis.
Goodfriend, Marvin and Eswar Prasad (2006), “A Framework for Independent Monetary Policy in China,” IMF Working Paper WP/06/11.
Hausmann, Ricardo, MichaelGavin, Carmen Pages-Serra, and Ernesto Stein (1999), “Financial Turmoil and the Choice of Exchange Rate Regime,” Inter-American Development Bank, Research Department Working Paper No. 400.
Hausmann, Ricardo, Ugo Panizza, and Ernesto Stein (2001), “Why Do Countries Float the Way They Float?” Journal of Development Economics, 66, 387-414.
Imam, Michael (2004), “The Chinese Interbank Markets: Cornerstone of Financial Liberalization,” China & the World Economy, 12, 17-33.
Johansen, Soren, (1991), “Estimation and hypothesis testing of cointegration vectors in Gaussian vector autoregressive models,” Econometrica, 59, 1551-1580.
Li, Yang and Xianyun Peng (2002), “The Money Market In China: Theory and Practice,” China and & World Economy, 10, 3-10.
McCallum, Bennett T. (2004), “China’s Exchange Rate and Monetary Policy,” Shadow Open Market Committee.
McKinnon, Ronald I. (2005), “Exchange Rates, Wages, and International Adjustment: Japan and China versus the United States,” China & World Economy, 13, 11-27.
a Liquidity Trap?” The Economists’ Voice 3, Article 2.
Mundell, Robert (2004), “China’s Exchange Rate: The Case for the Status Quo,” Paper presented at IMF seminar on “The Foreign Exchange System,” Dalian, China, May 26–27.
Mussa, Michael L. (1979), “Macroeconomic Interdependence and the Exchange Rate Regime,” in Rudiger Dornbusch and Jeffrey Frenkel, eds., International Economic Policy: Theory
and Evidence, pp. 160-199, Baltimore and London: The Johns Hopkins University Press.
Pesaran, M. Hashem, Yongcheol Shin, and Richard Smith (2001), “Bounds Testing Approaches to the Analysis of Level Relationships,” Journal of Applied Econometrics, 16, 289–326. Quirk, Peter J. (1994), “Fixed or Floating Exchange Rate Regimes: Does it Matter for Inflation?”
IMF Working Paper No. 94/134.
Roberts, Ivan and Rod Tyers (2003), “China’s Exchange Rate Policy: The Case For Greater Flexibility,” Asian Economic Journal, 17, 155-184.
Salant, Walter S. (1977), “International Transmission of Inflation.” in Lawrence B. Krause and Walter S. Salant,eds., Worldwide Inflation, pp. 167-232, Washington, D.C.: Brookings Institution.
Schwartz, Anna J. (2005), “Dealing With Exchange Rate Protectionism,” Cato Journal 25, 97-106.
Shambaugh, Jay C. (2004), “The Effect of Fixed Exchange Rates on Monetary Policy,”
Quarterly Journal of Economics, 119, 301-352.
West, Kenneth D. (1987), “A note on the power of least squares tests for a unit root,” Economics Letters, 24: 249-252.
Williamson, John (2005), “The Choice of Exchange Rate Regime: The Relevance of International Experience to China’s Decision,” China & World Economy, 13, 17-33. Xie, Duo (2002), “Analysis of the development of China’s money market,” China & the World
CESifo Working Paper Series
(for full list see Twww.cesifo-group.de)T___________________________________________________________________________
1880 Peter Huber, Michael Pfaffermayr and Yvonne Wolfmayr, Are there Border Effects in
the EU Wage Function?, December 2006
1881 Harry Flam and Håkan Nordström, Euro Effects on the Intensive and Extensive Margins
of Trade, December 2006
1882 Panu Poutvaara and Mikael Priks, Hooliganism in the Shadow of the 9/11 Terrorist
Attack and the Tsunami: Do Police Reduce Group Violence?, December 2006
1883 Ruud A. de Mooij and Gaëtan Nicodème, Corporate Tax Policy, Entrepreneurship and
Incorporation in the EU, December 2006
1884 Johannes Becker and Clemens Fuest, Corporate Tax Policy and International Mergers
and Acquisitions – Is the Tax Exemption System Superior?, January 2007
1885 Momi Dahan and Udi Nisan, The Effect of Benefits Level on Take-up Rates: Evidence
from a Natural Experiment, January 2007
1886 José García-Solanes, Francisco I. Sancho-Portero and Fernando Torrejón-Flores,
Beyond the Salassa-Samuelson Effect in some New Member States of the European Union, January 2007
1887 Peter Egger, Wolfgang Eggert and Hannes Winner, Saving Taxes Through Foreign
Plant Ownership, January 2007
1888 Timothy J. Goodspeed and Andrew Haughwout, On the Optimal Design of Disaster
Insurance in a Federation, January 2007
1889 Wim Groot, Henriëtte Maassen van den Brink and Bernard van Praag, The
Compensating Income Variation of Social Capital, January 2007
1890 Bas Jacobs, Ruud A. de Mooij and Kees Folmer, Analyzing a Flat Income Tax in the
Netherlands, January 2007
1891 Hans Jarle Kind, Guttorm Schjelderup and Frank Stähler, Newspapers and Advertising:
The Effects of Ad-Valorem Taxation under Duopoly, January 2007
1892 Erkki Koskela and Rune Stenbacka, Equilibrium Unemployment with Outsourcing
under Labour Market Imperfections, January 2007
1893 Maarten Bosker, Steven Brakman, Harry Garretsen, Herman de Jong and Marc
Schramm, The Development of Cities in Italy 1300 – 1861, January 2007
1894 Michel Beine, Oscar Bernal, Jean-Yves Gnabo and Christelle Lecourt, Intervention
1895 Robert S. Chirinko and Daniel J. Wilson, State Investment Tax Incentives: A Zero-Sum Game?, January 2007
1896 Theo S. Eicher and Oliver Roehn, Sources of the German Productivity Demise –
Tracing the Effects of Industry-Level ICT Investment, January 2007
1897 Helge Berger, Volker Nitsch and Tonny Lybek, Central Bank Boards around the World:
Why does Membership Size Differ?, January 2007
1898 Gabriel Felbermayr and Wilhelm Kohler, Does WTO Membership Make a Difference at
the Extensive Margin of World Trade?, January 2007
1899 Benno Torgler and Friedrich Schneider, The Impact of Tax Morale and Institutional
Quality on the Shadow Economy, January 2007
1900 Tomer Blumkin and Efraim Sadka, On the Desirability of Taxing Charitable
Contributions, January 2007
1901 Frederick van der Ploeg and Reinhilde Veugelers, Higher Education Reform and the
Renewed Lisbon Strategy: Role of Member States and the European Commission, January 2007
1902 John Lewis, Hitting and Hoping? Meeting the Exchange Rate and Inflation Criteria
during a Period of Nominal Convergence, January 2007
1903 Torben M. Andersen, The Scandinavian Model – Prospects and Challenges, January
2007
1904 Stephane Dees, Sean Holly, M. Hashem Pesaran and L. Vanessa Smith, Long Run
Macroeconomic Relations in the Global Economy, January 2007
1905 Richard Jong-A-Pin and Jakob De Haan, Political Regime Change, Economic Reform
and Growth Accelerations, January 2007
1906 Sascha O. Becker and Peter H. Egger, Endogenous Product versus Process Innovation
and a Firm’s Propensity to Export, February 2007
1907 Theo S. Eicher, Chris Papageorgiou and Oliver Roehn, Unraveling the Fortunates of the
Fortunate: An Iterative Bayesian Model Averaging (IBMA) Approach, February 2007
1908 Liliana E. Pezzin, Robert A. Pollak and Barbara S. Schone, Efficiency in Family
Bargaining: Living Arrangements and Caregiving Decisions of Adult Children and Disabled Elderly Parents, February 2007
1909 Christian Keuschnigg and Soren Bo Nielsen, Self-Selection and Advice in Venture
Capital Finance, February 2007
1910 Rune Jansen Hagen and Gaute Torsvik, Irreversible Investments, Dynamic
1911 Eric A. Hanushek and Ludger Woessmann, The Role of School Improvement in Economic Development, February 2007
1912 Bernard M. S. van Praag, Perspectives from the Happiness Literature and the Role of
New Instruments for Policy Analysis, February 2007
1913 Volker Grossmann and Thomas M. Steger, Growth, Development, and Technological
Change, February 2007
1914 Margarita Katsimi and Thomas Moutos, Human Capital and the Feldstein-Horioka
Puzzle, February 2007
1915 Oliver Roehn, Theo S. Eicher and Thomas Strobel, The Ifo Industry Growth
Accounting Database, February 2007
1916 Ian Babetskii, Aggregate Wage Flexibility in Selected New EU Member States,
February 2007
1917 Burkhard Heer, Alfred Maussner and Paul D. McNelis, The Money-Age Distribution:
Empirical Facts and Limited Monetary Models, February 2007
1918 Yin-Wong Cheung, Menzie D. Chinn and Eijii Fujii, The Overvaluation of Renminbi
Undervaluation, February 2007
1919 Jim Malley, Apostolis Philippopoulos and Ulrich Woitek, To React or Not? Fiscal
Policy, Volatility and Welfare in the EU-3, February 2007
1920 Mattias Polborn, Competing for Recognition through Public Good Provision, February
2007
1921 Lars P. Feld and Benno Torgler, Tax Morale after the Reunification of Germany:
Results from a Quasi-Natural Experiment, February 2007
1922 Robert S. Chirinko and Huntley Schaller, Fundamentals, Misvaluation, and Investment:
The Real Story, February 2007
1923 Benno Torgler and Friedrich Schneider, Shadow Economy, Tax Morale, Governance
and Institutional Quality: A Panel Analysis, February 2007
1924 Adrian Pagan and M. Hashem Pesaran, On Econometric Analysis of Structural Systems
with Permanent and Transitory Shocks and Exogenous Variables, February 2007
1925 Hans-Werner Sinn, The Welfare State and the Forces of Globalization, February 2007
1926 Michael Smart, Raising Taxes through Equalization, February 2007
1927 Øystein Foros, Kåre P. Hagen and Hans Jarle Kind, Price-Dependent Profit Sharing as