PDF hosted at the Radboud Repository of the Radboud University
Nijmegen
The following full text is a publisher's version.
For additional information about this publication click this link.
http://hdl.handle.net/2066/83271
Please be advised that this information was generated on 2017-12-06 and may be subject to
change.
NiCE Working Paper 11-101
2011
Effects of IMF programs on school enrollment in
developing countries
Martijn Vranken
Jeroen Smits
Eelke de Jong
Nijmegen Center for Economics (NiCE)
Institute for Management Research
Radboud University Nijmegen
P.O. Box 9108, 6500 HK Nijmegen, The Netherlands http://www.ru.nl/nice/workingpapers
Abstract
The IMF is one of the most heavily criticized international financial institutions in the world and has been accused of having a negative effect on education. By using multi-level analyses, this paper estimates the effects of IMF supported programs on the growth in school enrollment in developing countries at the district level for girls and boys aged 9-11 and 12-14. Using data on 44 countries, containing 431 districts between 1997-2007, effects of IMF programs are measured in three ways. Effects are estimated for whether or not a country has an IMF program, followed by a comparison between short and long-term programs. The effects of different program
characteristics are also estimated. Results indicate that short-term IMF programs have significant positive effects on the growth in school enrollment for girls and boys aged 9-11. These effects are more positive in more rural areas and in less developed regions. Labor market reforms are found to have strong negative significant effects for girls and boys in both age groups, with stronger effects in more urban and more developed districts. Policies to decrease the level of corruption, the level of public debt and increases in net international reserves have positive effects on the growth in schooling, with stronger effects for different interactions.
Martijn Vranken is a graduate in International Economics from Radboud University Nijmegen. Jeroen Smits, Department of Economics, Radboud University Nijmegen. [email protected] Eelke de Jong, Department of Economics, Radboud University Nijmegen. [email protected] Address: P.O Box 9108, 6500 HK, Nijmegen.
The International Monetary Fund (IMF) provides loans to members in order to shorten the duration and lessen the disequilibrium in the members’ balance o f payments. The resulting stability is expected to increase growth and per capita income. Since the Fund’s resources are limited, the standard loans have a maturity of 3 to 4 years and conditions are attached to them. Originally these conditions were general in the sense that they require the government to devalue the currency and to reduce government deficits. No directives were given with respect to the way the rulers had to reduce expenses or
increase taxes. Conditions became more specific at the time an increasing number of less developed countries became borrowers from the Fund. The rulers in these countries cut expenses benefiting the poor, such as expenditure on education and health care, while at the same time other expenses, such as those for military equipment were not reduced. As a reaction Non Governmental Organizations (NGOs) criticized the IMF and plead for an exception of expenditures for sectors such as education and health care from the
requirements to reduce the budget deficit.
As a reaction on this critique, in 1997 the IMF has introduced guidelines on social expenditures. According to these guidelines “IMF staff should continue to monitor developments in basic social indicators, such as poverty rates, infant mortality, life expectancy, illiteracy, school enrollment, and access to basic social services. In countries where such indicators are worsening or failing to improve in line with other developing countries, IMF staff should seek W orld Bank advice, and, if necessary, raise this issue with the authorities” (IMF, 2003, p.55). The Fund should also take these considerations into account when approving the letters of intent, which should promote educational spending and efficiency in the education sector in order to raise school enrollment rates.
Nevertheless, many N G O ’s and academics, still consider the IMF conditions to be too harsh and to have too many negative effects. Fund programs have been called ‘anti growth’, are said to force countries to lower government spending leading to lower public spending on education and health and are suspected to hurt the poor most (Action Aid, 2007; Chossudovsky, 1997; Garuda, 2000). Moreover, the IMF has been accused of ‘doing too m uch’. That is, it not only focuses on its core activities (i.e. macroeconomic and exchange rate policies), but also more and more on structural policy in other areas
such as corporate governance, trade policy, privatization, poverty reduction and the environment (Ilón, 1994; Bird, 1996; Bordo & James, 2000; Feldstein, 1998; Butkiewicz & Yanikkaya, 2005).
Empirical studies on the effects of IMF programs do not help in judging who is right or wrong. The results are ambiguous, whether one makes use of case studies or cross-country regression techniques. Much of this research focuses on the impact of IMF programs on economic growth (see e.g. Atoyan & Conway, 2005; Dreher, 2006 and Easterly, 2005), the inflow of capital and thus the elevation of balance of payments problems ( Bird & Rowlands, 2008; Mody & Saravia, 2003), and inflation (Dicks- Mireaux et. al, 2000; Haque & Khan, 1998). The literature is scarce on the effects on education and health care - the focus of much of the critique on the IMF programs. The few papers on this topic also come with different results. Martin & Segura-Obiergo (2004) claim that IMF programs tend to maintain or even increase spending in health care and education measured as either a share of GDP, total expenditures or in real per capita terms. The effect of the IMF program is relatively small and short-lived and particularly significant for countries which are continuing (but not necessarily chronic) clients of the IMF. On the other hand, Nouruddin & Simmons (2006) provide evidence that IMF programs cause a reduction in spending on education and health care. NGOs, such as Action Aid (2007) and Bretton Woods Project (2007), argue that IMF policies led to excessively low wage bill ceilings and promote a decline in public spending on
education. There are also a few case studies suggesting that IMF policies led to lower opportunities for schooling and a decrease in public spending in Tanzania and Ghana (Konadu-Agyemang (2000) and Vavrus (2005)). As far as we know, no systematic cross country investigation of the impact of IMF programs on schooling has been made.
This paper intends to fill this gap. It investigates the effects of IMF programs and their characteristics on the change in school enrollment in 44 developing countries. School enrollment is measured at the district level, which results in 431 districts within these 44 countries. W e study the effects for boys and girls separately. Moreover we make a distinction between primary school aged children and those in lower secondary school. This set-up allows us to investigate the gender effects and the effects on primary and secondary education separately. Since these districts are clustered in countries, we apply
a multilevel technique. The dataset includes both countries which signed and those which did not sign an IMF program. Moreover, we have collected data on the conditions
included in the letters of intent, in particular whether agreements are made with respect to education and labor market reforms.
We start with an investigation of the effects on school enrollment of IMF
programs as such, without making any distinction between the type of program. W e find no significant effects. Subsequently we make a distinction between short-term and long term programs. It appears that long-term programs do not have any effect, whereas short term programs enhance school enrollment at the district level. This result is opposite to that suggested by the IM F’s critics. Finally, we ask ourselves whether the type of conditions in the letters of intent matter. Here we distinguish between conditions
referring to the stabilization of the economy (public debt reduction, increase or stabilize the level of international monetary reserves, and fighting corruption) and specific
conditions, such as labor market reforms, wage bill ceilings and shielding the educational expenditures from budget cuts. W e find that conditions referring to the stabilization of the economy enhance school enrollment, whereas the specific conditions reduce school enrollment. In the latter cases negative results are found for all types of measures; labor market reform, wage bill ceilings, and increases in educational spending. This last affect is very surprising and contrary to the expectations of many involved in enhancing the position of the poor in the developing world. The finding that measures aimed at
stabilizing the economy have more positive effects for the poor than conditions targeted at a specific goal (such as educational expenditures) is in accordance with the results of Dollar and Kraay (2002), who did not find any effect of public spending on health and education on the income share of the poor. Some weak but positive effects on the income share of the poor were found for smaller government size and stabilization from high inflation. Since in developing countries, governments are known to be corrupt, the smaller government size can stand for anti-corruption measures in our paper.
The setup of the rest of the paper is as follows. In the next section we present the theoretical framework used to distinguish the channels by which IMF programs influence school enrollment. Thereafter, we present the way we have measured the level and change in school enrollment and describe its characteristics across countries. Section 4
discusses the IMF programs and the forms of its conditionality. The motivation and description of the control variables are presented in Section 5. Section 6 is devoted to results, whereas Section 7 concludes.
2. Theoretical Framework
The IMF
A member country (rich or poor) can turn to the IMF for financial assistance when it faces balance of payments problems and cannot find sufficient financing on affordable terms in the capital markets to make its international payments and maintain an
appropriate level of reserves. The main objective of IMF loans is to help members to overcome the balance of payments problems, stabilize their economies and restore
sustainable economic growth. Both the IMF and the government then agree on a program including policies which are aimed at achieving specific, quantified goals. To make sure member countries implement the specific programs, loans are provided periodically, conditional on the targets and goals met.
The Fund offers several types of loans and conditions attached to them. The Standby Arrangement (SBA) is the standard IMF loan aimed at providing relieve for short-term balance of payments problems. The duration of a SBA is typically between 12 and 18 months and the loan should be repaid within 2,5 to 4 years. If the country is confronted with protracted balance of payments problems it can make use of the Extended Fund Facility (EFF). The typical duration of an EFF-loan is 3 years and the amount obtained should be repaid within 7 years maximum. The conditions attached to an EFF-loan are more severe than those of an SBA and are directed at structural reforms. For an SBA or EFF the country has to pay market-related interest rates and service charges plus a refundable commitment fee.1
Besides of these traditional loans the IMF provides concessional loans for low- income countries. Concessional lending services aimed at the long-term were at first
1 In cases, a surcharge can be levied above a certain threshold. This is to discourage countries from borrowing large amounts (IMF, 2006).
provided by the Structural Adjustment Facility (ESAF), which was replaced in 1999 by the Poverty Reduction and Growth Facility (PRGF). Broad public participation and country ownership are central to the PRGF and are aimed at structurally adjusting the economy by reducing poverty, ensuring macroeconomic stability and adjusting fiscal targets to redirect spending more to the poor. Interest rates are 0.5% and repayments are scheduled after 5-10 years after a 5-year grace period.
The model
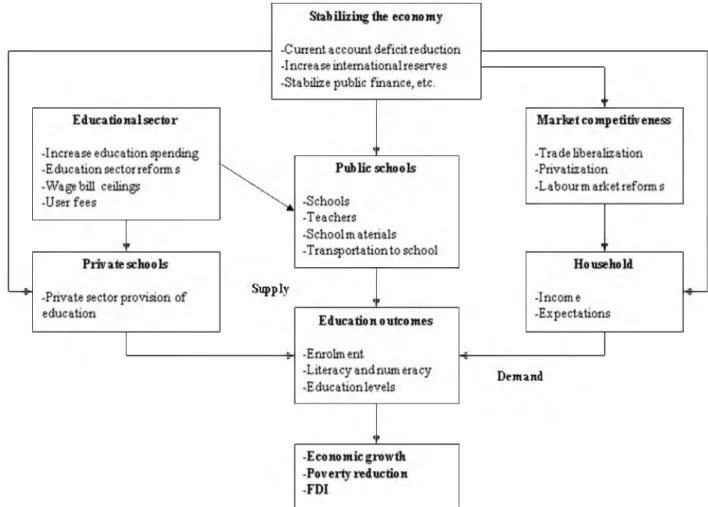
Figure 1 summarizes the theoretical framework of this study. W e investigate the
influence of IMF programs on the growth in educational enrollment of boys and girls. As the figure illustrates, a better education is supposed to lead to economic growth and help the poor to improve their life. Children’s educational participation is determined by the supply of education - both private and public - and the demand for education. The supply of public education is determined by governmental policies with regard to the provision of schools, teachers, and user fees. This provision depends upon the financial resources available. The demand for schooling is influenced by characteristics of the child’s household and of the labor market. The labor market forms an alternative for schooling and thus can be regarded as an opportunity cost for school enrollment. In many
developing countries children - in particular boys - end up in the same occupation as their parents (father). In these situations work is regarded as ‘learning by doing’ and less value is attached to formal education, in particular secondary schooling.
Figure 1 about here
In order to study the effects of IMF programs on school enrollment of children, we categorize the explanatory factors of school enrollment into three groups: measures aimed at stabilizing the economy (top part of Figure 1), measures to enhance competition and the working of markets and measures which are directly aimed at the educational sector. Because of the critique on the IMF and lack of conclusive empirical evidence in favor of positive IMF effects, we expect IMF programs to have a negative effect on the
growth in school enrollment for girls and boys in both age groups, with more negative effects for girls. We also expect short-term programs -m ore aimed at stabilizing the economy-, to be less negative than long-term IMF programs, which also include measures to increase market competitiveness and measures aimed directly at the educational sector.
Stabilizing the economy
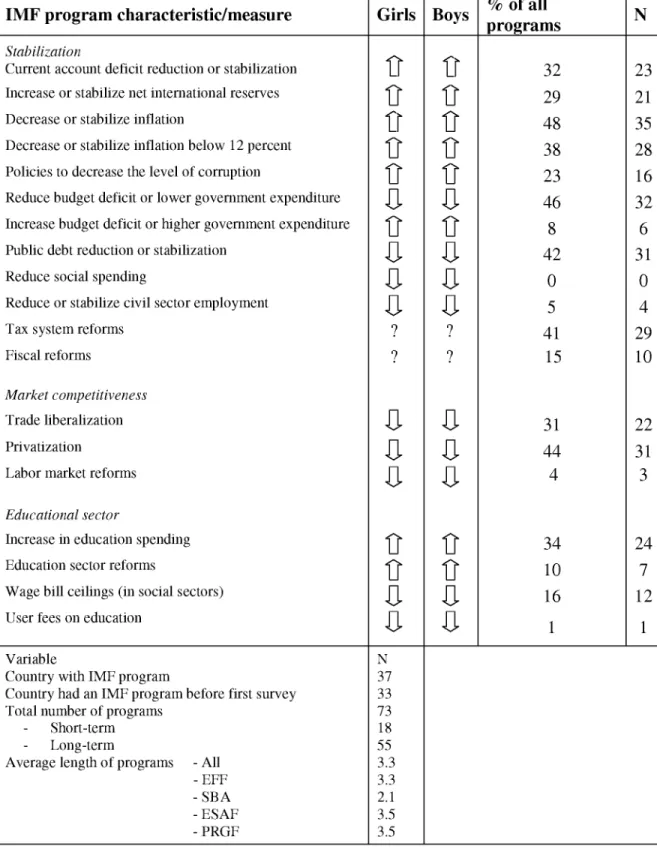
The first group consists of measures aimed at a reduction or stabilization of the current account deficit, increase or stabilization of net international monetary reserves, reduction or stabilization of inflation, a reduction in corruption and finally measures aimed at a reorganization and stabilization of public finance - such as reduction in budget deficits, government expenditures, public debt, public and social spending, and reorganizing the tax system. Many of these proposals reduce the amount of money available for public and social expenditures and thus for expenses for education (see also Konadu-Agemang, (2000) and Vavrus (2005)). We expect these measures to negatively influence the children’s enrollment rates in school (see Table 1). A reform of the tax system is often aimed at a more efficient collection of taxes. It will decrease spending on education as far as these tax reforms reduce disposable income for the children’s parents. It will increase educational expenses as the higher tax revenues are being spend on education. On the other hand the increase in taxes reduce income and thus parents’ ability for paying educational expenses. Hence the net effect is ambiguous (Table 1).
The measures aimed at stabilizing the socio-economic environment and
increasing transparency, such as fighting corruption, and reducing inflation are expected to positively affect the children’s chance to go to school. From previous research it is known that in developing countries, corruption often takes the form of buying votes during election periods and appointing relatives and political favorites at several positions in the civil service. Hence the size of government consumption (which includes salaries) is then correlated with corruption. This implies that reducing civil sector employment could act as a form of fighting corruption. In that case, we expect a positive effect in children’s school enrollment.
High inflation is a proxy for uncertainty and unstable government policies (see in De Jong 2002 for references). Moreover it tends to lower the share of the bottom quintile and decreases the minimum wage, while increasing poverty (Easterly & Fischer, 2001). These detrimental effects are found if inflation is higher than a threshold. Khan &
Senhadji (2001) find a threshold is 11-12% for developing countries. Therefore, lowering or stabilizing inflation rates below 12 percent are expected to have a positive effect on the growth in school enrollment.
Table 1 about here
Increase market competitiveness
The second group consists of measures intended to enhance competition and the working of markets. Examples are: trade liberalization, privatization and labor market reforms. It is believed that in the long run these measures will enhance the country’s competitiveness and thus will be favorable for income per capita and thus for school enrollment. During the transition period, however, the negative effects on income and employment often dominate. SAPRIN (2002), for example, finds that privatization has increased
unemployment and job insecurity. W e hypothesize that the countries concerned are still in this transition period and therefore expect a negative effect of these measures on school enrollment. It should be noted that these measures are relevant in cases where official markets operate. In many regions in developing countries the majority of
economic activities is of an informal nature, such as activities in the family business and on the family farm. Then no relation between these measures and educational
participation are expected.
Educational sector
The third group concerns measures directly aimed at the educational sector. They include increases in education spending, education sector reforms - decentralization and
replacing non-qualified teachers by qualified ones - , wage bill ceilings or reductions and user fees for education. The first two measures are expected to enhance educational
participation as they increase the amount of money available for education or make the system more efficient and bring its quality to a higher level. Moreover, quite often these reforms also contain food programs (such as a free lunch at school) and better
transportation systems, which reinforce the expected positive effects. Wage bill ceilings make it more difficult to hire new teachers or to increase teachers’ salaries, affecting both the quantity and quality o f education (Actionaid, 2007). Since fewer resources are
available for teaching we expect a negative influence on school enrollment. User fees make it more expensive for parents to send their children to school and thus are supposed to reduce school enrollment. The expected signs of all these measures are summarized in Table 1.
Other factors
Other factors which have proven to influence school enrollment at the district level are the level of development and the level of urbanization. Higher levels of development (such as better infrastructure, more job opportunities and better health care) increase the quality of living in a district, which in turn affects school enrollment positively (Filmer & Pritchett, 2001). This higher level of development is more likely to be found in urban districts, which often have better road and transport infrastructure, stronger state influence and better educational opportunities (Buchmann & Brakewood, 2000;
Fafchamps & Wahba, 2006). Previous research shows that growth in school enrollment at the district level is also expected to depend the average household size, the average number of children under 5 per household, and the average educational level of adults at the district level. (Buchmann & Hannum, 2001, Emerson & Portela Souza, 2008, Pong,
1997).
Control factors at the national level are Gross Domestic Product (GDP) and GDP per capita, inflation, public spending on education, the level of education, the level of corruption, the level of public debt and military spending. Higher levels of GDP and GDP per capita imply that people can spend more and thus are better able to send their children to school. However, as in ordinary growth studies initial GDP values are expected to negatively affect the growth in school enrollment rate due to the so-called ‘convergence’ hypothesis. Increases in public spending on education as a percentage of GDP will lead to
increases in gross enrollment rates, economic growth, lower poverty headcount and a reduction in child mortality rates (Baldacci, Clements, Gupta, and Cui, 2004; Baldacci, Guin-Siu and De Mello, 2003). Other aspects which might affect school enrollment could be the level of corruption, debt, and military expenditure as a share of GDP. These
aspects are expected to have a negative influence on the growth in school enrollment (Schleifer & Vishny, 1993; Ehrlich and Lui, 1999; Johnson, Kaufmann, and Zoido- Lobatón, 1999; Baldacci et. al, 2004; Pattillo, Poirson, and Ricci, 2003; Deger, 1985).
3. Method
Dependent variableThe change in school enrollment forms the dependent variable o f this study. Data on school enrollment are obtained from various household surveys. These surveys provide information on the households, such as the number of children in the household, and on its individual members. In this study we use data on the child’s age and sex and whether he or she is still in school. In order to study the effects of an IMF program we need data for different moments in time. W e therefore restrict our analysis to countries in which household surveys are held more than once. The sampling of each consecutive survey is independent from that of the first. Consequently, we cannot claim that the data are longitudinal at the household level.
However at the district level they are longitudinal. Hence, we study the change in the percentage of children going to school at the district level. The district level data are obtained by aggregating the household level data. The percentage of children in the survey who are going to school is available for the first wave, the second wave and in a few countries even for the third wave. The change in schooling, is calculated as the percentage change in the percentage of children in the district going to school between wave 1 and wave 2, that is 100* (S1 - S2)/S1, where S1 (S2) is the percentage of children in the district going to school in wave 1 (2) respectively. After checking the data for
2 The surveys used are the Dem ographic and H ealth Surveys (DHS, www .m easuredhs.com ), International Labor O rganization (ILO, w ww .ilo.org), Integrated Public Use M icrodata Series (IPUM S, w ww .ipum s.org), M ultiple Indicator Cluster Surveys (M ICS, w w w .childinfo.org), and the Pan Arab Population and Fam ily H ealth Project (PAPFAM , w ww .childinfo.org).
outliers and special cases, Bolivia, Cote d ’Ivoire and Guinea-Bissau are removed from the dataset. Data for Bolivia proved to be unreliable and both Cote d ’Ivoire and Guinea Bissau experienced coups at the time of the surveys which resulted in civil war and large social unrest. Data is used for 44 countries containing 431 districts in the period between 1997-2007.
The explanatory variables are from two levels of aggregation: district-level and national-level. We therefore use multi-level regression models so that explanatory variables at both levels can be included simultaneously and we can study interactions between the two levels (Hox, 2002; Snijders & Bosker, 1999). Analyses are performed separately for boys and girls in two age groups (children aged 9-11 and 12-14), because it is likely that outcomes differ by sex and age. The dichotomy of age groups is chosen because there might be different effects for children who are in primary school (9-11) and children who are in secondary school (12-14) (Huisman & Smits, 2009).
IMF variables
We have collected information of all IMF programs in which countries participated for which we have data on schooling at the district level. This resulted in 73 programs. For all types of programs, the program details are written down in the ‘letters of intent’ from the Managing Director of the IMF, and can be adapted if needed (IMF, 2006). We have read these letters of intent for all 73 programs included in this research, and categorized the measures suggested. In order to estimate the impact of an IMF program we have created the following variables. First, a dummy which indicates whether (1) or not (0) during the survey interval - the years between the two waves - the country has at least one IMF program. The coefficient of this dummy is regarded as the indicator of the
program’s effect. The program ’s influence is expected to depend upon the fraction of the survey interval the program is implemented. W e therefore created a second variable which is the percentage o f the survey interval during which one or more programs were in place.4 It is well-known (Baldacci et. al, 2004 and Martin & Segura-Obiergo, 2004) that a program can have persistent effects, so that previous programs can still influence
4 For example: a country w ith surveys in 2000 and 2005 w hich has a program from 2001 until 2005 has a program 80% o f the time.
school enrollment rates during the survey interval. In order to take this into account we created a dummy variable measuring whether (1) or not (0) a country had an IMF program which ended five years at most before the first survey was held5.
The effects of short-term programs might differ from long-term programs. We therefore constructed a dummy variable indicating whether (1) or not (0) a country has a short-term program and another one for whether (1) or not (0) a country has a long-term program during the surveys. Four different categories are made to make a distinction between IMF programs: program vs. no program, short-term vs. long-term, program type (SBA, EFF, ESAF and PRGF) and a set of specific characteristics which are found in all programs. Four different IMF programs are found during the sample period of 1997 2007. However, it became clear that it is very difficult to estimate the effects of these programs separately. In the majority of cases (24 out of 36), countries had several different programs during the survey interval. Typically, a short-term (long-term) program is followed by another short-term (long-term) program. The only exception is Yemen, where a short-term program (EFF) was followed by a long-term program
(ESAF). This means it is impossible to estimate the effects of all different program types separately, so we refrained from such an analysis. Except for reductions in social
spending and user fees, which are almost absent6, dummy variables are created for all program characteristics presented in Table 1.
The size of an IMF program might also matter. Therefore, several variables are created yielding the total amount of SDRs (Special Drawing Rights) approved and total amount of SDRs approved per capita. The relative size of Fund programs in calculated by covernting the total amount of SDRs into dollars by multiplying it with the exchange rate at the date of the start of the program and divided by GDP.
On average the number of years between two consecutive waves is 5.4 years. This enables us to study the effect of IMF programs after 3 to 9 years7. This a reasonable time frame if we take the results of previous studies into account. Martin &
Segura-5 Baldacci et. al (2004) find that two-thirds o f the direct effects o f education spending are found in the first five years, the rem aining one third in the next five years. M artin & Segura-Obiergo (2004) show that education spending as a result o f the im plem entation o f an IM F program start to increase in the first year, increase further in the second year, w ith residual effects in the rem aining years.
6 Reductions in social spending were not found at all and user fees were only encountered in 1 case (Turkey). 7 The m inim um num ber o f years is 3, the m axim um is 9 years.
Obiergo (2004), for example, show that the effect of an IMF program are largest in the first two years of the program, while there is still a residual effect in the third year, which declines geometrically with 40% a year. Baldacci et. al (2004) find that two-thirds of the direct effects of educational spending are found in the first five years, and the remaining one-third to be realized in the next five years.
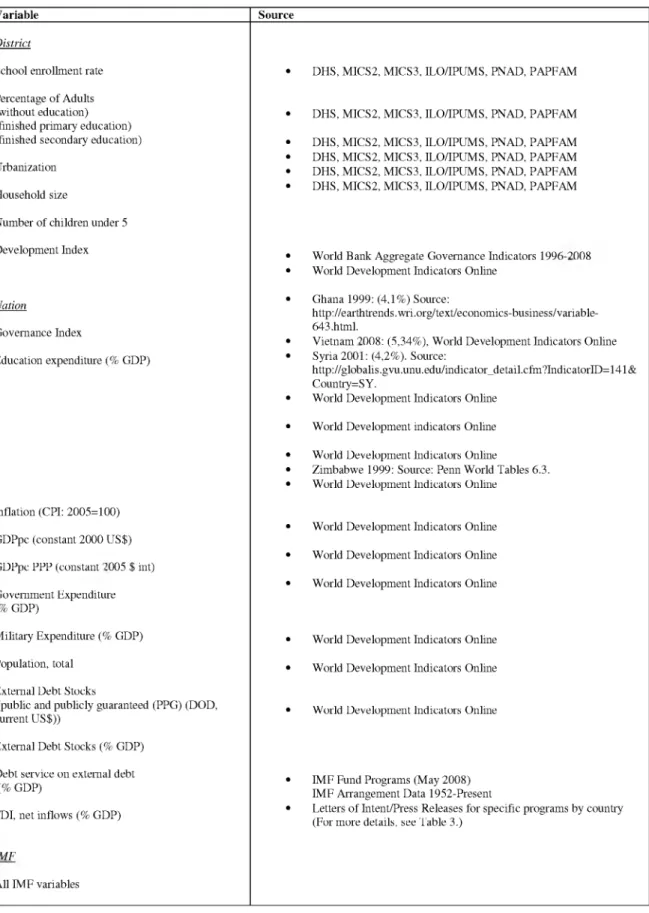
Control variables
The level of development at the district level is measured by constructing a wealth index. This index is the mean of the percentage o f households in the district that own a tv, car, flush toilet, fridge and have access to electricity and running (tap) water. The level of urbanization at the district level is measured as the percentage of people living in an urban area, ranging from 0 to 100. Next to the average household size and the average number of children under the age of 5 in the district, educational attainment for men and women at the district-level was measured by calculating the percentage of women and men aged 30-49 without any education.
Control factors at the nation level are Gross Domestic Product (GDP) and GDP per capita (in constant $US 2000), inflation (measured as the change in price index), public spending on education as a percentage of GDP, the level of corruption, the level of public debt, military spending as a percentage of GDP and foreign direct investment as net inflows as a percentage o f GDP. Corruption is measured by the control for corruption variable constructed as the average o f six governance indicators 1996-2008 from the W orld Bank (www.govindicators.org), which contain information on six indicators . Higher values correspond to better governance and thus less corruption.
The level of debt is calculated by dividing the external debt stocks, public and publicly guaranteed (current US$) by GDP (in constant 2000 $US and current $US) and debt service on external debt, public and publicly guaranteed (current US$).
8 These governance indicators include measures in the areas o f voice and accountability, political stability and absence of violence/terrorism , governm ent effectiveness, regulatory quality, rule o f law, and control o f corruption.
4. Results
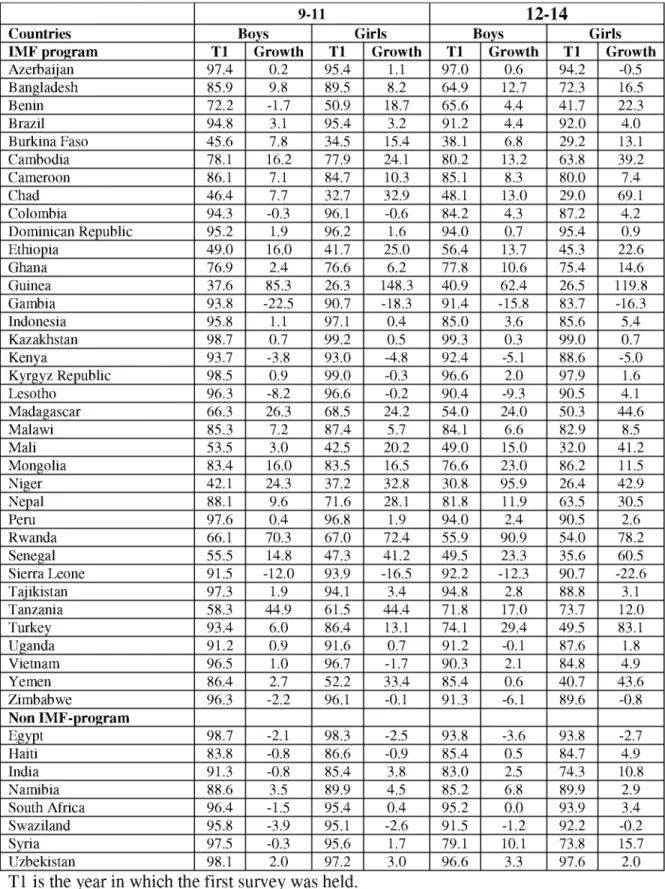
Table 2 shows that there are large differences in school enrollment between countries for boys and girls in both age groups. Striking is that countries with low initial school enrollment rates exhibit larger growth rates than countries with high initial rates,
supporting the so-called ‘convergence’ or ‘catching u p ’ hypothesis. This means countries with relatively low starting positions exhibit higher growth in school enrollment rates than countries with relatively high starting positions, so it is easier to ‘catch u p ’. There are also large differences between specific regions. Especially African countries show low initial school enrollment rates compared to Latin-American and Caribbean countries, but the growth in school enrollment is higher in these countries. Girls show larger
increases in enrollment than boys, which can also be explained by the convergence hypothesis. Countries with IMF-programs seem to show larger increases in the growth in school enrollment than countries w ithout programs, which could imply positive IMF- effects. This seems to hold for both boys and girls.
Insert table 2 about here
At first sight, one would expect systematic differences in conditions between short-term programs (SBA and EFF) and long-term programs (ESAF and PRGF). However, the SBA’s letters of intent also contain far reaching structural policy measures. For several policy measures, Table 1 provides the number of programs (last column) and the percentage of programs (semi last column) containing each of the policy measures
distinguished. The table illustrates that the letters of intent contain various types of policy measures ranging from measures aimed at stabilizing the economy and public finance to specific measures targeted at the educational sector. Many measures are found regularly (such as reductions in the budget deficit/ lower government expenditure), others are less frequently included in the list of conditions. Striking is that reductions in social spending are not found at all, user fees on education are only found in one case, namely Turkey,
and wage bill ceilings or reductions are found in 20% of the programs. Surprisingly, in 55% of the programs educational spending was increased or protected from cuts. This might explain countries’ policies to allocate more spending towards priority sectors9. In some cases (10%), both the government and the IMF agreed to increase the budget deficit and raise government expenditure and in 14% education sector reforms were introduced. The majority o f the programs are ‘extended’ or long-term programs. Data on IMF
programs was kindly provided by the IMF. Data, sources and detailed descriptions on the IMF program characteristics can be found in the Appendix in Table III and IV.
Descriptive statistics with respect to IMF variables are presented in Table 1. Using this dataset ranging from 1997-2007, there are 37 countries with IMF programs, and 7 countries without a program, which results in 348 districts with Fund programs and 83 districts without programs (bottom part of Table 2). Out of the 73 programs, 18 of them are short-term and 54 long-term programs. The average length of programs is 3,3 years. In 25 out of 36 countries with a program at the time of the first survey, a new program was started before the second survey was held. On average it took 1,9 years between the end of a program and the start o f a new program. Hence, most countries are prolonged users of Fund-supported programs.
Insert table 3 about here
Bivariate analyses
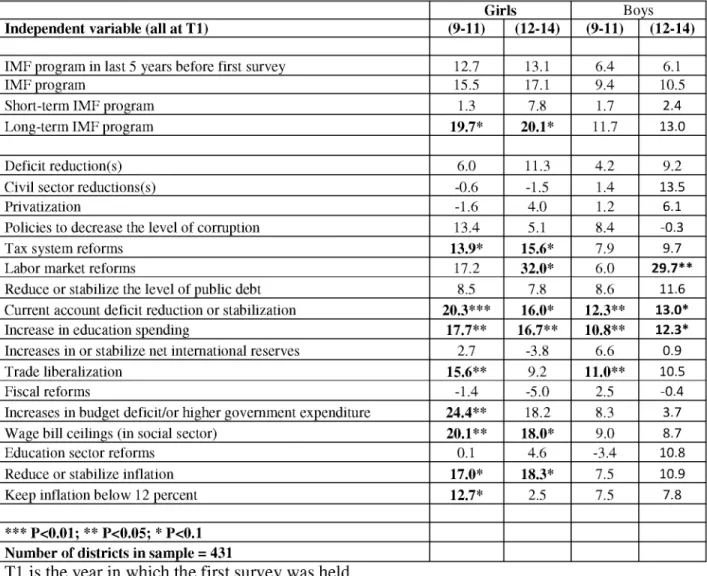
A first impression is obtained by the bivariate coefficients resulting from multilevel regressions, each of which explains school enrollment by one characteristic of an IMF program and an intercept. All IMF programs show positive signs, although only the coefficients of long-term IMF programs on girls’ enrollment are significant (Table 3). Significant positive effects are found for the following conditions in the letters of intent: current account deficit reductions, increases in education spending, higher government expenditure, reduction in inflation, labor market reforms, trade liberalization and wage
9 It is found that governm ents want to reallocate spending from non-social sectors towards social sectors such as education. It is therefore often found that programs are going to low er overall governm ent expenditure but in the m eantim e increase social spending.
bill ceilings. The sign of the last three conditions are opposite to the ones expected. Moreover, it seems that the significant effects are larger for girls than for boys.
Multivariate analyses
The bivariate analyses provide a first impression, but do not take into account the possible effects of other variables, such as the initial level of schooling, the level of urbanization and development, household size, etc. To gain more insight into the underlying causes of the growth in schooling, these factors are controlled for in the multivariate analyses. W e started the regressions with as many explanatory variables as possible and consecutively dropped the most insignificant one. This process stopped when all explanatory variables had significant effects. Subsequently, we augmented the regression with one of the following variables: the governance indicator, educational spending as a percentage of GDP, the change in consumer price index, and military spending as a percentage of GDP. Except for the change in consumer price index, in each regression the corresponding coefficient appeared to be insignificant. These variables are therefore not included in the final regressions. We made an exception to GDP, although its coefficient is often insignificant, it is included in the regressions. As a robustness check, we also started the process the other way around by running regressions with as little explanatory variables. Adding one variable at a time did not change our results in any way.
(a) The effects o f IM F programs in general
Many o f the economic factors at the national-level proved to be insignificant, such as spending on education as a percentage o f GDP, the governance index, the level of debt as a percentage of GDP and military expenditure as a share of GDP. In addition an IMF program which ended 5 years or less before the first survey was held proved not to have any significant effect. These variables are not included in further regressions.
The first analysis examines the effects of IMF programs in general and uses two models. The first contains the level of urbanization at the district level and an interaction term of this variable with the IMF program. The second model contains the development index at the district level with an interaction term with the IMF program instead of the
level of urbanization. IMF programs tend to have negative effects for boys and girls in both age groups (Table 4, first row). The coefficients are, however, insignificant. As expected, the level of school enrollment at the time of the first survey has a negative influence on the growth in the subsequent period. This confirms the convergence hypothesis.
Insert Table 4 about here
An explanation for the insignificant effects of Fund supported programs might be that these programs include many different characteristics and measures which can have both negative and positive effects on school enrollment, so that the different effects are
cancelled out. This might especially be true for long-term programs (ESAF and PRGF) which last longer and can have more characteristics that have a large impact on
developing countries’ economies. On average short-term programs have almost 6
characteristics per program, whereas long-term programs include almost 9 characteristics per program.
b) Short-term versus long-term IM F programs
To obtain more conclusive results, we study short-term and long-term IMF programs separately. Similar analyses as for all IMF programs are performed here as well and are presented in Table 5 and 6. Significant coefficients are expressed in bold, with asterisks representing the degree o f significance. Complete models are shown in the tables.
Table 5 and 6 about here
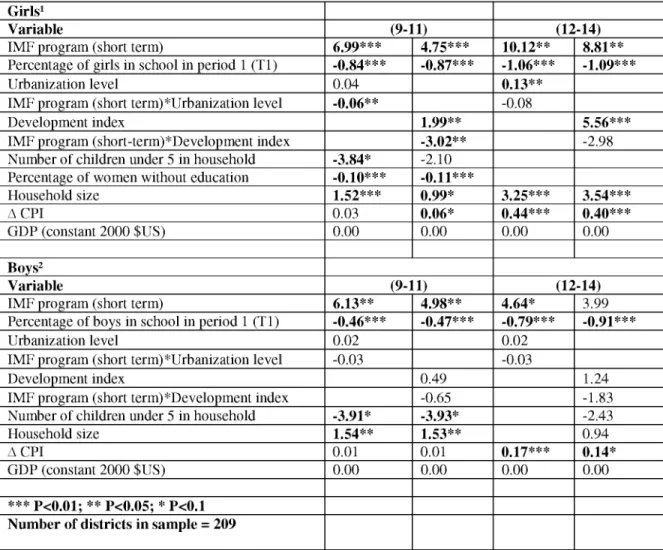
Table 5 shows that short-term IMF programs have a positive effect on the growth in enrollment at the district level for girls in both age groups and boys aged 9-11.
Coefficients of the IMF stabilization program are highly significant and are 7.00 for girls and 6.13 for boys when the urbanization level interaction is included and 4.75 for girls and 4.98 for boys when the development index interaction is included. W ith the urbanization level interaction, this means districts with short-term IMF-program(s) between survey 1 and 2 show a positive growth in school enrollment for girls which is on average 7.00 percentage points higher than districts without short-term programs. When the development index interaction is included in the model, the growth in
enrollment is 4.75 percentage points higher. For boys aged 9-11, these numbers are 6.13 percentage points higher with the urbanization interaction, and 4.98 percentage points higher with the development index interaction
Another important finding is that the urbanization level interaction term turns negative and significant for girls in both age groups, with a coefficient of -0.06 for girls aged 9-11. Hence, the effects of short-term programs are 0.06 percentage points less positive in more urban areas. Since the level of urbanization is measured as a percentage ranging from 0 to 100, this implies the effects of short-term programs are 6 percentage points less positive in the most urban areas. W hen including the development index interaction, the coefficient is again negative and significant for girls aged 9-11, but larger with a value of -3.02, which confirms that the positive effects are clearly less positive in urban areas. Therefore, more rural areas benefit most from the positive effects of short term IMF programs. For boys aged 9-11, the interactions are insignificant.
Among the other explanatory variables, the initial level of school enrollment. clearly has a negative (significant) effect on the difference in school enrollment as expected. Districts with low initial school enrollment rates show higher growth in schooling, supporting the convergence hypothesis. The level of urbanization and development index show expected signs and are highly significant. The number of children under 5 in the household and the percentage of women without education prove to be negative and significant as expected. The household size has a positive significant effect on the growth in enrollment, which is not expected. The coefficient of national GDP is significant, but has virtually no effect at all on the growth in schooling. The change in price index is positive and significant for girls 9-11 only when the development index is included.
The effects of short-term IMF-programs for girls and boys aged 12-14 are shown in the right hand side of Table 5. When including both the urbanization level and
development index interaction terms in the models, the effects of short-term programs are positive and significant for girls, but insignificant for boys. Also both interaction effects are insignificant. It has to be noted that the IMF program coefficient for girls 12-14 is only significant when including the household size and the change in price index. When either the number o f children under 5 or the percentage of women without education is added to the regression separately, the IMF program coefficient turns insignificant. Other explanatory variables behave according to expectation, with negative significant
coefficients for the number of children under 5; household size is also significant but has a positive effect. Again, GDP is strangely enough of no relevance next to education expenditure as a share of GDP, and the change in price index has a positive significant effect, which is not according to our expectations..
To summarize: short-term IMF programs have positive significant effects on the growth in school enrollment for both girls and boys aged 9-11. Effects are more positive in rural areas and in districts with lower levels of development. These effects are even more positive for girls. For girls and boys aged 12-14, the effects of short-term programs are again positive and significant, but with some conditions. The interactions with the level of urbanization and the level of development prove to be insignificant.
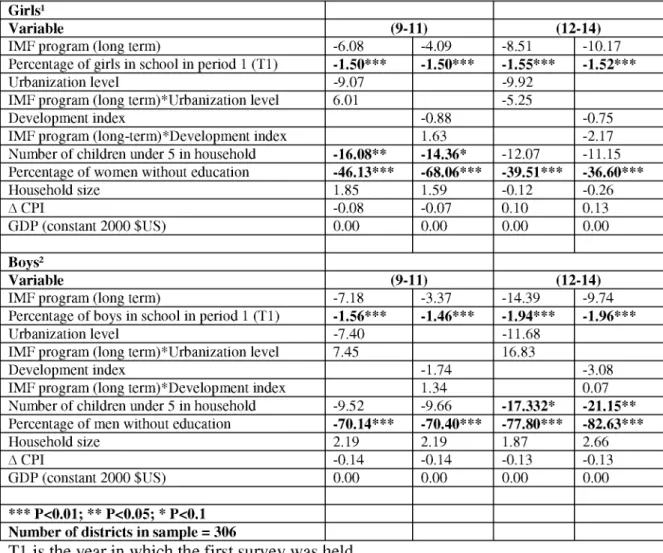
W hat are the effects of long-term programs? Table 6 shows that long-term IMF programs are negative for children in all age groups. However, all coefficients for the IMF structural program (long-term) are insignificant. Interactions with the level of urbanization and development also proved to be insignificant for girls and boys in both age groups.
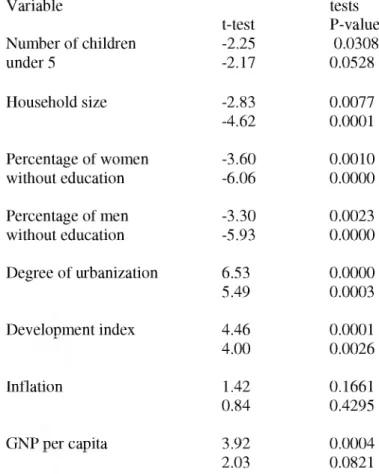
The differences in effects between short-term and long-term programs are
remarkable. As we noted before generally countries do not switch between the two types of programs. Hence, the differences in results could be attributed to differences in country characteristics. We therefore investigate in which sense the characteristics of countries with short term programs differ significantly from those with long-term programs. It appears that in countries with short-term programs, the household size and the percentage of men and women without education are significantly lower and the degree of urbanization and the development are significantly higher than in countries with long-term programs (see Table 7). The number of children under five, the national inflation rate and GNP per capita differ less between these two groups of countries.
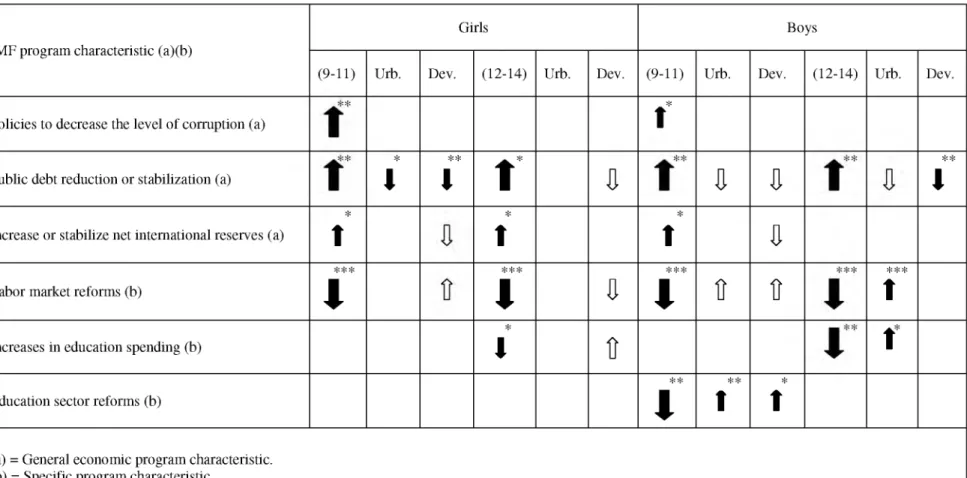
(c) Effects o f IM F program characteristics
Besides of the question whether a program has a positive or negative effect, it is also interesting to know, which measures deliver any effect. That is why we study the effect of various specific conditions included in each program. All measures which proved to be significant are shown in Table 7. Again, analyses are performed for girls and boys with different models and with both the urbanization level and development index interaction terms.10
Table 8 about here
It appears that policies aimed at decreasing the level of corruption have significant positive effects on the growth in enrollment for children in the age group 9-11, with more positive effects for girls. These positive effects for both girls and boys are slightly less positive in more urban areas, therefore children in more rural areas benefit most from this measure. An explanation might be that policies to decrease corruption make sure more
10 Education sector reforms for girls 9-11 are only significant in M odel 1. Increases in or stabilise net international reserves is only significant for girls 12-14 in M odel 1. Both increases in or stabilise net international reserves and wage bill ceilings are only significant in model 1 for boys 12-14.
money from the original amount can be spend on education, without money being lost to all kinds of corrupt government officials or organizations.
Public debt reduction or stabilization proves to have a very strong significant positive effect on the growth in school enrollment for both girls and boys in both age groups. This positive effect is slightly less positive in more urban and more developed areas for girls 9-11. For boys aged 12-14, the positive effect is slightly less positive in more developed districts. Although lowering or at least stabilizing a country’s public debt might bring about some costs in the short-run (for example through cuts in public
spending), in the long-run this will definitely be beneficial for the possibilities of sending children to school at the district level.
Increases in or stabilization of net international reserves has a significant positive effect for girls in both age groups and boys aged 9-11. Interaction effects are negative but remain insignificant.
Labor market reforms have very strong negative effects on the growth in school enrollment for both girls and boys in both age groups. For girls aged 9-11, this effect is significantly stronger in more urban areas, but not in more developed districts. For boys aged 12-14, the strong significantly negative effect of labor market reforms are more negative in more urban areas.
Increases in education spending have negative significant effects for girls and boys aged 12-14. For boys, this negative effect is even more negative in more urban areas. This finding is remarkable because many papers find a positive relation between the level of education spending (both in absolute terms and as a share of GDP), such as Baldacci, Clements, Gupta, and Cui (2004).
Another striking finding is that education sector reforms prove to have significant negative effects on the growth in school enrollment for boys in the primary school age group, with stronger effects in more urban and developed districts. An explanation might be that the letters of intent often state that education sectors will be decentralized further to provide local authorities together with other organizations the power to implement different measures.
5. Conclusions
Many NGOs and academics criticize the IMF for many reasons. Much has been written on the effects of IMF programs on key macroeconomic variables, but not on the effects of these programs on education. As far as the authors of this paper know, only a few case studies have been performed, but there has not yet been large scale cross-section research studying the effects of IMF programs on educational participation.
In this paper, the effects of IMF programs on the growth in schooling are estimated using the growth in school enrollment at the district level as the dependent variable. Using a sample of 44 countries, containing 431 districts in total between 1997 2007, the effects of IMF programs are estimated using three distinctions concerning IMF programs. First, the effects of IMF programs in general are estimated, followed by a subdivision of short and long-term programs. The final distinction- and perhaps the most important one when it comes to policy recommendations- is to estimate the effects of specific program characteristics,
Bivariate analyses showed IMF programs have a positive effect on the growth in school enrollment for both boys and girls in both age groups, but these effects are insignificant. Using multi-level regression analyses including different variables at both the district level and at the nation-level, it is found that IMF programs in general have both negative and positive effects depending on the sex of the child, the age group and the model used, but these effects are all insignificant.
Significant effects are found, however, if we distinguish between short-term programs and long-term programs. Results indicate that short-term IMF programs have significant positive effects on the growth in school enrollment for girls and boys aged 9
11, with more positive effects for girls aged 9-11 in more rural areas and in less developed districts. For children aged 12-14, effects of short-term IMF programs are positive and significant, but only when including a specific combination of explanatory variables. Long-term IMF programs are positive for children aged 9-11, but negative for children aged 12-14. However, all coefficients for the IMF structural program (long term) are insignificant.
Finally, the effects of different program characteristics are estimated. All general (macro) economic conditions prove to have positive effects on the growth in enrollment.
Policies to decrease the level of corruption have a positive effect for girls and boys in the primary school age group. These effects are even more beneficial for children in more rural districts. Reductions in public debt have strong significant positive effects for girls and boys in both age groups, which are less positive in more urban and developed areas for girls aged 9-11. For boys aged 9-11, the effect is only significantly less positive in more developed districts. Increases in net international reserves prove to have significant effects on the growth in schooling for girls in both age groups and for boys aged 9-11, but there are no significant interaction effects.
The more specific program characteristics show less positive results. Labor market reforms have strong negative effects on the growth in school enrollment for girls and boys in both age groups. This effect is even stronger in more urban districts for girls 9-11. This also holds for boys aged 12-14, where the effect is also more negative in districts with a higher level of development. Increases in education spending are found to have negative effects for girls an boys aged 12-14 and education sector reforms have negative effects for boys 9-11, possibly due to decentralization, changing wage structures and replacing teachers with more qualified teachers.
(a) Discussion and policy recommendations
W hat policy recommendations can be deduced from this study? Our findings that short term programs have a positive effect on the growth in schooling for children aged 9-11, indicate that having an IMF program can be a good thing. These effects are even more positive in more rural districts. Still, programs include different measures or
characteristics that can have both positive and negative effects. It is therefore especially important to see which effect every program characteristic has on the growth in
schooling.
It is found that the more general economic program characteristics have a positive effect on the growth in schooling. Results indicate that decreasing the level of corruption has a positive impact for children in the primary age group, especially for those living in more rural areas. This is in line with the results found by Schleifer & Vishny (1993). Anti-corruption policies should be implemented throughout the whole country and have even larger positive effects in more rural areas, also when taking decentralization of the
education system into consideration. Besides adopting clear laws and regulations and well-designed institutions in the fight against corruption, people do still actively have to demand accountability from their governments and institutions (Transparency
International, 2004).
Agreements to reduce a country’s public debt are beneficial for all children in both age groups. Paying off debt might be a bit painful in the short-run because valuable resources cannot be spend elsewhere, e.g. in the education sector. However, when total debt levels and interest payments fall, more money can be spend in the education sector, leading the growth in enrollment to increase. Agreements to reduce public debt should therefore be complied and encouraged without putting too much pressure on government finances.
Countries agreeing to increase levels of net international reserves are also found to have a higher growth in school enrollment. By increasing the reserves, imports are limited and exports are promoted. Although increasing net international reserves has a purely economic reason, it promotes exports; people working in the export sector can see an increase in their income, therefore parents are more able to pay for their children’s education resulting in higher enrollment.
The more specific program characteristics are found to be less positive.
Agreements to reform the labor market have negative effects for girls and boys in both age groups with larger negative effects in more urban and more developed districts. Because of these reforms, workers can be laid off more easily or can get paid less when the labor market is made more flexible. Designing and implementing better social protection and providing people with opportunities to educate and train themselves should perhaps be accompanied by labor market reforms, thereby mitigating the effect of workers losing (a part of) their income (Pagés, 2004).
Finally, policies to increase spending on education and to reform the education sector might be revised. Decentralization, changing wage structures, replacing teachers with more qualified teachers and future job opportunities can influence both the quantity and quality of schooling negatively. Parents can then decide it has little use to send their children to school resulting in a decrease in the growth in school enrollment.
References
• Actionaid. (2007). Confronting the Contradictions: The IMF, wage bill caps and the case for teachers. April, 2007.
• Atoyan, R. & Conway, P. (2006). Evaluating the im pact of IM F programs: a comparison of matching and instrumental-variable estimators. Review o f International Organizations, Volume 1, N um ber 2, 99-124.
• Baldacci, E., Guin-Siu, M. T. & De Mello, L. (2003). More on the effectiveness o f public spending on health care and education: a covariance structure model. Journal o f International
Development, Volume 15, Issue 6, 709-725, August 2003.
• Baldacci, E., Clements, B., Gupta, S. & Cui, Q. (2004). Social Spending, Human Capital, and
Growth in Developing Countries: Implications for Achieving the MDGs. IM F Working Paper,
WP/04/217.
• Bird, G. (1996). The International M onetary Fund and Developing Countries: A Review o f the Evidence and Policy Options. International Organization, Vol. 50, No.3 (Summer, 1996), pp. 477
511.
• Bordo, M. D. & James, H. (2000). The International M onetary Fund: its present role in historical
perspective. NBER Working Paper No. 7724.
• Bretton W oods Project. (2007). Bank and Fund undermining health, education spending. 2 July
2007. Link:(http://brettonwoodsproject.org/art.shtml?x=554200).
• Buchmann, C. & Brakewood, D. (2000). Labor structure and school enrollments in developing societies: Thailand and Kenya compared. Comparative Education Review, 44(2), 175-204.
• Buchmann, C. & Hannum, E. (2001). Education and Stratification in Developing Countries: A
Review o f Theories and Research. Annual Review o f Sociology. 2001. 27:77-102.
• Butkiewicz, J. & Yanikkaya, H. (2005). The effects of IM F and W orld Bank Lending on Long-
Run Economic Growth: An Empirical Analysis. World Development, Vol. 33, No. 3, pp. 371-391.
• Chossudovsky, M. (1997). The Globalisation o f Poverty: Impacts o f IM F and W orld Bank
Reforms. Zed Books Ltd. & Third World Network.
• Deger, S. (1985). Human Resources, Government Education Expenditure, and the M ilitary Burden
in Less D eveloped Countries. The Journal o f Developing Areas, 20, (October 1985), pp. 37-48.
• Dicks-Mireaux, L., Mecagni, M. & Schadler, S. (2000). Evaluating the effect o f IM F lending to
low-income countries. Journal o f Development Economics, Volume 61, Issue 2, April 2000, pages
495-526.
• Dollar, D. & Kraay, A. (2002). Growth is Good for the Poor. Journal o f Economic Growth,
• Dreher, A. (2006). IM F and economic growth: The effects o f programs, loans, and compliance with conditionality. World Development, Volume 34, Issue 5, M ay 2006, p p 769-788.
• Easterly, W. & Fischer, S. (2001). Inflation and the Poor. Journal o f Money, Credit and Banking,
Vol. 33, No.2, Part 1, pp. 160-178.
• Easterly, W. (2005). W hat did structural adjustment adjust? The association o f policies and growth
with repeated IM F and W orld Bank adjustment loans. Journal o f Development Economics, 76
(2005), 1-22.
• Ehrlich, I. & Lui, F. (1999). Bureaucratic Corruption and Endogenous Growth. Journal o f
Political Economy, 107 (December), S270-93.
• Emerson, P.M. & Portela Souza. (2008). Birth Order, Child Labor, and School Attendance in
Brazil. World Development, Vol. 36, No.9, pp. 1647-1664.
• Fafchamps, M. & W ahba, J. (2006). Child labor, urban proximity, and household composition.
Journal o f Development Economics 79 (2006) 3 7 4 - 397.
• Feldstein, M. (1998). Refocusing the IMF. Foreign Affairs, Vol. 77, No. 2; ABI/INFO RM Global,
pp. 20-33.
• Filmer, D. & Pritchett, L. (2001). Estimating W ealth Effects without Expenditure Data-or Tears: An Application to Educational Enrollments in States o f India. Demography, Vol. 38, No. 1 (Feb.,
2001), pp. 115-132.
• Garuda, G. (2000). The Distributional Effects o f IM F Programs: A Cross-Country Analysis.
World Development Vol. 28, No. 6, pp. 1031-1051.
• Grootaert, C. (1994). Education, Poverty, and Structural Change in Africa: Lessons from Côte d ’
Ivoire. International Journal o f Educational Development, Vol. 14, No. 2, pp. 131-142.
• Haque, N. U. & Khan, M. S. (1998). Do IM F supported programs work? A survey o f cross
country empirical evidence. IM F Working Paper No. 169.
• Hox, J. (2002). M ultilevel analysis: Techniques and applications. New York: Erlbaum.
• Huisman, J. & Smits, J. (2009). Effects o f Household- and District-Level Factors on Primary
School Enrollment in 30 Developing Countries. World Development, Volume 37, Issue 1, January
2009, Pages 179-193.
• Ilon, L. (1994). Structural Ajustment and Education: Adapting to a Growing Global Market.
International Journal o f Educational Development, Vol. 14, No. 2, pp. 95-108.
• IMF. (2003). Fiscal Adjustment in IM F-supported programs. Independent Evaluation Office.
• IMF. (2006). W hat is the IMF?, September, 2006.
Link: (http://www. imf.org/external/pubs/ft/exrp/what.htm#do).
• Johnson, S., Kaufmann, D, and Zoido-Lobatón, P. (1999). Corruption, Public Finances, and the
Unofficial Economy. World Bank Policy Research Paper no. 2169, W ashington, DC: World
• Joyce, J. (2002). Through A Glass Darkly: New Questions (And Answers) About IM F Programs.
Wellesley College Working Paper 2002-04, June 2002. Department o f Economics, Wellesley College, Wellesley, Massachusetts.
• Joyce, J. (2004). Adoption, Implementation and Impact o f IM F Programmes: A Review o f the
Issues and Evidence. Comparative Economic Studies, 46, pp. 451-467).
• Khan, M. & Senhadji, S. (2001) Threshold Effects in the Relationship Between Inflation and
Growth. IM F S ta ff Papers, Vol. 48, No.1, p. 1-21.
• Konadu-Agyemang, K. (2000). The Best o f Times and the W orst of Times: Structural Adjustment
Programs and Uneven Development in Africa: The Case O f Ghana. The Professional Geographer,
Volume 52, N um ber 3, August 2000 , pp. 469-483(15).
• Martin, R. & Segura-Obiergo, A. (2004). Social Spending in IM F-Supported Programs.
Independent Evaluation Office, IEO Background Paper, BP/04/1.
• Mody, A & Saravia, D. (2003). Catalyzing Private Capital Flows: Do IM F Programs Work as Commitment Devices? IM F Working Paper, Research Department, WP/02.
• Noorruddin, I. & Simmons, J. (2006). The Politics o f Hard Choices: IM F Programs and Government Spending. International Organization Vol. 60, Fall 2006, pp. 1001-1033.
• Pagés, C. (2004). A Cost-Benefit Approach to Labor M arket Reform. Economic Review, Second
Quarter 2004.
• Patillo, C., Poirson, H. & Ricci, L. (2003). W hat Are the Channels through which External Debt
Affects Growth? (2003 draft).
http://www.brookings.edu/es/commentary/journals/trade/papers/20030516_pattillo.pdf.
• Pong, S-L. (1997). Sibship Size and Educational Attainment in Peninsular Malaysia: Do Policies
Matter? Sociological Perspectives, Vol. 40, No. 2 (1997), pp. 227-242. Published by: University
o f California Press
• SAPRIN. (2002) The Policy Roots O f Economic Crisis and Poverty, A M ulti-Country Participatory Assessment o f Structural Adjustment.
• Schleifer, A. and Vishny, R. (1993). Corruption. Quarterly Journal o f Economics, 108 (August),
pp. 599-617.
• Snijders, T. & Bosker, R. (1999). M ultilevel analysis: An introduction to basic and advanced
m ultilevel modeling.
• Vavrus, F., (2005). Adjusting Inequality: Education and Structural Adjustment Policies in
Figure 1 Effects o f IM F structural adjustment on education and growth.
Table 1 Expected effects o f IM F program characteristics.
IMF program characteristic/measure
Girls
Boys
% of all
programs
N
Stabilization /V
Current account deficit reduction or stabilization
tr
tr
32 23 Increase or stabilize net international reservestr
tr
29 21Decrease or stabilize inflation
tr
tr
48 35Decrease or stabilize inflation below 12 percent
tr
tr
38 28Policies to decrease the level of corruption
tr
tr
23 16Reduce budget deficit or lower government expenditure
d
CL
46 32 Increase budget deficit or higher government expendituretr
tr
8 6Public debt reduction or stabilization
CL
CL
42 31Reduce social spending
d
d
0 0Reduce or stabilize civil sector employment
CL
CL
5 4Tax system reforms ? ? 41 29
Fiscal reforms ? ? 15 10
M arket competitiveness
Trade liberalization
d
d
31 22Privatization
d
d
44 31Labor market reforms
CL
CL
4 3Educational sector
Increase in education spending
tr
tr
34 24Education sector reforms
tr
tr
10 7W age bill ceilings (in social sectors)
d
d
16 12User fees on education
CL
d
1 1
Variable N
Country with IM F program 37
Country had an IM F program before first survey 33
Total num ber of programs 73
- Short-term 18
- Long-term 55
Average length o f programs - All 3.3
- EFF 3.3
- SBA 2.1
- ESAF 3.5
Table 2. Growth in school enrollment by sex, age and program and non-program countries.
9-11
12-14
Countries Boys Girls Boys Girls IM F program T1 Growth T1 Growth T1 Growth T1 Growth
Azerbaijan 97.4 0.2 95.4 1.1 97.0 0.6 94.2 -0.5 Bangladesh 85.9 9.8 89.5 8.2 64.9 12.7 72.3 16.5 Benin 72.2 -1.7 50.9 18.7 65.6 4.4 41.7 22.3 Brazil 94.8 3.1 95.4 3.2 91.2 4.4 92.0 4.0 Burkina Faso 45.6 7.8 34.5 15.4 38.1 6.8 29.2 13.1 Cambodia 78.1 16.2 77.9 24.1 80.2 13.2 63.8 39.2 Cameroon 86.1 7.1 84.7 10.3 85.1 8.3 80.0 7.4 Chad 46.4 7.7 32.7 32.9 48.1 13.0 29.0 69.1 Colombia 94.3 -0.3 96.1 -0.6 84.2 4.3 87.2 4.2 Dominican Republic 95.2 1.9 96.2 1.6 94.0 0.7 95.4 0.9 Ethiopia 49.0 16.0 41.7 25.0 56.4 13.7 45.3 22.6 Ghana 76.9 2.4 76.6 6.2 77.8 10.6 75.4 14.6 Guinea 37.6 85.3 26.3 148.3 40.9 62.4 26.5 119.8 Gambia 93.8 -22.5 90.7 -18.3 91.4 -15.8 83.7 -16.3 Indonesia 95.8 1.1 97.1 0.4 85.0 3.6 85.6 5.4 Kazakhstan 98.7 0.7 99.2 0.5 99.3 0.3 99.0 0.7 Kenya 93.7 -3.8 93.0 -4.8 92.4 -5.1 88.6 -5.0 Kyrgyz Republic 98.5 0.9 99.0 -0.3 96.6 2.0 97.9 1.6 Lesotho 96.3 -8.2 96.6 -0.2 90.4 -9.3 90.5 4.1 M adagascar 66.3 26.3 68.5 24.2 54.0 24.0 50.3 44.6 Malawi 85.3 7.2 87.4 5.7 84.1 6.6 82.9 8.5 Mali 53.5 3.0 42.5 20.2 49.0 15.0 32.0 41.2 M ongolia 83.4 16.0 83.5 16.5 76.6 23.0 86.2 11.5 Niger 42.1 24.3 37.2 32.8 30.8 95.9 26.4 42.9 Nepal 88.1 9.6 71.6 28.1 81.8 11.9 63.5 30.5 Peru 97.6 0.4 96.8 1.9 94.0 2.4 90.5 2.6 Rwanda 66.1 70.3 67.0 72.4 55.9 90.9 54.0 78.2 Senegal 55.5 14.8 47.3 41.2 49.5 23.3 35.6 60.5 Sierra Leone 91.5 -12.0 93.9 -16.5 92.2 -12.3 90.7 -22.6 Tajikistan 97.3 1.9 94.1 3.4 94.8 2.8 88.8 3.1 Tanzania 58.3 44.9 61.5 44.4 71.8 17.0 73.7 12.0 Turkey 93.4 6.0 86.4 13.1 74.1 29.4 49.5 83.1 Uganda 91.2 0.9 91.6 0.7 91.2 -0.1 87.6 1.8 Vietnam 96.5 1.0 96.7 -1.7 90.3 2.1 84.8 4.9 Yemen 86.4 2.7 52.2 33.4 85.4 0.6 40.7 43.6 Zimbabwe 96.3 -2.2 96.1 -0.1 91.3 -6.1 89.6 -0.8 Non IM F-program Egypt 98.7 -2.1 98.3 -2.5 93.8 -3.6 93.8 -2.7 Haiti 83.8 -0.8 86.6 -0.9 85.4 0.5 84.7 4.9 India 91.3 -0.8 85.4 3.8 83.0 2.5 74.3 10.8 Namibia 88.6 3.5 89.9 4.5 85.2 6.8 89.9 2.9 South Africa 96.4 -1.5 95.4 0.4 95.2 0.0 93.9 3.4 Swaziland 95.8 -3.9 95.1 -2.6 91.5 -1.2 92.2 -0.2 Syria 97.5 -0.3 95.6 1.7 79.1 10.1 73.8 15.7 Uzbekistan 98.1 2.0 97.2 3.0 96.6 3.3 97.6 2.0
Table 3. Coefficients o f bivariate multilevel regression analyses o f IM F programs and their characteristics according to sex and age group with the growth in enrollment as dependent variable.__________________________________________________________
Girls Boys
Independent variable (all at T1) (9-11) (12-14) (9-11) (12-14)
IM F program in last 5 years before first survey 12.7 13.1 6.4 6.1
IM F program 15.5 17.1 9.4 10.5
Short-term IM F program 1.3 7.8 1.7 2.4
Long-term IM F program 19.7* 2 0.1* 11.7 13.0
Deficit reduction(s) 6.0 11.3 4.2 9.2
Civil sector reductions(s) -0.6 -1.5 1.4 13.5
Privatization -1.6 4.0 1.2 6.1
Policies to decrease the level of corruption 13.4 5.1 8.4 -0.3
Tax system reforms 13.9* 15.6* 7.9 9.7
Labor market reforms 17.2 32.0* 6.0 29 y**
Reduce or stabilize the level o f public debt 8.5 7.8 8.6 11.6 Current account deficit reduction or stabilization 20.3*** 16.0* 12.3** 13.0*
Increase in education spending 17.7** 16.7** 1 0.8** 12.3*
Increases in or stabilize net international reserves 2.7 -3.8 6.6 0.9
Trade liberalization 15.6** 9.2 1 1.0** 10.5
Fiscal reforms -1.4 -5.0 2.5 -0.4
Increases in budget deficit/or higher government expenditure 24.4** 18.2 8.3 3.7 W age bill ceilings (in social sector) 2 0.1** 18.0* 9.0 8.7
Education sector reforms 0.1 4.6 -3.4 10.8
Reduce or stabilize inflation 17.0* 18.3* 7.5 10.9
Keep inflation below 12 percent 12.7* 2.5 7.5 7.8
*** P<0.01; ** P<0.05; * P<0.1 Number o f districts in sam ple = 431
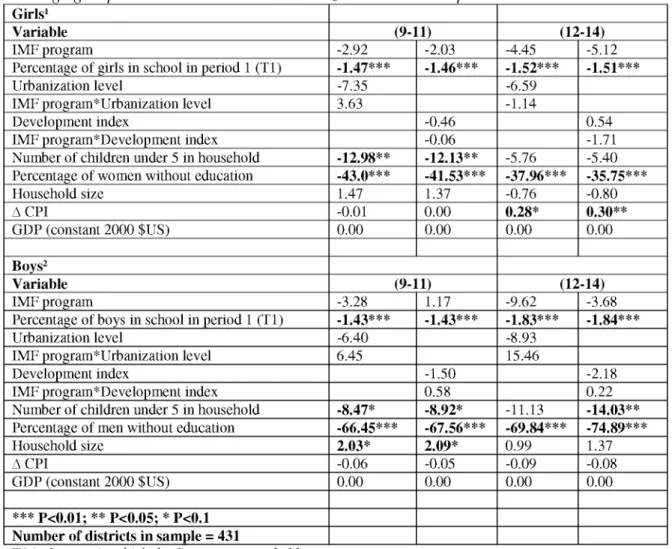
Table 4. Coefficients o f all IM F programs and explanatory variables according by sex and age group with interactions with urbanization and development._______________
Girls1
Variable (9-11) (12-14)
IM F program -2.92 -2.03 -4.45 -5.12
Percentage o f girls in school in period 1 (T1) -1.47*** -1.46*** -1.52*** -1.51***
Urbanization level -7.35 -6.59
IM F program*Urbanization level 3.63 -1.14
Development index -0.46 0.54
IM F program*Development index -0.06 -1.71
Number of children under 5 in household -12.98** -12.13** -5.76 -5.40 Percentage o f women without education -43.0*** -41.53*** -37.96*** -35.75***
Household size 1.47 1.37 -0.76 -0.80 A CPI -0.01 0.00 0.28* 0.30** GDP (constant 2000 $US) 0.00 0.00 0.00 0.00 Boys2 Variable (9-11) (12-14) IM F program -3.28 1.17 -9.62 -3.68
Percentage o f boys in school in period 1 (T1) -1.43*** -1.43*** -1.83*** -1.84***
Urbanization level -6.40 -8.93
IM F program*Urbanization level 6.45 15.46
Development index -1.50 -2.18
IM F program*Development index 0.58 0.22
Number of children under 5 in household -8.47* -8.92* -11.13 -14.03**
Percentage o f men without education -66.45*** -67.56*** -69.84*** -74.89***
Household size 2.03* 2.09* 0.99 1.37
A CPI -0.06 -0.05 -0.09 -0.08
GDP (constant 2000 $US) 0.00 0.00 0.00 0.00
*** P<0.01; ** P<0.05; * P<0.1 Number o f districts in sam ple = 431
Table 5. Coefficients o f short-term IMF programs and explanatory variables according by sex and age group with interactions with urbanization and development.
Girlsi
Variable (9-11) (12-14)
IM F program (short term) 6.9 9*** 4.75***