Gram-positive and Gram-negative Protein Subcellular
Localization by Incorporating Evolutionary-based
Descriptors into Chou’s General PseAAC
Abdollah Dehzangi1,2,∗, Rhys Heffernan 3, Alok Sharma1,4, James Lyons3, Kuldip Paliwal3, Abdul Sattar1,2
1Institute for Integrated and Intelligent Systems, Griffith University, Brisbane, Australia 2National ICT Australia (NICTA), Brisbane, Australia
3School of Engineering, Griffith University, Brisbane, Australia 4 School of Engineering and Physics, University of the South Pacific, Fiji
∗Corresponding author at: P.O. 4111, Institute for Integrated and Intelligent Systems
(IIIS), Griffith University, Brisbane, Australia ([email protected]). Tel.: +61 7 3735 5381; Fax: +61 7 3735 4066.
Abstract
Protein subcellular localization is defined as predicting the functioning loca-tion of a given protein in the cell. It is considered an important step towards protein function prediction and drug design. Recent studies have shown that relying on Gene Ontology (GO) for feature extraction can improve pro-tein subcellular localization prediction performance. However, relying solely on GO, this problem remains unsolved. At the same time, the impact of other sources of features especially evolutionary-based features has not been explored adequately for this task. In this study, we aim to extract discrim-inative evolutionary features to tackle this problem. To do this, we propose two segmentation based feature extraction methods to explore potential local evolutionary-based information for Gram-positive and Gram-negative subcel-lular localizations. We will show that by applying a Support Vector Machine (SVM) classifier to our extracted features, we are able to enhance
Gram-positive and Gram-negative subcellular localization prediction accuracies by up to 6.4% better than previous studies including the studies that used GO for feature extraction.
Keywords: Protein subcellular localization, Evolutionary-based Features, Segmented autocorrelation, Segmented distribution, Support Vector Machine (SVM)
1. Introduction
Most proteins can only function in one specific place in the cell (e.g. nucleus, membrane) while some other proteins can function in several places in the cell [1]. For a given protein, to function properly, it needs to be in one or a few specific locations in the cell as it malfunctions in all other places [2]. Therefore, protein subcellular localization prediction is considered an important step towards protein function prediction and consequently, drug design [2, 3, 4]. Among all kind of proteins, Bacterial proteins are among the most important proteins to determine their functions due to the wide range of both harmful and useful roles they play in biological interactions [5]. Bacteria are categorized as a kind of Prokaryotic micro-organism that can be divided into two groups, namely: Gram-positive and Gram-negative. Some bacteria can cause a wide range of diseases while some others play the role of catalyst in biological interactions. Some bacteria are also widely used to produce antibiotics [6].
The exponential increase in the number of sequenced proteins and the much slower rate of determining protein structure using experimental ap-proaches highlights the demands for a fast computational approach to
ad-dress this problem as an alternative to experimental methods [4]. Among the computational approaches, pattern recognition-based methods have at-tained the most promising results. Since the introduction of the protein subcellular localization prediction over two decades ago, a wide range of pat-tern recognition-based approaches have been proposed to solve this problem [7, 8, 9]. The performance of a pattern recognition technique to address pro-tein subcellular localization prediction problem depends on the classification technique as well as features being used [10, 11, 12, 13, 14, 15].
To tackle this problem, a wide range of classification techniques have been implemented and used [4, 16, 17, 18, 19, 20, 21, 22, 23, 24, 25]. Among these classifiers, Support Vector Machine (SVM) [19, 21, 26, 27, 28] or K-Nearest Neighbor (KNN) based classifiers [17, 29, 30, 31, 32] have attained the most promising results. However, the most significant enhancements in protein subcellular localization prediction have been achieved by improving the feature extraction techniques rather than improving on the classification techniques being used [14].
In general, extracted features for this problem can be categorized into sequential, physicochemical, structural, evolutionary, and Gene Ontology-based (GO) features [33]. Early studies have relied on sequential-Ontology-based fea-tures which are extracted from the alphabetic sequence of proteins such as occurrence of amino acids along the protein sequence (Occurrence feature group), or percentage of the occurrence of the amino acids along the protein sequence (Composition feature group) [8, 9, 34, 35]. To add more information about the physical (e.g. size of the amino acids [23]), and chemical (e.g. hy-drophobicity [26]) properties of the amino acids as well as information about
the structure of the proteins (predicted secondary structure of the proteins [12, 11, 36]), physicochemical and structural information has been added to the sequential-based features. Adding these features obtained better re-sults than relying solely on sequential-based features. However, with these features, protein subcellular localization prediction accuracy has remained limited [23, 11].
Later studies have used evolutionary-based features as more informative features to address protein subcellular localization. This information has been mainly extracted from the substitution probabilities of the amino acids along the protein sequence fromPosition Specific Scoring Matrix (PSSM)[37, 38, 39]. However, relying on PSSM for feature extraction, protein subcellular localization still has room for improvement. The main reason is that previous studies failed to capture local discriminatory information embedded in PSSM properly. They have mainly tried to extract this local information using the protein sequence as a single block which has failed to achieve this goal [23, 22, 40].
The most significant enhancement for protein subcellular localization pre-diction accuracy has been achieved by usingGene Ontology (GO) for feature extraction [17, 19, 41, 10, 42, 5, 43, 44]. The GO describes the properties of genes in organisms. The GO database was initially established to represent molecular function, biological process and cellular components of proteins. Despite its importance, GO has three main drawbacks. First, extracting GO for proteins produces a large number of features (over 18000) which needs further process and filtering to extract discriminatory features [41, 10]. Sec-ond, the GO information for new proteins is unavailable and many studies
use homology-based approaches to extract GO for these proteins which in-troduces inaccuracy [19, 10]. Finally, GO provides information regarding the functioning of the proteins which includes prior knowledge and is not considered as an ab-initio feature source [25, 45]. Hence, GO needs further investigation and filtering to be used as a reliable source for feature extraction purposes.
As realized by a series recent publications [46, 47, 48, 49, 50, 51, 52, 53, 54] and called for by Chou in [55], to establish a really useful statistical predic-tor for a biological system, we need to consider the following procedures: (i) construct or select a valid benchmark dataset to train and test the pre-dictor; (ii) formulate the biological samples with an effective mathematical expression that can truly reflect their intrinsic correlation with the target to be predicted; (iii) introduce or develop a powerful algorithm (or engine) to operate the prediction; (iv) properly perform cross-validation tests to ob-jectively evaluate the anticipated accuracy of the predictor; (v) establish a user-friendly web-server for the predictor that is accessible to the public. Below, let us describe how to deal with these steps one-by-one.”
In this study, we aim to explore potential discriminatory information embedded in PSSM to tackle protein subcellular localization. To capture this information, we propose two segmentation-based feature extraction tech-niques, namely: segmented distribution method to capture local density and distribution information and segmented auto covariance method to capture local information about the interaction and correlation of neighboring amino acids. These feature groups have attained promising results in similar stud-ies [40, 56, 57, 58]. Furthermore, we employ the occurrence feature group
to capture global information from evolutionary information embedded in PSSM and to complement local information extracted using the segmented distribution and the segmented auto covariance features [59]. In this manner, we propose a new reliable method that captures the potential discriminatory information of the evolutionary-based features for protein subcellular local-ization.
We also employ an SVM classifier which is considered among the best classification techniques used for this problem and has obtained consistent results using segmentation-based features. By applying SVM to our extracted features, we achieve 88.2% and 80.0% prediction accuracies for Gram-positive and Gram-negative protein subcellular localizations, respectively. These re-sults are 3.2% and 6.4% better than previously reported rere-sults for Gram-positive and Gram-negative protein subcellular localization which have also used GO for feature extraction [25, 41].
2. Benchmarks
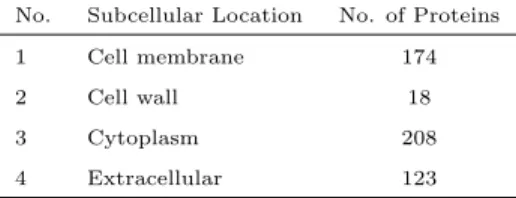
In this study, we use two benchmarks that have been widely used in the literature for Gram-positive and Gram-negative subcellular localizations. For the Gram-positive subcellular localization, we use the benchmark that was proposed in [17, 18, 24]. This benchmark consists of 519 different proteins belonging to four Gram-positive subcellular locations. Among these 519 pro-teins, 515 belong to one location while four belong to two locations. Hence, there are 523 (515 + 4 × 2) samples in total. The name of these four lo-cations and the number of proteins in each location is shown at Table 1.
Gpos-multi.
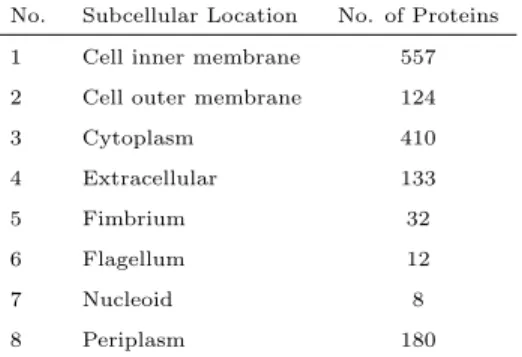
For the Gram-negative we also use the benchmark that was introduced in [17, 18, 60]. This benchmark consists of 1392 different proteins belonging to eight Gram-negative subcellular locations. Among these proteins 1328 belong to one location and 64 to two locations. Therefore, there are 1456 (1328 + 64 × 2) total samples in this benchmark. The name of these eight locations and the number of proteins in each location is provided in Table 2.
This benchmark is available at: http://www.csbio.sjtu.edu.cn/bioinf/
Gneg-multi/.
To classify the multi-location proteins, we use the same method as used in [25, 41]. We copy the multi label proteins as several single-label samples based on the number of their labels in our benchmarks. For example a protein with two labels has been used as two single label samples. Then, we conduct the classification task. In this way, by adding extra error, we calculate the worst case as we might not be able to predict the extra label of a single protein that has several labels. Calculating a protein’s location in this way, we guarantee that we consider the worst case for our prediction task.
Table 1: The name and the number of proteins in each location in Gram-positive bacteria.
No. Subcellular Location No. of Proteins
1 Cell membrane 174
2 Cell wall 18
3 Cytoplasm 208
Table 2: The name and the number of proteins in each location in Gram-negative bacteria.
No. Subcellular Location No. of Proteins 1 Cell inner membrane 557 2 Cell outer membrane 124
3 Cytoplasm 410 4 Extracellular 133 5 Fimbrium 32 6 Flagellum 12 7 Nucleoid 8 8 Periplasm 180
3. Feature Extraction Method
The main aim of this study is to explore local and global discriminatory information embedded in PSSM for protein subcellular localization. To do this, we will extract a feature group from the transformed protein sequence using evolutionary information in PSSM, namely: consensus sequence-based occurrence (AAO). We will also extract three more feature groups directly from PSSM, namely: semi-occurrence (PSSM-AAO), segmented distribution (PSSM-SD), and segmented auto covariance (PSSM-SAC). Therefore, we first need to produce PSSM.
We produce PSSM for our employed benchmarks as the output (us-ing three iterations to produce PSSM) of the PSI-BLAST algorithm us(us-ing NCBI’s non redundant (NR) database and cut off value (E) of 0.001 [61]. PSSM provides the substitution probability of a given amino acid based on its position in a protein sequence with all 20 amino acids. It consists of an L × 20 matrix (where L is the length of protein sequence and 20 columns represent 20 amino acids) which includes the log-odds of the substitution probabilities of the amino acids [37, 62]. In this study, we have used the
log-odds values to extract our features. It was shown in the literature that using these numbers produce similar output as using the probability values [40, 58]. In the following subsections these four feature extraction methods will be explained in detail.
3.1. Consensus Sequence-based Occurrence (AAO)
This feature group is extracted to provide global information regarding the occurrence of the amino acids along the protein sequence with respect to evolutionary information captured in PSSM. To incorporate evolutionary-based information into the original protein sequence, we transform it using PSSM in the following manner. In the protein consensus sequence, amino acids along the original protein sequence (O1, O2, ..., OL) are replaced with
the corresponding amino acids with the maximum substitution probabilities in PSSM (C1, C2, ..., CL). We first calculate the index of the amino acid with
the highest substitution probability (based on its position in the protein sequence) as follows:
Ii= argmax{Pij : 1≤j≤20}, 1≤i≤L, (1)
wherePij is the substitution probability of the amino acid at locationi with
the jth amino acid in PSSM. Then, we replace the amino acid at ith location
of original protein sequence by the Ith amino acid to form the consensus sequence. After producing the protein consensus sequence, we produce the occurrence feature group as a 20 dimensional feature vector consisting of the number of occurrence of each amino acid along the protein consensus sequence. Despite its simplicity, the occurrence feature group has shown its
effectiveness in maintaining global discriminatory information with respect to the length of a protein sequence [63, 59, 58].
3.2. Semi Occurrence (PSSM-AAO)
This feature group is directly extracted from PSSM. It aims at captur-ing global discriminatory information regardcaptur-ing the substitution probabilities of the amino acids with respect to their positions in the protein sequence. PSSM-AAO is produced by summation of the substitution score of a given amino acid with all the amino acids along the protein sequence which is calculated as follows: PSSM-AAOj = L X i=1 Pij , (j= 1, ...,20). (2)
The main advantage of using the occurrence feature group over using the composition feature group (in both AAO and PSSM-AAO feature groups) is that it captures information regarding the length of the proteins whereas this information is disregarded in the composition feature group [59, 63]. To extract the occurrence features, we calculate the summation of the total sub-stitution score for a given amino acids while in composition based features, we divide this number with the length of the amino acids. In fact, in compo-sition method, we normalize the occurrence of the amino acids, for a given protein, based on its length. We do not do this normalization which maintain the general total occurrence of the amino acids based on their substitution scores. Since we do not normalize by dividing it by length, it becomes im-plicitly a part of that feature [59, 63, 64, 65].
3.3. Segmented Distribution (PSSM-SD)
This method is specifically proposed to add more local discriminatory information about how the amino acids, based on their substitution proba-bilities (extracted from PSSM), are distributed along the protein sequence [66]. We propose this segmentation method in the manner where segments of a protein sequence are of unequal lengths and each segment is represented by a distribution feature which is computed as follows. First, for thejth col-umn in PSSM, we calculate the total substitution probabilityTj =
PL i=1Pij.
Then, starting from the first row of PSSM, we calculate the partial sumS1 of
the substitution probabilities of the firsti amino acids until reachingFp% of
the total sumS1 =
PIj1
i=1Pij. Using the distribution factorFp%, we calculate
the I1
j. Where Ij1 corresponds to the number of the amino acids such that
the summation of their substitution probabilities is less than or equal to the
Fp% of Tj. Similarly, we continue to calculate the partial sum of the first i
amino acids (starting from the first row of PSSM) until reaching n × Fp%
= 50% of the total sum (Sn =
PIjn
i=1Pij) and calculate theIjn corresponding
to the number of amino acids such that the summation of their substitution probabilities is less than or equal to 50% of Tj. Therefore, starting from the
first row of PSSM, we extractn features (Ij1, Ij2, ... Ijn) corresponding to the number of segments until reaching 50% of Tj.
We repeat the same process beginning from the last row of PSSM for the
jth column. We calculate the partial sum of the substitution probabilities of
the first i amino acids until reaching n×Fp%= 50% of the total sum which
isSn+1=P
Inj+1
i=1 Pij until reachingS2n =P Ij2n
i=1Pij, respectively and calculate
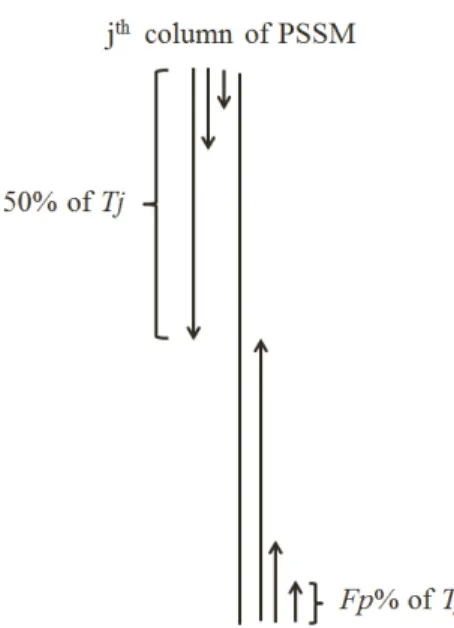
Figure 1: The segmentation method used to extract PSSM-SD feature group from thejth
column of PSSM.
acids such that the summation of their substitution probabilities are less than or equal toFp% andn×Fp% = 50% ofTj, respectively (starting from the last
row of PSSM). Therefore, starting from the last row of the PSSM, we extract
n features (Ijn+1,Ijn+2, ... I2n
j ) corresponding to the number of segments until
reaching 50% of Tj. In this manner we extract 2n segmented distribution
features for each column in PSSM. The method is used to calculate PSSM-SD feature group from the jth column of PSSM is shown in Figure 1. We
repeat the same process for all 20 columns corresponding to 20 amino acids in PSSM.
In this study, we adopt three values for Fp (5, 10, and 25) to investigate
the effectiveness of the number of segments on the achieved results and find the suitable number of segments to explore local discriminatory information
embedded in PSSM. We have used other choices for Fp but these three
re-mains the best representatives of all the choices. To maintain the generality and simplicity of the segmentation method, we avoid a very specific segmen-tation method as it might not be applicable for all cases. For PSSM-SD feature group, using Fp = 5, we divide the protein sequence into 20 segments
(n = 10 from each side) and extract 400 features in total in this feature group (20×20 = 400). Similarly, using Fp = 10 (n = 5 from each side)
we divide the protein sequence in to 10 segments and extract 200 features in total (10×20 = 200) and by using Fp = 25 (n = 2 from each side), we
extract 80 features in total (4×20 = 80).
3.4. Segmented Auto Covariance (PSSM-SAC)
It was shown that information about the interaction of neighboring amino acids along the protein sequence can play an important role in providing sig-nificant local discriminatory information and enhancing protein subcellular localization prediction accuracy [67, 64]. To extract this information, the concept of auto covariance has been widely used in the literature in differ-ent ways (e.g. bi-gram [27, 64], tri-gram [39, 68], auto correlation [69, 70]). Among all these methods, pseudo amino acids composition has attained the best results to extract local information [17, 19, 71, 72, 73, 55]. In the present study, we extend the concept of segmented distribution features as described in the previous subsection to compute the auto covariance features from the segmented protein sequence [65]. This is done to enforce local discriminatory information extracted from PSSM.
To extract this feature group, we calculate the auto covariance of the substitution probabilities of the amino acids using Kp as the distance
fac-tor in the following manner. Starting from the first row of PSSM, for the
jth column of PSSM, we calculate Kp auto covariance features for the first
I1
j. Similarly, we calculate auto covariance until reaching the first Ijn amino
acids. Then starting from the last row of PSSM for thejth column of PSSM, We repeat the same process for Ijn+1 and until reaching I2n
j (Ij1 to Ijn and
Ijn+1 until reaching to Ij2n are calculated in the way that is explained in the previous subsection). This process is repeated for all 20 columns of PSSM and corresponding features are calculated as follows:
PSSM-segq,m,j= 1 (Ijq−m) Ijq−m X i=1
(Pi,j−Pave,j)×(P(i+m),j−Pave,j),
(q= 1, ...,2n & m= 1, ..., Kp & j= 1, ...,20), (3)
where, Pave,j is the average substitution probability for the jth column in
PSSM. Note that n×Kp auto covariance coefficients are computed in this
manner by analyzing PSSM in the downward direction and n × Kp auto
covariance coefficients are computed in this manner by analyzing PSSM in the upward direction (2n×Kp features in total). We also compute the global
auto covariance coefficient (Kp features) of PSSM as follows:
PSSM-ACm,j = 1 (L−m) L−m X i=1
(Pi,j−Pave,j)×(P(i+m),j−Pave,j),
(m= 1, ..., Kp & j= 1, ...,20). (4)
Thus, we have extracted a total of (nKp+nKp+Kp = (2n+ 1)Kp) auto
covariance features in this manner (for the jth column of the PSSM). For
probabilities of the amino acids are extracted and combined to build the corresponding feature group which will be referred to as PSSM-SAC (PSSM-seg + PSSM-AC which consists of 20×(2n+ 1)×Kp features in total).
We will construct a feature vector consisting of our extracted features and call it PSSM-S (AAO + PSSM-AAO + PSSM-SAC + PSSM-SD = PSSM-S). We can represents our feature vector as:
F = [f1,1, f2,1, ..., fm,1, fm+1,2, ..., fp,2, fp+1,3, ..., fq,3, fq+1,4, ..., fn,4]T, (5)
where the superscript T indicates the transpose of the vector and in fn,4
the first index (n) indicates the number of features and the second index (4) represents four feature groups used in this study (AAO, AAO, PSSM-SAC, PSSM-SD), respectively. These feature vector can also be written in the form of Chou’s general PseAAC (pseudo amino acid composition [74, 62]). To do this, let us write the this feature vector as:
F = [ψ1, ψ2, ..., ψm, ..., ψΩ]T, (6)
where Ω is the dimensionality of the feature vector F. The components of feature vector F can be expressed as the pseudo amino acid features [75, 76, 77, 78] as follows: ψm=
f−,1 from 1 to m∈AAO feature group
f−,2 from m+ 1 to p∈PSSM-AAO feature group f−,3 from p+ 1 to q∈PSSM-SAC feature group f−,4 from q+ 1 to n∈PSSM-SAC feature group
4. Support Vector Machine
SVM is considered to be one of the best pattern recognition techniques [79]. It is also widely used in Bioinformatics and has outperformed other classifiers and obtained promising results for protein subcellular localization as well as similar studies [40, 58, 80, 81, 82]. It aims to reduce the prediction error rate by finding the hyperplane that produces the largest margin based on the concept of support vector theory. It transforms the input data to higher dimensions using the kernel function to be able to find support vectors (for nonlinear cases). The classification of some known points in input space
xi isyi which is defined to be either -1 or +1. If x0 is a point in input space
with unknown classification then:
y0 =sign n X i=1 aiyiK(xi,x0) +b , (8)
where y0 is the predicted class of point x0. The function K() is the kernel function; n is the number of support vectors and ai are adjustable weights
and b is the bias. In this study, the SVM classifier is implemented with the LIBSVM toolbox using the Radial Basis Function (RBF) as its kernel [83]. RBF kernel is adopted in our experiments due to its better performance than other kernels functions (e.g. polynomial kernel, linear kernel, and sigmoid). RBF kernel is defined as follows:
K(xi,xj) =e−γkxi−xjk
2
, (9)
where γ is the regularization parameter, xi and xj are input feature vectors.
In this study, the γ in addition to the cost parameter C (also called the soft margin parameter) of the SVM classifier are optimized using a grid search
algorithm which is also implemented in the LIBSVM package. Despite its simplicity, grid search has been shown to be an effective method to optimize these parameters.
5. Results and Discussion
We investigate the effectiveness of our proposed approaches in the follow-ing steps. First we study the effective values for the distribution factor (Fp) in
the segmented distribution feature group and the distance factor (Kp) in the
segmented auto covariance feature group. In the second step, we investigate the performance of our proposed feature groups by evaluating their effective-ness on the achieved results. Finally, we compare our achieved results with the previously reported results found in the literature.
5.1. Evaluation methods
To evaluate the performance of our proposed method, we use Jackknife cross validation as it has been widely used in the literature for this task and has been shown to be the most consistent and reliable method [16, 29, 84, 85, 86, 87, 88, 89]. Jackknife cross validation iteratively uses all but one sample as the training set and the remaining sample for testing until all the samples are used exactly once for testing purpose. For example, for a benchmark consists of n samples, Jackknife cross validation uses n−1 samples as training set and the remaining sample as the testing data in each iteration. It repeats this process n times until all the samples in the benchmark has been used once and only once as the test sample. Hence, it produces exactly one result for each sample and uses the maximum number of available samples (n−1) for training in each iteration.
To provide more information about the statistical significance of our achieved results, we will report Sensitivity, Specificity, and Matthew’s Cor-relation Coefficient (MCC) for each subcellular location as well as for the overall benchmark [12, 21, 58, 90]. Sensitivity, which is also referred to as the true positive rate, is a criterion used to evaluate the model as a metric of its ability to identify the correct samples. While specificity, which is also referred to as the true negative rate, is a criterion to specify the ability of the model to identify negative samples. These two parameters varies between 0 to 1. Having specificity, and sensitivity equal to 1 represents a fully accu-rate model while 0 represents a fully inaccuaccu-rate. On the other hand, MCC measures the prediction quality of the model. In other words, it relates sen-sitivity and specificity parameters together and measures the correlation of the classification task. MCC varies between -1 and 1. Having an MCC equal to 1 represents full classification correlation for the model, 0 represents a ran-dom classification correlation, and -1 represent the full negative classification correlation. These three parameters are calculated as follows:
Sensitivity= T P T P+F N ×100, (10) Specif icity= T N T N+F P ×100, (11) M CC= p (T N×T P)−(T N×F P) (T P +F P)(T P +F N)(T N+F P)(T N+F N), (12)
whereT P is the number of correctly identified (true positive) samples,F N is the number of incorrectly rejected samples (false negative), T N is the num-ber of correctly rejected (true negative) samples, and F P is the number of
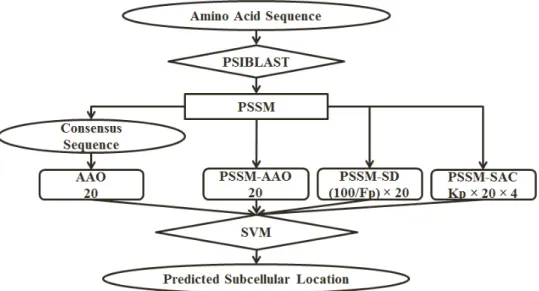
Figure 2: The overall architecture of our proposed approach. The number of features extracted for each feature group is mentioned under its name.
incorrectly accepted samples (false positive). Note that the average sensitiv-ity for the whole sample set is also equal to the overall prediction accuracy which is the total number of correctly classified sample (C) over the total number of samples in the data set (N) and is calculated as follows:
Q= C
N. (13)
We will report the overall prediction accuracy as percentage (%).
5.2. Studying the effective values for Fp and Kp
In this step, we construct a feature vector consisting of our extracted features and call it S (AAO + AAO + SAC + PSSM-SD = PSSM-S). The overall architecture of our proposed model is shown in Figure 2. We investigate the largest effective value for Kp in the range
mentioned in Section 3. Investigating Kp until 10 is done because it has
been shown as the effective value for this parameter for similar studies. It was shown that the effectiveness of this parameter does not vary significantly for values greater than 10, especially for the segmentation based method. Also, studying Fp for three values of 25, 10, and 5 is done because these
numbers have been widely used in the literature as the distribution factors to extract distribution-based features. Hence, we produce 30 (10 values for
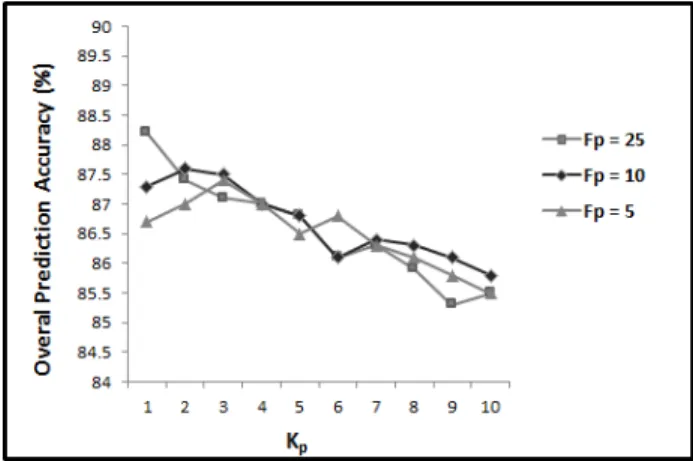
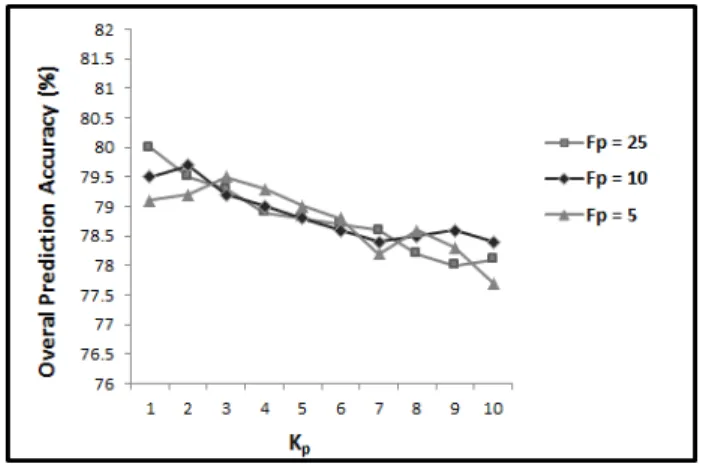
Kp and 3 values forFp) results for each benchmark. The results achieved for
Gram-positive and Gram-negative bacterial proteins benchmarks are shown in Figure 3 and Figure 4, respectively.
Figure 3: The overall accuracies achieved for Gram-positive data set forKp from 1 to 10
andFp for 5, 10, and 25.
Note that we optimized the parameters (the regularization parameter (γ) and the cost parameter (C)) for our employed classifier (SVM classifier using RBF as its kernel function) using Gram-positive benchmark and for Fp = 5
and Kp = 10. It is done to avoid over fitting these two parameters. We have
Figure 4: The overall accuracies achieved for Gram-negative data set forKp from 1 to 10
andFp for 5, 10, and 25.
be able to investigate the generality of our proposed methods. The optimized values for γ and C are 0.005 and 3000 which are used for the rest of our experiments, respectively.
It is shown in Figure 3 and Figure 4 that by increasing the value of Kp
from 1 to 10 (for all three values of Fp), the prediction accuracy declines.
Increasing Kp from 1 to 10, increases the number of extracted features from
100 to 1000. Depending on the problem, the extra features can provide more discriminatory information about the correlation of amino acids and consequently increase the prediction accuracy. At the same time, they can also mask the impact of other features and increase the possibility of over fitting depending on the problem. Therefore, the number of feature being used is directly related to the case study. Our results shown that by increasing the distance factor, and consequently increasing the number of features, the prediction accuracy declines. This means increasing the distance factor (Kp
achieved results show that the prediction accuracy is maximum for Fp = 25
occurs when Kp = 1 while for Fp = 10 or Fp = 5 it occurs when Kp = 2 or
Kp = 3, respectively.
As we increase the number of segments by reducing the distribution fac-tor, we also increase the number of features (80 features for Fp = 25, 200
features for Fp = 10, and 400 features for Fp = 5). We can see in Figure
3 and Figure 4 that increasing the number of features in PSSM-SD (reduc-ing the distribution factor from 25 to 5) requires the number of features in PSSM-SAC to be increased in the beginning to improve the prediction per-formance (Kp from 1 to 3). However, by increasing Kp to more than 3, the
prediction accuracy decreases for all 3 values ofFp. Therefore, to explore
po-tential discriminatory information extracted by PSSM-SD and PSSM-SAC, the number of features in these two feature groups should be consistent. As soon as the number of features in one of these feature groups increases significantly compared to the other one, the prediction accuracy declines.
It is shown in Figure 3 and Figure 4, for both positive and Gram-negative subcellular localization benchmarks, the highest results are achieved for Fp = 25 and Kp = 1. This is even higher than the results achieved by
using Fp = 10 and Kp = 2 or Fp = 5 and Kp = 3. This shows that using
Fp = 25 and Kp = 1 in PSSM-SD and PSSM-SAC, we are able to explore
potential discriminatory information in PSSM for these two feature groups. Therefore, we extract PSSM-SD and PSSM-SAC feature groups for Fp = 25
andKp = 1 as the effective values for these parameters for protein subcellular
localization and for the rest of our experiments. For PSSM-S using Fp = 25
PSSM-AAO features + 80 PSSM-SD features + 100 PSSM-SAC features), we report 88.2% and 80.0% overall prediction accuracies for Gram-positive and Gram-negative bacterial proteins, respectively [17, 25, 41, 91].
5.3. The impact of our extracted features on the achieved results
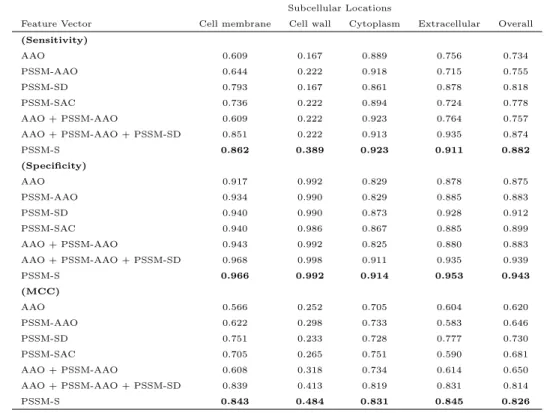
To provide more insight to our achieved results and also to investigate the impact of the feature group proposed in this study, we use SVM on each of the extracted feature groups as well as their combinations to build PSSM-S. The sensitivity, specificity, and MCC for each subcellular location as well as overall values for Gram-positive and Gram-negative subcellular localization benchmarks are shown in Table 2 and Table 3. As it is shown in these tables, the reported results for PSSM-S is better than the results achieved by using each of the feature groups explored in this study independently as well as any other combinations of these feature groups. This highlights the impact of our proposed feature groups.
High values achieved in Table 2 for sensitivity, specificity, and MCC high-lights the statistical significance of our achieved results and effectiveness of PSSM-S for the Gram-positive protein subcellular localization [17, 24, 25, 91]. For the Gram-negative benchmark, the sensitivity, and MCC are high for the Cell inner membrane, Cytoplasm, Fimbrium, and Periplasm while they are lower (over 0.5) for the Cell outer membrane, and Extracellular, and very low for the Flagellum, and Nucleoid. The poor results for the Cell outer membrane, and Extracellular locations are due to the difficulty of calculat-ing these locations as it was emphasized in previous studies [21, 29, 90, 91]. For the Flagellum, and Nucleoid locations, the main reason for very low sensitivity and MCC is the number of samples belonging to each location.
Table 3: The sensitivity, specificity and MCC measurements for our proposed feature groups and their combination to build PSSM-S for Gram-positive bacterial proteins bench-mark
Subcellular Locations
Feature Vector Cell membrane Cell wall Cytoplasm Extracellular Overall (Sensitivity) AAO 0.609 0.167 0.889 0.756 0.734 PSSM-AAO 0.644 0.222 0.918 0.715 0.755 PSSM-SD 0.793 0.167 0.861 0.878 0.818 PSSM-SAC 0.736 0.222 0.894 0.724 0.778 AAO + PSSM-AAO 0.609 0.222 0.923 0.764 0.757 AAO + PSSM-AAO + PSSM-SD 0.851 0.222 0.913 0.935 0.874 PSSM-S 0.862 0.389 0.923 0.911 0.882 (Specificity) AAO 0.917 0.992 0.829 0.878 0.875 PSSM-AAO 0.934 0.990 0.829 0.885 0.883 PSSM-SD 0.940 0.990 0.873 0.928 0.912 PSSM-SAC 0.940 0.986 0.867 0.885 0.899 AAO + PSSM-AAO 0.943 0.992 0.825 0.880 0.883 AAO + PSSM-AAO + PSSM-SD 0.968 0.998 0.911 0.935 0.939 PSSM-S 0.966 0.992 0.914 0.953 0.943 (MCC) AAO 0.566 0.252 0.705 0.604 0.620 PSSM-AAO 0.622 0.298 0.733 0.583 0.646 PSSM-SD 0.751 0.233 0.728 0.777 0.730 PSSM-SAC 0.705 0.265 0.751 0.590 0.681 AAO + PSSM-AAO 0.608 0.318 0.734 0.614 0.650 AAO + PSSM-AAO + PSSM-SD 0.839 0.413 0.819 0.831 0.814 PSSM-S 0.843 0.484 0.831 0.845 0.826
Fewer number of proteins in these two locations (12 samples in the Flagel-lum, and 8 samples in the Nucleoid) compared to the number of samples in other locations (557 samples in the Cell inner membrane, and 410 samples in the Cytoplasm) makes this benchmark, inconsistent [91]. This reduces the prediction accuracy for locations with fewer samples as the SVM classifier weights these classes lower. Dissimilar to the Cell inner membrane and Cy-toplasm, the performance for the Fimbrium location is much better, despite relatively smaller number of samples in this location (32 samples) compared to the number of samples in the Cell inner membrane location (557 samples).
Table 4: The sensitivity, specificity and MCC measurements for our proposed feature groups and their combination to build PSSM-S for Gram-negative bacterial proteins bench-mark ((1) Cell inner membrane, (2) Cell outer membrane, (3) Cytoplasm, (4) Extracellular, (5) Fimbrium, (6) Flagellum, (7) Nucleoid, (8) Periplasm)
Subcellular Locations
Feature Vector (1) (2) (3) (4) (5) (6) (7) (8) Overall
(Sensitivity) AAO 0.835 0.565 0.834 0.406 0.625 0 0 0.506 0.717 PSSM-AAO 0.840 0.540 0.861 0.481 0.656 0 0 0.550 0.736 PSSM-SD 0.873 0.508 0.885 0.451 0.625 0 0 0.583 0.753 PSSM-SAC 0.858 0.524 0.890 0.459 0.656 0 0 0.622 0.757 AAO + PSSM-AAO 0.846 0.516 0.859 0.496 0.719 0 0 0.600 0.745 AAO + PSSM-AAO + PSSM-SD 0.894 0.540 0.883 0.519 0.656 0.083 0 0.672 0.782 PSSM-S 0.910 0.581 0.890 0.549 0.750 0.167 0 0.678 0.800 (Specificity) AAO 0.895 0.979 0.840 0.960 0.995 0.994 0.998 0.958 0.904 PSSM-AAO 0.932 0.971 0.867 0.955 0.989 0.997 0.997 0.951 0.924 PSSM-SD 0.951 0.977 0.877 0.953 0.993 0.992 0.996 0.948 0.9343 PSSM-SAC 0.942 0.982 0.865 0.957 0.995 0.993 0.997 0.954 0.929 AAO + PSSM-AAO 0.924 0.978 0.874 0.953 0.992 0.994 0.997 0.955 0.924 AAO + PSSM-AAO + PSSM-SD 0.958 0.977 0.908 0.957 0.992 0.994 0.997 0.945 0.945 PSSM-S 0.957 0.979 0.911 0.959 0.994 0.994 0.997 0.957 0.947 (MCC) AAO 0.723 0.605 0.636 0.404 0.679 - - 0.512 0.625 PSSM-AAO 0.780 0.552 0.692 0.450 0.610 - - 0.524 0.660 PSSM-SD 0.832 0.551 0.725 0.420 0.638 - - 0.544 0.687 PSSM-SAC 0.808 0.590 0.714 0.439 0.695 - - 0.589 0.688 AAO + PSSM-AAO 0.775 0.564 0.699 0.457 0.690 - - 0.574 0.669 AAO + PSSM-AAO + PSSM-SD 0.858 0.580 0.766 0.487 0.649 0.084 - 0.602 0.727 PSSM-S 0.870 0.618 0.776 0.519 0.733 0.176 - 0.639 0.748
This is because of the simplicity of predicting samples in this location which has also been shown in previous studies [5, 29, 41, 91]. As it is shown in Table 3 and Table 4, the specificity for all the locations for Gram-positive, and Gram-negative proteins is near one which emphasizes the ability of our method to detect negative samples.
5.4. Comparison with previous studies
To be able to directly compare our results with the best results reported for these two benchmarks, we also produce our results using 10-fold and 5-fold
cross validations [25, 41]. In 10-fold cross validation method, the input data set is randomly divided into 10 subsets (5 subsets for 5-fold cross validation). For each iteration, the combination of 9 subsets (4 subsets for 5-fold cross validation) is used as the training set and the remaining subset is used as the testing set. This process is repeated 10 time (5 times for 5-fold cross validation) until all the subsets are used once and only once as the testing set. As it was discusses earlier in Subsection 4.1, Jackknife cross validation is considered as the most effective evaluation method. However, due to its computational expense (performing n - 1 times for a benchmark consisting of n samples), some studies have used 10-fold or 5-fold cross validations criteria as an alternative evaluation method (performing 10 times instead of
n−1 times) [25, 41, 90, 92]. To the best of our knowledge, the best results achieved for Gram-positive and Gram-negative subcellular localizations using similar experiment have been achieved by [25] and [41], respectively. In [25], they used 5-fold cross validation evaluation criterion while in [41], they used 10-fold cross validation criterion. Therefore, in this study, to provide more consistent results, we use Jackknife cross validation to report our results and also use 10-fold and 5-fold cross validations for direct comparison of our results with the previously reported results for these two benchmarks.
Using SVM for PSSM-S with using 10-fold cross validation evaluation method, we achieve 87.7% and 79.6% overall prediction accuracies for Gram-positive and Gram-negative subcellular localization benchmarks, respectively. These are slightly lower than 88.2% and 88.0% overall prediction accura-cies using Jackknife cross validation for these two benchmarks. To compare our results directly with [25] for the Gram-positive subcellular localization
benchmark, we use 5-fold cross validation evaluation method and report the results. Using 5-fold cross validation, we achieve 86.9% prediction accu-racy which is 3.2% better than 83.7% prediction accuaccu-racy that was reported in [25]. Similarly, to compare our results directly with [41] for the Gram-negative subcellular localization benchmark, we use 10-fold cross validation evaluation method and report the results. Using 10-fold cross validation, we achieve 79.6% prediction accuracy which is 6.4% better than 73.2% predic-tion accuracy that was reported in [41]. These results are achieved by using only 220 features in total. Note that these enhancements achieved by using evolutionary-based features extracted from PSSM compared to the results reported using features extracted from GO [19, 21, 41, 90]. It highlights the importance of our method to explore potential discriminatory informa-tion embedded in PSSM and introduce reliable features to tackle the protein subcellular localization prediction problem.
Table 5: Comparison of our achieved results (%) with the similar studies found in the literature. For Gram-positive and Gram-negative subcellular localizations, the results using 5-fold and 10-fold cross validations are used (in column two and three), respectively.
Study Gram-positive benchmark Gram-negative benchmark
[25] 83.7
-[41] - 73.2
PSSM-S 86.9 79.6
6. Conclusion and Future Works
In this study, we have proposed a novel technique to explore potential discriminatory information embedded in PSSM to tackle Gram-positive and Gram-negative subcellular localizations. To do this, we first extracted PSSM
matrix for the employed benchmarks and extract two occurrence-based fea-tures and two segmentation-based feature groups namely, Consensus-based Occurrence (AAO), Semi-occurrence (PSSM-AAO), Segmented Distribution (PSSM-SD) and Segmented Auto Covariance (PSSM-SAC). We then tuned the distribution parameters (distribution Fp and distance factorsKp) by
ap-plying SVM to the combination of these four feature groups (called PSSM-S) and investigated different values for these two parameters. Finally, by using SVM to our extracted feature groups we showed the importance of all these feature groups to explore potential discriminatory information embedded in PSSM. We reported 88.2% and 80.0% prediction accuracies for Gram-positive and Gram-negative subcellular localizations using just 220 features in total. Reported results in this study are 3.2% and 6.4% better than previously reported results for Gram-positive, and Gram-negative bacterial proteins benchmarks which also used GO for feature extraction [25, 41]. These en-hancements highlight the effectiveness of our method to explore potential discriminatory information embedded in PSSM for protein subcellular local-izations and produce effective, and reliable features for this task.
For our future work, we aim at investigating the impact of segmentation-based feature extraction technique to explore other sources for feature ex-tractions such as structural, and physicochemical-based information. Since user-friendly and publicly accessible web-servers represent the future direc-tion for developing practically more useful models, simulated methods, or predictors [93, 78], we shall make efforts in our future work to provide a web-server for the method presented in this paper.
7. Acknowledgements
We would like to thank Professor Kuo-Chen Chou for sharing Gram-positive and Gram-negative protein subcellular localizations benchmarks which are introduced in Cell-PLoc 2.0package available at: http://www.csbio. sjtu.edu.cn/bioinf/Cell-PLoc-2/.
References
[1] K. C. Chou, Some remarks on predicting multi-label attributes in fmolecular biosystems, Molecular BioSystems 9 (6) (2013) 1092–1100. [2] O. Emanuelsson, H. Nielsen, S. Brunak, G. V. Heijne, Predicting
sub-cellular localization of proteins based on their n-terminal amino acid sequence, Journal of molecular biology 300 (4) (2000) 1005–1016. [3] K. C. Chou, D. W. Elrod, Protein subcellular location prediction,
Pro-tein engineering 12 (2) (1999) 107–118.
[4] K. C. Chou, H. B. Shen, Recent progress in protein subcellular location prediction, Analytical biochemistry 370 (1) (2007) 1–16.
[5] X. Xiao, Z. C. Wu, K. C. Chou, A multi-label classifier for predicting the subcellular localization of gram-negative bacterial proteins with both single and multiple sites, PLoS One 6 (6) (2011) e20592.
[6] J. L. Gardy, F. S. L. Brinkman, Methods for predicting bacterial protein subcellular localization, Nature Reviews Microbiology 4 (1) (2006) 741– 751.
[7] K. Nakai, M. Kanehisa, Expert system for predicting protein localiza-tion sites in gram-negative bacteria, Proteins: Structure, Funclocaliza-tion, and Bioinformatics 11 (2) (1991) 95–110.
[8] K. Nakai, M. Kanehisa, A knowledge base for predicting protein local-ization sites in eukaryotic cells, Genomics 14 (4) (1992) 897–911. [9] H. Nakashima, K. Nishikawa, Discrimination of intracellular and
extra-cellular proteins using amino acid composition and residue-pair frequen-cies, Journal of molecular biology 238 (1) (1994) 54–61.
[10] S. Mei, Predicting plant protein subcellular multi-localization by chou’s pseaac formulation based multi-label homolog knowledge transfer learn-ing, Journal of theoretical biology 310 (2012) 80–87.
[11] J. Li, L. Xiong, J. Schneider, R. F. Murphy, Protein subcellular loca-tion pattern classificaloca-tion in cellular images using latent discriminative models, Bioinformatics 28 (12) (2012) i32–i39.
[12] Y. Hu, T. Li, J. Sun, S. Tang, W. Xiong, D. Li, G. Chen, P. Cong, Predicting gram-positive bacterial protein subcellular localization based on localization motifs, Journal of theoretical biology 308 (2012) 135–140. [13] A. Sharma, K. K. Paliwal, A. Dehzangi, J. Lyons, S. Imoto, S. Miyano, A strategy to select suitable physicochemical attributes of amino acids for protein fold recognition, BMC Bioinformatics 14 (233) (2013) 11. [14] E. Tantoso, K. B. Li, Aaindexloc: predicting subcellular localization of
proteins based on a new representation of sequences using amino acid indices, Amino Acids 35 (2) (2008) 345–353.
[15] G. L. Fan, Q. Z. Li, Predict mycobacterial proteins subcellular locations by incorporating pseudo-average chemical shift into the general form of chous pseudo amino acid composition, Journal of Theoretical Biology 304 (2012) 88–95.
[16] K. C. Chou, H. B. Shen, Hum-ploc: a novel ensemble classifier for predicting human protein subcellular localization, Biochemical and bio-physical research communications 347 (1) (2006) 150–157.
[17] K. C. Chou, H. B. Shen, Cell-ploc 2.0: An improved package of web-servers for predicting subcellular localization of proteins in various or-ganisms., Engineering 2 (10).
[18] K. C. Chou, H. B. Shen, Cell-ploc: a package of web servers for pre-dicting subcellular localization of proteins in various organisms, Nature protocols 3 (2) (2008) 153–162.
[19] S. Wan, M.-W. Mak, S.-Y. Kung, Goasvm: A subcellular location pre-dictor by incorporating term-frequency gene ontology into the general form of chou’s pseudo-amino acid composition, Journal of theoretical biology 323 (2013) 40–48.
[20] K. C. Chou, Y. D. Cai, Using functional domain composition and sup-port vector machines for prediction of protein subcellular location, Jour-nal of biological chemistry 277 (48) (2002) 45765–45769.
[21] L. Yu, J. Luo, Y. Guo, Y. Li, X. Pu, M. Li, In silico identification of gram-negative bacterial secreted proteins from primary sequence, Com-puters in biology and medicine 43 (9) (2013) 1177–1181.
[22] L. Nanni, A. Lumini, S. Brahnam, An empirical study on the matrix-based protein representations and their combination with sequence-based approaches, Amino Acid Journal 44 (3) (2013) 887–901.
[23] L. Nanni, S. Brahnam, S. Ghidoni, E. Menegatti, T. Barrier, A com-parison of methods for extracting information from the co-occurrence matrix for subcellular classification, Expert systems with applications 40 (18) (2013) 7457–7467.
[24] H. B. Shen, K. C. Chou, Gpos-ploc: an ensemble classifier for predict-ing subcellular localization of gram-positive bacterial proteins, Protein Engineering Design and Selection 20 (1) (2007) 39–46.
[25] C. Huang, J. Yuan, Using radial basis function on the general form of chou’s pseudo amino acid composition and pssm to predict subcellular locations of proteins with both single and multiple sites, Biosystems 113 (1) (2013) 50–57.
[26] A. Pierleoni, P. L. Martelli, R. Casadio, Memloci: predicting subcellular localization of membrane proteins in eukaryotes, Bioinformatics 27 (9) (2011) 1224–1230.
[27] P. Du, Y. Yu, Submito-pspcp: Predicting protein submitochondrial loca-tions by hybridizing positional specific physicochemical properties with pseudoamino acid compositions, BioMed research international 2013. [28] S. Matsuda, J. P. Vert, H. Saigo, N. Ueda, H. Toh, T. Akutsu, A novel
using support vector machines, Protein Science 14 (11) (2005) 2804– 2813.
[29] H. B. Shen, K. C. Chou, Gneg-mploc: a top-down strategy to enhance the quality of predicting subcellular localization of gram-negative bac-terial proteins, Journal of Theoretical Biology 264 (2) (2010) 326–333. [30] W. Chen, P. M. Feng, H. Lin, K. C. Chou, irspot-psednc: identify
re-combination spots with pseudo dinucleotide composition, Nucleic Acids Research 41 (6) (2013) e68–e68.
[31] W. Chen, H. Lin, P. M. Feng, C. Ding, Y. C. Zuo, K. C. Chou, inuc-physchem: a sequence-based predictor for identifying nucleosomes via physicochemical properties, PLoS One 7 (10) (2012) e47843.
[32] K. C. Chou, C. Z. Wu, X. Xiao, iloc-hum: using the accumulation-label scale to predict subcellular locations of human proteins with both single and multiple sites, Molecular Biosystems 8 (2) (2012) 629–641.
[33] M. Ashburner, C. A. Ball, J. A. Blake, D. Botstein, H. Butler, J. M. Cherry, A. P. Davis, K. Dolinski, S. S. Dwight, J. T. Eppig, et al., Gene ontology: tool for the unification of biology, Nature genetics 25 (1) (2000) 25–29.
[34] S. Matsuda, J. P. Vert, H. Saigo, N. Ueda, H. Toh, T. Akutsu, A novel representation of protein sequences for prediction of subcellular location using support vector machines, Protein Science 14 (11) (2005) 2804– 2813.
[35] S. W. Zhang, Y. F. Liu, Y. Yu, T. H. Zhang, X. N. Fan, Msloc-dt: A new method for predicting the protein subcellular location of multispecies based on decision templates, Analytical biochemistry.
[36] M. Tahir, A. Khan, H. Kaya, Protein subcellular localization in human and hamster cell lines: Employing local ternary patterns of fluorescence microscopy images, Journal of theoretical biology 340 (2014) 85–95. [37] K. C. Chou, H. B. Shen, Memtype-2l: a web server for predicting
mem-brane proteins and their types by incorporating evolution information through pse-pssm, Biochemical and biophysical research communica-tions 360 (2) (2007) 339–345.
[38] L. Nanni, A. Lumini, D. Gupta, A. Garg, Identifying bacterial virulent proteins by fusing a set of classifiers based on variants of chou’s pseudo amino acid composition and on evolutionary information, IEEE/ACM Transactions on Computational Biology and Bioinformatics (TCBB) 9 (2) (2012) 467–475.
[39] C. Sun, X. M. Zhao, W. Tang, L. Chen, Fgsub: Fusarium gramin-earum protein subcellular localizations predicted from primary struc-tures, BMC systems biology 4 (Suppl 2) (2010) S12.
[40] A. Dehzangi, J. Lyons, A. Sharma, K. K. Paliwal, A. Sattar, A segmentation-based method to extract structural and evolutionary fea-tures for protein fold recognition, IEEE/ACM Transactions on Compu-tational Biology and Bioinformatics PP (99) (2014) 1–11.
[41] E. Pacharawongsakda, T. Theeramunkong, Predict subcellular locations of singleplex and multiplex proteins by semi-supervised learning and dimension-reducing general mode of chou’s pseaac., IEEE transactions on nanobioscience 12 (4) (2013) 311–320.
[42] K. C. Chou, Z. C. Wu, X. Xiao, iloc-euk: a multi-label classifier for predicting the subcellular localization of singleplex and multiplex eu-karyotic proteins, PLoS One 6 (3) (2011) e18258.
[43] W. Z. Lin, J. A. Fang, X. Xiao, K. C. Chou, iloc-animal: a multi-label learning classifier for predicting subcellular localization of animal proteins, Molecular BioSystems 9 (4) (2013) 634–644.
[44] Z. C. Wu, X. Xiao, K. C. Chou, iloc-plant: a multi-label classifier for predicting the subcellular localization of plant proteins with both single and multiple sites, Molecular BioSystems 7 (12) (2011) 3287–3297. [45] S. Tang, T. Li, P. Cong, W. Xiong, Z. Wang, J. Sun, Plantloc: an
accurate web server for predicting plant protein subcellular localization by substantiality motif, Nucleic acids research 41 (W1) (2013) W441– W447.
[46] w. Chen, P. M. Feng, H. Lin, K. C. Chou, irspot-psednc: identify re-combination spots with pseudo dinucleotide composition, Nucleic Acids Research (2013) gks1450.
[47] Y. N. Fan, X. Xiao, J. L. Min, K. C. Chou, inr-drug: predicting the interaction of drugs with nuclear receptors in cellular networking, Inter-national journal of molecular sciences 15 (3) (2014) 4915–4937.
[48] S. H. Guo, E. Z. Deng, L. Q. Xu, H. Ding, H. Lin, W. Chen, K. C. Chou, inuc-pseknc: a sequence-based predictor for predicting nucleosome posi-tioning in genomes with pseudo k-tuple nucleotide composition, Bioin-formatics (2014) btu083.
[49] B. Liu, D. Zhang, R. Xu, J. Xu, X. Wang, Q. Chen, Q. Dong, K. C. Chou, Combining evolutionary information extracted from frequency profiles with sequence-based kernels for protein remote homology detec-tion, Bioinformatics 30 (4) (2014) 472–479.
[50] W. R. Qiu, X. Xiao, W. Z. Lin, K. C. Chou, imethyl-pseaac: Identifica-tion of protein methylaIdentifica-tion sites via a pseudo amino acid composiIdentifica-tion approach, BioMed Research International 2014.
[51] W. R. Qiu, X. Xiao, K. C. Chou, irspot-tncpseaac: Identify recom-bination spots with trinucleotide composition and pseudo amino acid components, International journal of molecular sciences 15 (2) (2014) 1746–1766.
[52] W. Chen, P. M. Feng, H. Lin, K. C. Chou, iss-psednc: Identifying splic-ing sites ussplic-ing pseudo dinucleotide composition, BioMed Research In-ternational 2014.
[53] H. Ding, E. Z. Deng, L. F. Yuan, L. Liu, H. Lin, W. Chen, K. C. Chou, ictx-type: A sequence-based predictor for identifying the types of conotoxins in targeting ion channels, BioMed Research International 2014.
[54] Y. Xu, X. Wen, X. J. Shao, N. Y. Deng, K. C. Chou, ihyd-pseaac: pre-dicting hydroxyproline and hydroxylysine in proteins by incorporating dipeptide position-specific propensity into pseudo amino acid composi-tion, International journal of molecular sciences 15 (5) (2014) 7594–7610. [55] K. C. Chou, Some remarks on protein attribute prediction and pseudo amino acid composition, Journal of Theoretical Biology 273 (1) (2011) 236–247.
[56] A. Dehzangi, K. K. Paliwal, J. Lyons, A. Sharma, A. Sattar, Enhancing protein fold prediction accuracy using evolutionary and structural fea-tures, in: Proceeding of the Eighth IAPR International Conference on Pattern Recognition in Bioinformatics, PRIB, 2013, pp. 196–207. [57] A. Dehzangi, K. K. Paliwal, J. Lyons, A. Sharma, A. Sattar, Exploring
potential discriminatory information embedded in pssm to enhance pro-tein structural class prediction accuracy, in: Proceeding of the Eighth IAPR International Conference on Pattern Recognition in Bioinformat-ics, PRIB, 2013, pp. 208–219.
[58] A. Dehzangi, K. K. Paliwal, J. Lyons, A. Sharma, A. Sattar, Proposing a highly accurate protein structural class predictor using segmentation-based features, BMC Genomics 15 (Suppl 1) (2014) S2.
[59] Y. H. Taguchi, M. M. Gromiha, Application of amino acid occurrence for discriminating different folding types of globular proteins, BMC Bioin-formatics 8 (1) (2007) 404.
[60] K. C. Chou, S. B. Shen, Large-scale predictions of gram-negative bacte-rial protein subcellular locations, Journal of Proteome Research 5 (12) (2006) 3420–3428.
[61] S. F. Altschul, T. L. Madden, A. A. Schaffer, J. H. Zhang, Z. Zhang, W. Miller, D. J. Lipman, Gapped blast and psi-blast: a new generation of protein database search programs, Nucleic Acids Research 17 (1997) 3389–3402.
[62] Y. Xu, X. J. Shao, L. Y. Wu, N. Y. Deng, K. C. Chou, isno-aapair: incorporating amino acid pairwise coupling into pseaac for predicting cysteine s-nitrosylation sites in proteins, PeerJ 1 (2013) e171.
[63] A. Dehzangi, K. K. Paliwal, A. Sharma, O. Dehzangi, A. Sattar, A combination of feature extraction methods with an ensemble of different classifiers for protein structural class prediction problem, IEEE Trans-action on Computational Biology and Bioinformatics (TCBB) 10 (3) (2013) 564–575.
[64] A. Sharma, J. Lyons, A. Dehzangi, K. K. Paliwal, A feature extraction technique using bi-gram probabilities of position specific scoring ma-trix for protein fold recognition, Journal of Theoretical Biology 320 (0) (2013) 41–46.
[65] A. Dehzangi, K. K. Paliwal, A. Sharma, J. Lyons, A. Sattar, Protein fold recognition using an overlapping segmentation approach and a mix-ture of feamix-ture extraction models, in: AI 2013: Advances in Artificial Intelligence, Springer, 2013, pp. 32–43.
[66] A. Dehzangi, S. Phon-Amnuaisuk, Fold prediction problem: The appli-cation of new physical and physicochemical- based features, Protein and Peptide Letters 18 (2) (2011) 174–185.
[67] K. C. Chou, Prediction of protein structural classes and subcellular lo-cations, Current Protein and Peptide Science 1 (2000) 171–208.
[68] K. K. Paliwal, A. Sharma, J. Lyons, A. Dehzangi, A tri-gram based feature extraction technique using linear probabilities of position spe-cific scoring matrix for protein fold recognition, NanoBioscience, IEEE Transactions on 13 (1) (2014) 44–50.
[69] A. Dehzangi, A. Sattar, Ensemble of diversely trained support vec-tor machines for protein fold recognition, in: Proceedings of the 5th Asian Conference on Intelligent Information and Database Systems, ACIIDS05, Springer-Verlag, 2013, pp. 335–344.
[70] A. Dehzangi, A. Sattar, Protein fold recognition using segmentation-based feature extraction model, in: Proceedings of the 5th Asian Con-ference on Intelligent Information and Database Systems, ACIIDS05, Springer-Verlag, 2013, pp. 345–354.
[71] M. Esmaeili, H. Mohabatkar, S. Mohsenzadeh, Using the concept of chou’s pseudo amino acid composition for risk type prediction of human papillomaviruses, Journal of theoretical biology 263 (2) (2010) 203–209. [72] K. C. Chou, Prediction of protein cellular attributes using pseudo amino acid composition, Proteins Structure, Function, and Bioinformatics 43 (2001) 246–255.
[73] K. C. Chou, Using amphiphilic pseudo amino acid composition to pre-dict enzyme subfamily classes, Bioinformatics 21 (1) (2005) 10–19. [74] Y. Xu, J. W. Ding, Y. Ling, K. C. Chou, isno-pseaac: predict cysteine
s-nitrosylation sites in proteins by incorporating position specific amino acid propensity into pseudo amino acid composition, PLoS One 8 (2) (2013) e55844.
[75] P. Du, S. Gu, Y. Jiao, Pseaac-general: Fast building various modes of general form of chous pseudo-amino acid composition for large-scale pro-tein datasets, International journal of molecular sciences 15 (3) (2014) 3495–3506.
[76] P. Du, X. Wang, C. Xu, Y. Gao, Pseaac-builder: A cross-platform stand-alone program for generating various special chous pseudo-amino acid compositions, Analytical biochemistry 425 (2) (2012) 117–119.
[77] D. S. Cao, Q. S. Xu, Y. Z. Liang, propy: a tool to generate various modes of chous pseaac, Bioinformatics 29 (7) (2013) 960–962.
[78] S. X. Lin, J. Lapointe, Theoretical and experimental biology in onea symposium in honour of professor kuo-chen chous 50th anniversary and professor richard gieg´es 40th anniversary of their scientific careers, Jour-nal of Biomedical Science and Engineering 6 (2013) 435.
[79] V. N. Vapnik, The Nature of Statistical Learning Theory, Springer-Verlag, 1999.
[80] Q. Dong, S. Zhou, G. Guan, A new taxonomy-based protein fold recog-nition approach based on autocross-covariance transformation, Bioinfor-matics 25 (20) (2009) 2655–2662.
[81] J. Y. Yang, X. Chen, Improving taxonomy-based protein fold recognition by using global and local features, Proteins: Structure, Function, and Bioinformatics 79 (7) (2011) 2053–2064.
[82] J. Lyon, A. Sharma, A. Dehzangi, K. K. Paliwal, Protein fold recogni-tion by alignment of amino acid residues using kernelized dynamic time warping, Journal of Theoretical Biology In Press.
[83] C. C. Chang, C. J. Lin, Libsvm: a library for support vector machines. [84] H. Mohabatkar, M. M. Beigi, A. Esmaeili, Prediction of gaba a receptor proteins using the concept of chou’s pseudo-amino acid composition and support vector machine, Journal of Theoretical Biology 281 (1) (2011) 18–23.
[85] H. Mohabatkar, M. M. Beigi, K. Abdolahi, S. Mohsenzadeh, Prediction of allergenic proteins by means of the concept of chou’s pseudo amino acid composition and a machine learning approach, Medicinal Chemistry 9 (1) (2013) 133–137.
[86] H. Lin, H. Ding, F. B. Guo, A. Y. Zhang, J. Huang, Predicting subcellu-lar localization of mycobacterial proteins by using chou’s pseudo amino acid composition, Protein and Peptide Letters 15 (7) (2008) 739–744. [87] H. B. Shen, K. C. Chou, Virus-mploc: a fusion classifier for viral protein
subcellular location prediction by incorporating multiple sites, Journal of Biomolecular Structure and Dynamics 28 (2) (2010) 175–186.
[88] Z. C. Wu, X. Xiao, K. C. Chou, iloc-gpos: A multi-layer classifier for predicting the subcellular localization of singleplex and multiplex gram-positive bacterial proteins, Protein and peptide letters 19 (1) (2012) 4–14.
[89] X. Xiao, Z. C. Wu, K. C. Chou, iloc-virus: A multi-label learning clas-sifier for identifying the subcellular localization of virus proteins with both single and multiple sites, Journal of Theoretical Biology 284 (1) (2011) 42–51.
[90] M. Marcin, P. Marcin, J. M. Bujnicki, Metalocgramn: a meta-predictor of protein subcellular localization for gram-negative bacteria, Biochimica et Biophysica Acta (BBA)-Proteins and Proteomics 1824 (12) (2012) 1425–1433.
[91] K. C. Chou, H. B. Shen, Plant-mploc: a top-down strategy to augment the power for predicting plant protein subcellular localization, PloS one 5 (6) (2010) e11335.
[92] T. Liu, X. Geng, X. Zheng, R. Li, J. Wang, Accurate prediction of protein structural class using auto covariance transformation of psi-blast profiles, Amino Acids 42 (2012) 2243–2249.
[93] K. C. Chou, H. B. Shen, Review: recent advances in developing web-servers for predicting protein attributes, Natural Science 1 (02) (2009) 63.