AUTOMATING VENDOR FRAUD DETECTION
IN ENTERPRISE SYSTEMS
Kishore Singh*
kishore.singh@griffith.edu.au
Peter Best
p.best@griffith.edu.au
Department of Accounting, Finance and Economics
Griffith University
Australia
Joseph Mula
School of Commerce
University of Southern Queensland
Australia
joseph.mula@usq.edu.au
* Corresponding authorABSTRACT
Fraud is a multi-billion dollar industry that continues to grow annually. Many organizations are poorly prepared to prevent and detect fraud. Fraud detection strategies are intended to quickly and efficiently identify fraudulent activities that circumvent preventative measures. In this paper, we adopt a Design-Science methodological framework to develop a model for detection of vendor fraud based on analysis of patterns or signatures identified in enterprise system audit trails. The concept is demonstrated by developing prototype software. Verification of the prototype is achieved by performing a series of experiments. Validation is achieved by independent reviews from auditing practitioners. Key findings of this study are: (a) automating routine data analytics improves auditor productivity and reduces time taken to identify potential fraud; and (b) visualizations assist in promptly identifying potentially fraudulent user activities. The study makes the following contributions: (a) a model for proactive fraud detection; (b) methods for visualizing user activities in transaction data; and (c) a stand-alone Monitoring and Control Layer (MCL) based prototype.
1. INTRODUCTION
According to the Association of Certified Fraud Examiners (ACFE) Report to the Nations on Occupational Fraud & Abuse, "a typical organization loses five percent of its annual revenue to fraud. Applied to the estimated 2011 Gross World Product of $70.28 trillion, this figure translates to a potential total fraud loss of more than $3.5 trillion" (ACFE, 2012, p. 8). These figures are clear evidence that fraud is a major problem, which requires serious study by researchers to minimize illegal activities.
There are two principal methods of getting something from others illegally. They can either be physically forced, or they can be deceived into giving up their assets. The first type is called robbery and the second is fraud. Albrecht et al. (2009) defines fraud as a deception made for personal gain. Deception is key. The most common definition of fraud according to Webster's Dictionary (2001, p. 380) is:
Fraud is a generic term that embraces all the multifarious means which human ingenuity can devise, which are resorted to by one individual, to get an advantage over another by false representations. No definite and invariable rule can be laid down as a general proposition in defining fraud, as it includes surprise, trickery, cunning and unfair ways by which another is cheated. The only boundaries defining it are those which limit human knavery.
The ACFE (2010, p. 6) defines occupational fraud as:
…the use of one's occupation for personal enrichment through the deliberate misuse or misapplication of the employing organization's resources or assets…
Occupational fraud is very broad and it encompasses a range of transgressions by employees at all levels of an organisational hierarchy. These include: (a) asset misappropriations, which involve theft or misuse of an organisation's assets; (b) corruption, in which employees wrongfully use their influence in business transactions to gain some benefit for themselves or another person, contrary to their duty to their employer; and (c) fraudulent statements, which usually involve falsification of an organisation's financial statements.
Fraud can be committed by anyone. Perpetrators cannot usually be distinguished from other people on the basis of demographic or psychological factors. Individuals involved in fraud are regular people that have compromised their integrity and become involved in fraud (Cressey, 1953). Several theories exist in the literature as to why individuals commit frauds. A common theme in each of the theories is one of conflict of interest. If this situation arises between the owner(s) and employees, it may lead to
dissatisfaction among employees. Affected employees may seek relief by resorting to fraudulent behaviour when an opportunity presents itself (Fama and Jensen, 1983; Jensen and Meckling, 1976).
Owners incur costs in order to monitor opportunistic behaviour of employees. By implementing an accounting system, owners are able to leverage an essential in-built business function of providing adequate controls to safe guard organisational assets. An accounting system provides a means of implementing and improving the internal control structure of an organisation. An effective accounting system provides an audit trail that allows frauds to be discovered and makes concealment difficult. Potential fraud can be discovered in accounting records by examining transactions that are anomalous or appear otherwise unreasonable (Albrecht et al., 2009; Romney and Steinbart, 2009). With advances in information technology and emergence of electronic business, modern enterprise systems may record millions of transactions annually. An auditor may extract a small sample of these during a financial audit. Suppose a fraudster perpetrates only a few frauds annually, it is plausible that none of them may be discovered by the financial audit. Many fraudsters rely on this to conceal fraud. Thus, while opportunities to commit fraud continue to increase, it appears that insufficient resources are being deployed to improve detection using internal controls (Figure 1).
Figure 1 Fraud Detection Methods (ACFE, 2010)
Implementing a well-designed internal control policy enables an organization to reduce opportunities for employees to commit occupational fraud. Further reduction in fraud may be achieved by introducing proactive fraud detection
monitor and analyze business processes at an "unprecedented level of detail" (Alles, et al., 2006, p. 138).
This study adopts a Design-Science methodological framework (Hevner et al., 2004) to answer the key research question: Can a generalised model for proactive detection of vendor fraud in enterprise systems be developed? The remainder of this paper is organised as follows: scope of the study; methodology used; conceptual model; development of a framework for fraud detection; approaches for continuous monitoring and fraud detection; research propositions; level of support enterprise systems provide for fraud detection; design and development of automated fraud detection strategies; validation of prototype; and discussion of some limitations and future research.
2. SCOPE OF THE STUDY
When considering an automated solution for proactive fraud detection, the focus has to be on questions that can be answered with the aid of computerised tools (Lanza, 2007). Some questions are too subjective, for example, Are the vendor's goods or services of good quality? Any effort to develop an automated solution will require evidence that is documented in an enterprise system's audit trails and that can be investigated using data analytics tools. Transactions that occur outside an enterprise system cannot be investigated using this methodology.
The ACFE (2010) classifies occupational fraud into three broad categories; asset misappropriation, corruption and fraudulent statements. Asset misappropriation is the most common category of fraud perpetrated by non-management employees, occurring in more than 86% of all cases (Table 1). The median loss from asset misappropriation was $135,000. (Note: the sum of percentages in Table 1 exceeds 100% because several cases involved schemes from more than one category).
Table 1 Categories of Occupational Fraud and Abuse (ACFE, 2010) Category % of all Cases Median Loss Asset Misappropriation 86.3% $135,000
Corruption 32.8% $250,000
Fraudulent Statements 4.8% $4,100,000
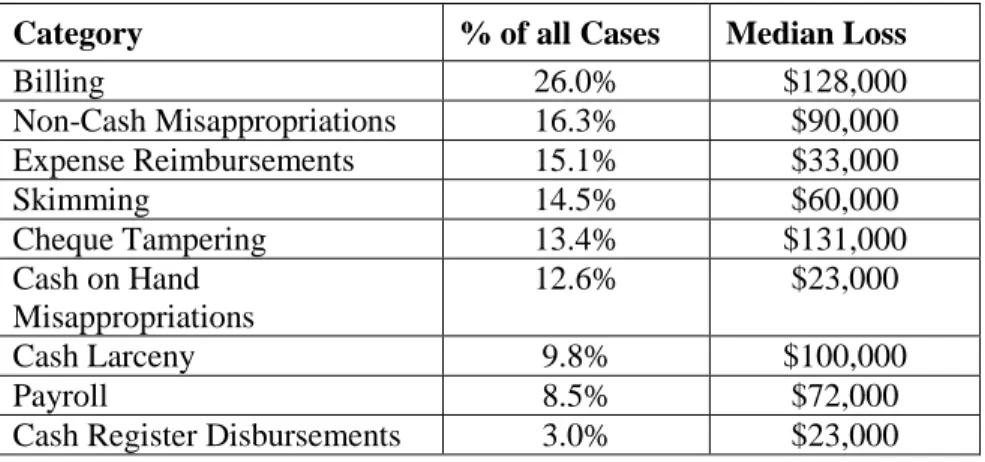
Asset misappropriation schemes involve theft of cash and non-cash assets. Cash assets are more frequently targeted than non-cash assets. Billing schemes was the most common method used to misappropriate cash assets (26%) having a median loss of $128,000 (Table 2).
Table 2 Sub-Categories of Asset Misappropriation (ACFE, 2010)
Category % of all Cases Median Loss
Billing 26.0% $128,000 Non-Cash Misappropriations 16.3% $90,000 Expense Reimbursements 15.1% $33,000 Skimming 14.5% $60,000 Cheque Tampering 13.4% $131,000 Cash on Hand Misappropriations 12.6% $23,000 Cash Larceny 9.8% $100,000 Payroll 8.5% $72,000
Cash Register Disbursements 3.0% $23,000
Large scale implementations of enterprise systems have resulted in many organisations being highly automated and fully integrated. The development of this enterprise system environment provides the necessary infrastructure for the effective evolution of the auditing function from a periodic event to an ongoing process through the use of computer-based technology. Enterprise systems software are available from several vendors, including SAP, Oracle and Microsoft, and collectively has 71% of market share world-wide. For several years, however, Germany-based enterprise software company SAP has consistently been the market leader (Lager and Tsai, 2008; SAP, 2010). In 2010, Gartner (2010) recognised SAP as the leading vendor of enterprise systems software accounting for 22% of the market. Many organisations have realised that SAP solutions are important to their success. Several Fortune 500 companies, including IBM, Toyota, Apple, Coca-Cola, and Google use SAP exclusively for their core day to day operations including accounting and financial applications, procurement, order processing and supplier management, inventory management, and HR management and payroll functions (BOS, 2009; CMU 2011; Gartner, 2010). The prototype developed in this research exploits SAP audit trails for proactive detection of vendor fraud schemes.
The scope of this study is therefore limited to detection of vendor fraud schemes involving shell companies and non-accomplice vendors in an SAP enterprise system using prototype software developed for this purpose. The study makes no claims to be able to identify any 'actual' fraudulent activities but is limited to extracting data that provide symptomatic evidence that fraudulent activities might have occurred. Throughout this study the term fraud, fraud detection, or fraud detection tool means potential fraud not actual fraud. In the next section, we discuss the methodology adopted by this study.
3. METHODOLOGY
This study adopts Hevner et al. (2004) Design-Science methodological framework. The framework requires creation of an innovative, purposeful artefact (guideline 1) for a specified problem domain (guideline 2). Evaluation of the artefact is crucial (guideline 3). The artefact must be innovative (guideline 4) and rigorously designed and evaluated (guideline 5). It must enact an effective solution to a problem space (guideline 6) and results of the research must be presented effectively to both technology- and management-oriented audiences (guideline 7). This study adopts the following methodology:
1. Literature review – to recognise theories and concepts that underpin this study (guidelines 1, and 2).
2. Create a catalogue of fraud symptoms (guidelines 1, 2, and 4).
3. Identify data requirements to detect fraud in an SAP Enterprise System (guidelines 2, 3, 4, and 6).
4. Design, develop, and implement prototype software (guidelines 1, 2, 4, and 5).
5. Perform experiments to verify program functionality of the prototype (guidelines 3, 6, and 7).
6. Seek support from experts for validation of the prototype (guideline 7). The primary objective of this study is to explore and develop innovative methods for proactively detecting vendor fraud in enterprise systems. The intention is to build a model for detection of vendor fraud based on analysis of patterns or signatures. This study adopts a methodology for proactive fraud detection that exploits audit trails in enterprise systems. The concept is demonstrated by developing a prototype. The aim of the prototype is to confirm the feasibility of implementing proactive vendor detection in practice. The prototype is a software application that analyses transaction data from an SAP enterprise system for indicators of vendor fraud. Reports and visualisations highlighting anomalous activities are produced. Further investigation of these findings may be initiated at the discretion of an auditor. A conceptual model for the study is developed in the next section.
4. CONCEPTUAL MODEL
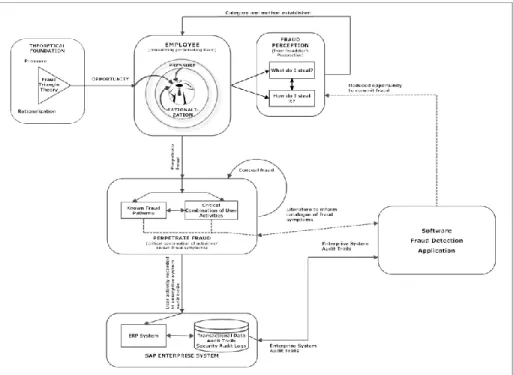
The conceptual model for this study (Figure 2) incorporates Albrecht et al.’s (2009) essential steps in detecting fraudulent activities:
understanding the business or operations.
performing a risk analysis to identify the types of frauds that can occur.
cataloguing the symptoms that the most likely frauds would generate.
using computer technology to identify fraud symptoms.
analysing the results.
Figure 2 Conceptual Fraud Model
The model represents the fundamental nature of fraud and its detection. Firstly, the model incorporates factors that motivate an individual to perpetrate fraud. It identifies mental states that fraudsters experience prior to perpetrating frauds. A fraudster may mentally enact several fraud scenarios until a suitable one is found. Once a fraudster determines what to steal, the next decision is how to steal it. A fraudster has to determine a specific method of perpetrating fraud. The chosen method may entail a series of steps taken to achieve the desired outcome of perpetrating a fraud and concealing it to avoid detection. The key concept identified in this part is opportunity. Secondly, the model focuses on detection of vendor fraud in an organisation. This is achieved by:
Creation of a catalogue of fraud symptoms.
Translation of fraud symptoms into detection strategies that can be implemented in a prototype.
Design and development of a prototype.
Experiments performed with enterprise system data.
The conceptual model provides an understanding of the nature of fraud symptoms and its detection in enterprise systems. Fraud is a complex social condition that evolves from underlying factors such as dissatisfaction or despair. The eventual outcome is that an individual is motivated to
misappropriate assets that belong to an organisation. In the next section, we develop a framework for detecting fraud.
5. FRAMEWORK FOR DETECTING FRAUD
Perpetration of vendor fraud may require the creation of a shell company and the submission of fictitious invoices to an organisation for payment (Best et al., 2009; O'Gara, 2004; Wells, 2002a). To successfully perpetrate this type of fraud, the fraudster needs to access to the following enterprise system elements (Best et al., 2009; Narayan, 2008; Padhi, 2010):
Creation or modification of vendor master records.
Invoice entry sub-system.
Vendor master records can be created or modified in the following ways (Best, 2008; O'Gara, 2004; Singleton et al., 2008):
Create a fake vendor.
Temporarily modify an existing vendor (flipping).
Permanently modify an existing vendor.
Use a one-time account.
Invoices can be entered in an enterprise system in the following ways (Best, 2005; Singleton et al., 2008):
Create a fake invoice.
Use a legitimate invoice.
Create or use a duplicate invoice.
Key components of the framework for vendor fraud detection include defining data requirements for fraud detection; and creating a catalogue of fraud symptoms. The catalogue of fraud symptoms comprises critical combinations of user activities and known vendor fraud symptoms.
5.1 Critical Combinations
Many frauds occur because fraudsters exploit the lack of internal controls or they may override existing internal controls that are poorly implemented. For example, an employee that creates or modifies a vendor master record should not be able to enter an invoice. Having this capability does not indicate that a fraud has taken place, but it does create an opportunity for fraud to be perpetrated. By detecting these critical combinations of user activities:
an auditor can further investigate transactions that match known fraud symptoms, or appear otherwise anomalous, and
an organisation can take steps to correct the situation thereby reducing the probability of future fraud.
The concept of separating critical business activities in order to reduce fraud is termed segregation of duties. In its simplest form, the Segregation of Duties (SoDs) principle states that sensitive tasks should be divided into two or more steps with each step being performed by a different user (Li et al., 2007). This study supports the following principles of SoDs within the accounts payable function as proposed by Little and Best (2003):
SoDs principle 1: users who can create and modify master records should not be able to post transactions.
SoDs principle 2: payments should be performed by someone other than the person who enters vendor invoices.
5.2 Known Vendor Fraud Symptoms
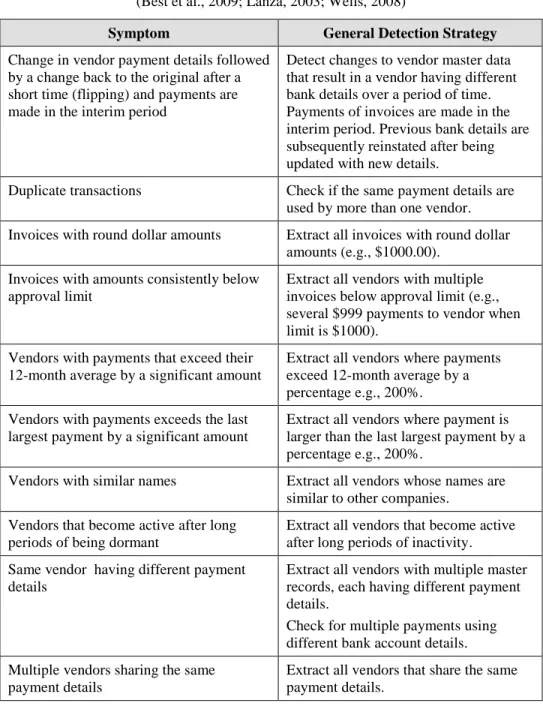
Vendor fraud schemes occur when a fraudster causes an organization to issue a payment by submitting invoices for fictitious goods or services, inflated invoices, or invoices for personal purchases. Activities that violate segregation of duties are indicators of potential fraud and require further investigation. These activities may be investigated to determine whether they match known vendor fraud symptoms, or appear otherwise anomalous. Methods to detect several known vendor fraud symptoms are specified in Table 3.
In the next section, we identify and describe two major approaches to continuous monitoring and fraud detection.
Table 3 Methods to Detect Known Vendor Fraud Symptoms (Best et al., 2009; Lanza, 2003; Wells, 2008)
Symptom General Detection Strategy
Change in vendor payment details followed by a change back to the original after a short time (flipping) and payments are made in the interim period
Detect changes to vendor master data that result in a vendor having different bank details over a period of time. Payments of invoices are made in the interim period. Previous bank details are subsequently reinstated after being updated with new details.
Duplicate transactions Check if the same payment details are used by more than one vendor. Invoices with round dollar amounts Extract all invoices with round dollar
amounts (e.g., $1000.00). Invoices with amounts consistently below
approval limit
Extract all vendors with multiple invoices below approval limit (e.g., several $999 payments to vendor when limit is $1000).
Vendors with payments that exceed their 12-month average by a significant amount
Extract all vendors where payments exceed 12-month average by a percentage e.g., 200%. Vendors with payments exceeds the last
largest payment by a significant amount
Extract all vendors where payment is larger than the last largest payment by a percentage e.g., 200%.
Vendors with similar names Extract all vendors whose names are similar to other companies.
Vendors that become active after long periods of being dormant
Extract all vendors that become active after long periods of inactivity. Same vendor having different payment
details
Extract all vendors with multiple master records, each having different payment details.
Check for multiple payments using different bank account details. Multiple vendors sharing the same
payment details
Extract all vendors that share the same payment details.
6. APPROACHES FOR CONTINUOUS MONITORING AND FRAUD DETECTION
Automated fraud detection requires continuous monitoring of an organisations transaction data. Continuous monitoring increases the probability of detecting
fraudulent activities (Coderre and Warner, 1999; Potla, 2003). The traditional or manual audit approach is limited because it reviews only a small percentage of a large population of transactions. Large accounting data files with several thousands of transactions are difficult to analyse or monitor manually in real-time. The alternative therefore is to automate this process by using information technology (Broady and Roland, 2008).
Continuous monitoring is a way to provide constant monitoring and surveillance of transaction data in a real or near real-time basis against a set of predetermined rule sets (Kuhn Jr. and Sutton, 2010). It enables auditors to provide a degree of assurance on information shortly after disclosure (Rezaee et al., 2002). It is a step in the path of the evolution of the financial audit from manual to computer-based methods. These systems analyse data and search for specific patterns or combination of activities. Potentially fraudulent activities can therefore be identified shortly after they occur. Widespread adoption of computer-based accounting information systems in general, and Enterprise Resource Planning (ERP) systems in particular, has contributed to the increasing demand for continuous monitoring (Vasarhelyi et al., 2004). However, presently only 2.6% of organisations use data monitoring to proactively detect fraud (ACFE 2010) (Figure 1).
Two major approaches to continuous monitoring exist. These are Embedded Audit Modules (EAMs), and Monitoring and Control Layer (MCL).
6.1 Embedded Audit Modules (EAM)
EAMs are software modules that are built into application programs and are specifically designed to continuously capture and monitor audit related information (Groomer and Murthy, 1989). If a pre-programmed constraint is violated an alert is generated, an auditor is informed, and transaction data is saved in a file (Best et al., 2009; Debreceny et al., 2005; Groomer and Murthy, 1989; Weber 1999).
Weber (1999) describes EAMs as modules that are placed at specific points within a system to gather material information about events or transactions. EAMs are therefore intended to detect and capture data as transactions are processed in the enterprise system. When a violation occurs the offending transaction can either be rejected or allowed and an error is logged. ERP systems are designed to process transactions efficiently and promptly. It is therefore not practical to disallow every offending transaction from being processed. Depending on the severity of the violation, some transactions could be conditionally processed whilst others are rejected. The level of severity of errors that would cause a transaction to be rejected needs to be negotiated and accepted by the client organisation (Groomer and Murthy, 1989).
6.2 Monitoring and Control Layer (MCL)
The Monitoring and Control Layer (MCL) introduced by Vasarhelyi et al. (2004) is an alternative continuous monitoring and auditing approach to EAMs. MCLs do not replace EAMs, instead they offer an alternative solution to cater for different circumstances (Kuhn and Sutton, 2010). In this approach the continuous monitoring and auditing system is separate from the client’s enterprise system. MCLs are stand-alone systems that rely on comparisons of extracted transaction data with pre-determined constraints that allow for continuous monitoring of systems and identification of violations (Du and Roohani, 2007).
The MCL primarily operates as a discrepancy-based audit monitoring tool, i.e., audit by exception (Vasarhelyi et al., 2004). The MCL continuously captures enterprise data and analyses it to detect any deviations from the norm. When an exception is detected, it is recorded. It will require further review by compliance personnel in order to identify the underlying problem. These further reviews are at the discretion of internal auditors.
In the next section, the study’s research propositions are developed. 7. RESEARCH PROPOSITIONS
To facilitate answering the study’s key research question, the following research sub-questions and propositions have been formulated. Each of the propositions directs attention to a specific issue that needs to be examined within the scope its research sub-question. The propositions assist in directing the study towards the desired outcome of answering the primary research question and proving the conceptual model.
SQ1: How do enterprise systems support proactive detection of potential fraud in financial transactions?
To answer this research sub-question, three propositions have been formulated. RP1a: Enterprise system audit trails document adequate data to allow retrospective monitoring of user activities.
RP1b: Violations in segregation of duties can be identified by analysing audit trails for critical combinations of user activities.
RP1c: Potentially fraudulent transactions can be identified by investigating user activities that violate segregation of duties, match known fraud symptoms, or appear otherwise anomalous.
SQ2: How can detection of potential fraud in enterprise systems be effectively and efficiently automated to ensure minimal auditor interaction?
To address this research sub-question, three propositions have been formulated. RP2a: Software can be developed to identify potentially fraudulent activities and report these using an intuitive visual interface.
RP2b: Threat monitoring and potential fraud detection can be implemented on a stand-alone external computer system operating independently of an organisation's enterprise system.
RP2c: Efficiency and effectiveness of the audit process can be improved by using technology to perform continuous monitoring of an organisation's enterprise system.
The next section examines the level of support enterprise systems provide for proactive fraud detection.
8. ENTERPRISE SYSTEM SUPPORT FOR PROACTIVE FRAUD DETECTION
Audit trails are records of users’ activities within an information system (Best, 2005; NIST, 2005). Audit trails are maintained by the operating system and applications such as database systems and enterprise systems (Best et al., 2004). The information captured in an audit trail is dependent on what events are being audited by the system (SAP-AG, 2009). In conjunction with appropriate tools and procedures, audit trails can assist in detecting fraudulent activities. For example, an audit trail on a payment of a vendor invoice begins with the receipt of the invoice. The invoice is tracked through accounts payable, all the way through to payment in order to settle the debt (Tatum, 2010).
To detect fraudulent activities in an enterprise system, some fundamental data is required. At a minimum, to detect fraud schemes listed in Table 3, an MCL-based application will require access to generic data items that define the event (who, when, where, and how) as well as specific data items relating to each scheme. Accordingly, this data should minimally include:
user name – name of the user that performed the transaction.
date – that the transaction was performed.
time – that the transaction was performed.
computer workstation – that the transaction was performed on.
transaction performed – the specific transaction that the user performed (e.g., entering an invoice, posting a payment).
transaction details – data relating to the transaction performed (e.g., vendor bank details, invoice amount).
8.1 SAP Enterprise System Audit Trails
SAP audit trails provide detailed descriptions of functions performed within an enterprise system. Each function in SAP has a transaction code associated with it. A transaction code (or tcode) consists of letters, numbers, or both (for example, FB60–Enter Vendor Invoice). A transaction code is a shortcut that takes the user directly to a SAP application rather than having to navigate through the menu system (Padhi, 2010). Each transaction code executed by a user is recorded in the audit trail (Best, 2000). The audit trail data required for this study is stored in several tables within the SAP enterprise system.
Changes to master records are stored in two tables, CDHDR Change Document Headers, and CDPOS Change Document Items (Best, 2005; Best et al., 2009; Hirao, 2009; Padhi 2010). Changes to master records include creation and deletion of master records and changes to fields. For every change document number, there is a corresponding change document item in the CDPOS table.
Figure 3 SAP Audit Trails
Accounting audit trails are stored in tables BKPF–Accounting Document Header, BSEG–Accounting Document Line Item, SKAT–General Ledger Account Texts, and LFA1–Vendor General Data. Tables BKPF and BSEG store posting histories for general ledger, and subsidiary ledger accounts. This facilitates integration of data and automatic reconciliation of subsidiary ledgers with reconciliation accounts. General ledger account texts (names) are stored in table SKAT. Vendor general data including vendor name, date created and creating user are stored in table LFA1.
8.2 Identifying Critical Combinations and Known Vendor Fraud Symptoms
The segregation of duties (SoDs) principles previously discussed may be detected in SAP by examining tcodes of functions performed by users. This data allows association of actions with users'. A list of critical combination of
activities a user has to perform in order to violate each of the SoDs principles is shown in Table 4. If any of these violations are identified then further investigation of an offending user's activities is necessary to determine whether any fraudulent transactions have been performed.
Given the ability to identify violations in segregation of duties, it is feasible to detect fraudulent transactions made possible by these violations. For example, the ability to identify users who have changed vendor details, entered an invoice and paid the invoice permits detection of vendor fraud. In addition, further vendor fraud can be detected through examination of other anomalous activities (Table 3).
Table 4 SAP Transaction Codes (adapted from SAP table TSTCT) T-Code SAP Description
Vendor Maintenance
FK01 Create Vendor (Accounting) FK02 Change Vendor (Accounting) XK01 Create Vendor (Centrally) XK02 Change Vendor (Centrally) Enter Invoice
FB60 Enter Vendor Invoice
F-43 Enter Vendor Invoice: Header Data
FB01 Post Document (allows posting of any financial transaction) FB10 Invoice/Credit Memo Fast Entry
Post Payment
F-53 Post Outgoing Payment F-58 Post Payment with Printout F110 Automatic Payments
Data describing user activities is well-documented in the audit trails of SAP enterprise systems. Analysing user activities for vendor fraud, however, is a difficult task if done manually. Computer based data analytics can be used to detect fraudulent activities that have already occurred, as well as determining the propensity for frauds occurring in the future (Edge and Sampaio, 2009). An automated methodology for vendor fraud detection is proposed and developed in the next section.
9. AUTOMATING FRAUD DETECTION IN ENTERPRISE SYSTEMS Modern integrated enterprise systems may record several thousands of transactions daily. This enormous amount of transactions makes it difficult to find a few instances of fraud among legitimate transactions. For large organisations, this means monitoring hundreds of thousands of transactions and then investigating suspicious ones in depth at considerable expense. A concern often raised in the literature regarding continuous fraud detection systems relates to information overload (Alles et al., 2006; Alles et al., 2008; Kuhn and Sutton, 2006). Simple detection of fraudulent activities is insufficient. Approaches that reduce the burden of excessive information presented to an auditor are more likely to contribute to the overall effectiveness of the audit
process. One method is to use visualisation to present information graphically (Fetaji, 2011; Liang and Miranda, 2001). Visualisation is a general term used to describe any technology that enable users to 'see' information in order to help them better understand and put it in an appropriate context (GraphViz, 2010; TechTarget, 2010). Visualisation tools go beyond the standard charts and graphs, displaying data in more sophisticated ways such as dials and gauges, heat maps, tree maps and detailed bar and pie charts. Patterns, trends and correlations that might go undetected in text-based data can be exposed and recognised easier with visualisation. Details on how the prototype addresses these issues are provided in the next section.
This study proposes a two-phase MCL-based strategy for detection of vendor fraud in a SAP enterprise system. In phase one, transaction data is periodically extracted from SAP. Data is extracted through the SAP data dictionary. The following data are extracted:
Change document headers: extracted from table CDHDR to identify transactions that violate SoDs.
Change document items: extracted from table CDPOS to identify Insert (I) changes involving vendors, table LFBK, and field KEY.
Accounting document headers: extracted from table BKPF for documents involving target user and transaction codes associated with invoices and payments.
Accounting document line items: extracted from table BSEG for postings involving target user and accounts payable general ledger accounts.
Vendor general data: extracted from table LFA1 for identifying vendor account information.
Phase two involves the analysis of extracted transaction data by a software application. This occurs in two stages. Stage one consists of profiling users to determine whether any violations in SoDs principles have occurred. In stage two, transactions processed by these particular users may be investigated by compliance personnel to determine whether any are fraudulent.
9.1 Prototype Development
A prototype is a partial or simplified implementation of a complete system (Asur and Hufnagel 1993; Davis, 1992) built for a specific purpose such as:
formulating and evaluating requirements, specifications and designs.
demonstrating feasibility, system behaviour or performance.
identifying and reducing risks of system mis-development.
communicating ideas, especially among diverse groups.
Two key advantages for constructing software prototypes relevant to this study are (Asur and Hufnagel, 1993; Budde and Zullighoven, 1990):
to provide users with a 'tangible' idea of the problem solution being sought after.
to demonstrate the technical feasibility of a specification.
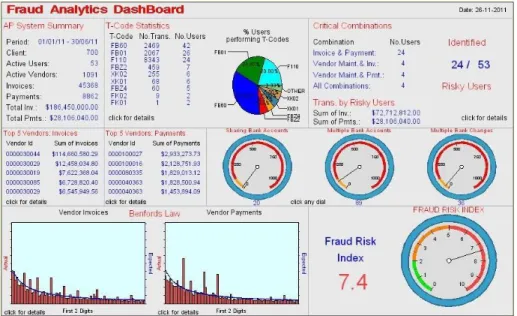
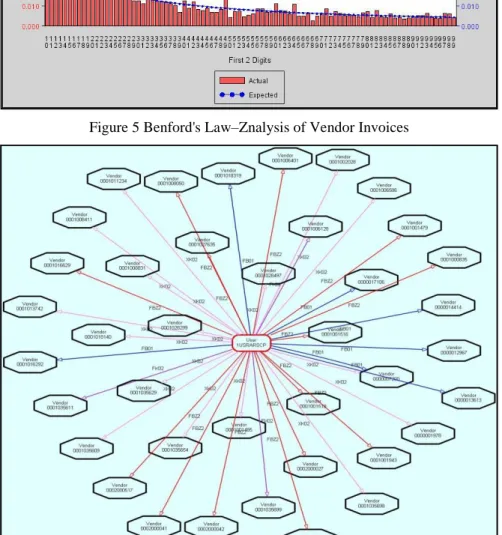
The prototype is intended to demonstrate that the concept of proactive detection of vendor fraud is feasible in practice. It is a limited version meant for showcasing the concept and for testing purposes only. It produces a combination of user- and vendor-centric reports and visualisations. A Fraud Analytics Dashboard provides a high-level overview of activities performed in the system (Figure 4). Transaction activities are summarised using pie and bar charts (Figure 5) and link node diagrams (Figure 6). These presentation methods augment standard text-based reports produced by the prototype and support a reduction in information presented to an auditor.
These visualization methods serve to reduce the problem of information overload by presenting voluminous information graphically.
Figure 5 Benford's Law–Znalysis of Vendor Invoices
9.2 Prototype Verification using Test Data
Software verification and validation is the process of checking that a software system meets specifications and that it fulfils its intended purpose. It is a disciplined approach to assessing software products that strives to ensure that quality is built into the software and that it satisfies user requirements (IEEE, 2004; Wallace et al., 1996).
Verification is an attempt to ensure that the product is built correctly and that the outputs of activities meet specifications imposed on them during the design phase. Software verification looks for consistency, completeness, and correctness of the software and its supporting documentation. Software testing is one of many verification activities intended to confirm that software development output meets its input requirements. Other verification activities may include code and document inspections, walkthroughs, and other techniques (USDoHHS, 1997).
The prototype is an Expert System intended to support a human expert in the decision making process. It is based on computational rules and a knowledge base. The power of the prototype is in the effectiveness and quality of the knowledge it contains. To ensure quality, the knowledge base needs to be verified. Potential problems can be grouped into (Cojocariu et al., 2005):
Consistency problems – caused by unnecessary conditions, redundant or conflicting rules; and
Completeness problems – caused by missing rules, errors, or gaps in the inference chains.
Verification of the prototype was achieved by performing a series of tests using simulated test data involving simulated activity over a period of one month. Initially, a series of “manual” experiments were performed on the test data to establish control values. These experiments were performed using Microsoft Excel. The same experiments were subsequently performed using the prototype and the values produced were reconciled with the control values. Inconsistencies in results were used to correct errors in the prototypes computational rules and knowledge base. These tests served to assess whether the software performed correctly, that it met the specifications imposed on it, and to provide a demonstration of the potential use of the prototype.
Additional experiments were performed to determine the processing capabilities of the prototype.
9.3 Analysis of Processing Times
A series of experiments were performed to determine whether the effectiveness and efficiency of the audit process can be improved by using technology. Experiments were performed using large and small data-sets. Processing time
remained comparatively constant regardless of the size of the data-set (Table 5). Transaction data can be extracted, downloaded, and pre-processed in approximately 40 minutes. An auditor then has the rest of the working day to analyze the data and conduct further detailed investigations of users or vendors. These tests indicate that auditor productivity may be improved when using the prototype to support the audit process. Independent reviews and an expert panel demonstration, discussed in the following section, provide further evidence in support of this conclusion.
Table 5 Average Processing Time for All Tests
9.4 Analysis of Case Study Data using Prototype
Six months of actual transaction data was processed using the prototype. This data was obtained from a large international manufacturing company. These tests exposed the prototype to live data. [Data was also collected on processing times]. A detailed trace of the processing of this data was generated. The scope of analysis was as follows:
Organization: (large international manufacturing company) System: SAP ECC 5.0
Module: Accounts Payable Fraud category: Asset Misappropriation
Sub-category: Billing schemes, shell company schemes, non-accomplice vendor schemes
Transactions: Vendor invoices, vendor payments, maintenance of vendor banking details
Analysis period: 01/01/2011 to 30/06/2011 SAP client: 700
Analysis procedures included:
User profiles: Users are profiled to determine the scope of activities they have performed. Activities include vendor maintenance, invoicing and payment transactions. Summary and detailed reports are produced.
Critical combinations:
Users that violate segregation of duties are identified and a report of potentially risky users is produced. Activity analysis: An individual user is identified from the risky users
list and selected for detailed investigation. Reports documenting individual user activities are produced. Vendor analysis: A series of investigations are performed on active
vendors, including vendors sharing bank accounts, vendors with multiple bank accounts, vendors with multiple master records, and Benford’s law.
9.5 Summary of Findings from Case Study
ICT support staff performed functions of normal users including entering invoices and paying vendors. This situation is not recommended as it violates normal segregation of duties principles of: (a) separating users from SAP support functions; and (b) separating entry of invoices/postings and payment functions. This poses a considerable fraud risk and requires review.
Several postings were made using SAP transaction code FB01- Post Document. It is generally recommended that users not use FB01 for entry of transactions. This transaction code allows the user to post any financial transaction including general ledger, customer, vendor, inventory, or asset transactions. The user enters a document type (e.g., SA, for GL postings) as part of the header data and then enters relevant data. Security guidelines usually recommend that no user be granted access to this transaction code; rather their profile should allow access to a set of specific transaction codes associated with their position (e.g., an accounts payable clerk). This provides proper segregation of duties.
Several users performed vendor maintenance, invoice entry, and payment processing activities. These activities violate segregation of duties principles. Roles of all users that have performed these activities require review and appropriate restrictions ought to be applied to their SAP profiles.
Several postings with round dollar amounts were identified. Round dollar values have a higher probability of being fraudulent (Wells, 2011, p. 113). These transactions require review to determine whether they are genuine.
It was observed that several vendors were sharing bank accounts. These appear to involve vendors with multiple vendor numbers for the same vendor. These vendors should be examined to check that they are genuine. There were also several vendors with multiple bank accounts. These appear to involve vendors with multiple master records. Duplicate vendor master records are a potential fraud risk and should be eliminated. It is recommended that the vendor master file be periodically cleaned.
Several cases of flipping banking details were observed. Flipping occurs when a vendor’s payment details are temporarily changed, a payment is made, and banking details are changed back to the original. This may be indicative of fraud where the fraudster redirects payments to their personal bank account. These transactions should be examined by internal audit to ensure that changes were authorized.
Benford’s Law gives expected frequencies of digits in numerical data. Contrary to belief, digits are not equally likely and are biased towards lower digits. Benford's Law analysis of the first two digits for vendor invoices revealed large spikes at 11, 22, 27, 36, 45, 54, and 67. Spikes also occurred at 22, 27, 36, 37, and 45 for vendor payments. Other smaller spikes were also observed for invoices and payments. Large spikes are indicative of potential fraud. These transactions require further examination to determine whether they are genuine.
9.6 Comments on Findings from Case Study
It should be noted that in organizations with Accounts Payable sections having small numbers of staff, complete segregation of duties may not be feasible. These organizations may implement other compensating manual processes that safeguard against inappropriate activity. However, SAP support staff roles should be quite distinct from normal user roles, given they can also create dummy user accounts. If they run batch jobs to process large volumes on behalf of users, there should be manual processes for approving and reviewing these jobs.
The results of the case study analysis require close examination by internal audit to determine whether these vulnerabilities/anomalies were actually associated with fraudulent activities.
In the next section, the prototype is reviewed by independent auditing practitioners in order to determine that it is the right product and that it fulfils its purpose.
10. PROTOTYPE VALIDATION
Validation is an attempt to ensure that the right product is built and that the product fulfils its specific intended purpose. Validation therefore is the
specifications conform to user needs and intended uses, and that the particular requirements implemented through software can be consistently fulfilled. Validation includes useability testing and user feedback.
Validation of the prototype was achieved by obtaining independent reviews from auditing practitioners. In each case, the reviewer(s) were provided with a summary paper (Singh et al., 2011), a one-hour presentation, and demonstration of the prototype. The demonstration involved processing and analysing using both simulated test data and actual transaction data.
Feedback was requested on the following issues [results are discussed in Section 10.1]:
a) The importance of such a project for auditing in an organisation. b) The role that automated fraud detection software could play as an
auditing tool for internal auditors.
c) The desirability of a retrospective analysis software tool implemented on a standalone computer system as compared with a system embedded within an enterprise system.
d) The functionality of the prototype, in particular the user interface, reporting and graphical features.
e) Further comments or suggestions for improvement to the prototype. Feedback was also obtained from a panel of experts. They were also provided with a summary paper, a one-hour presentation, and demonstration of the prototype. Their feedback was sought using a survey on key issues including: operation, reporting and visualisations, accuracy &efficiency, and impact on auditor productivity.
10.1 Independent Review and Expert Panel Feedback
Three independent reviewers provided feedback on the prototype. The first review was conducted by the Executive Director–Information Systems Audit of a top international accounting firm, based in Australia. His comments are given below:
A project of this nature is considered to be of high importance to organisations. It provides a mechanism to pro-actively monitor fraud risk, a key risk in any organisation. It also demonstrates a commitment to compliance with Corporate Governance Principles and Recommendations as outlined by ASX Corporate Governance Council.
Automated fraud detection software can provide internal auditors with a tool to efficiently assess the presence of fraud within an organization. This may also be applied to testing the effectiveness of the controls that management may have in place. A tool of this nature can ensure that the management of
the risk of fraud can be undertaken on a more regular or continual basis.
In general, I found the functionality of the tool to be useful. The user interface would require a minimal level of training and some level of understanding of the SAP application, which is a reasonable constraint. The graphs and visualizations clearly communicated a message for the reader. The speed of running the queries was impressive.
The other two reviewers (both senior management executives in an international manufacturing company) provided equally supportive comments and also felt that the prototype should be further extended to other areas including accounts receivable, fixed assets, and general ledger.
Expert Panel members were provided with a survey instrument and asked to rate key issues on a scale of 1 (strongly disagree) to 7 (strongly agree). Twenty-three responses were received. Results are discussed below.
Operation. Panel members rated the prototype as being easy to use, user-friendly, and providing adequate on-screen instructions (Table 6).
Table 6 Operation of Prototype Operation
(Questionnaire scale 1 to 7) Mean Variance Std Dev.
Easy to use 5.87 0.45 0.81
User-friendly 5.78 0.45 0.67
Navigation of user interface is simple 5.65 0.60 0.78 Onscreen instructions/ help is adequate 5.78 0.36 0.60 Data entry is straightforward 5.70 0.40 0.63
N=23
Reports and visualisations. Panel members rated reports as being easy to understand, useful in identifying potential fraud and in aggregating enormous amount of information. Visualisations were also seen as enabling identification of relationships or patterns in data that would otherwise be difficult in textual data. Overall, the group rated reports and visualisations as important tools in a fraud investigator's toolkit (Tables 7 and 8).
Table 7 Reports Reports
(Questionnaire scale 1 to 7) Mean Variance Std Dev.
Easy to understand 5.91 0.63 0.79
Contains adequate information 5.87 0.48 0.69
Helpful in identifying potential fraud 6.22 0.36 0.60 Are an important tool in a fraud investigators toolkit 6.17 0.33 0.58
N=23
Table 8 Visualisations Visualisations (charts & diagrams)
(Questionnaire scale 1 to 7) Mean Variance Std Dev.
Easy to understand 5.87 0.87 0.92
Useful in aggregating an enormous amount of
information 6.09 0.54 0.73
Enables effective exploration of data in a graphical
format 6.13 0.57 0.76
Enables identification of relationships or patterns in
data that are otherwise difficult to do in textual data 6.17 0.60 0.78 Enhances investigation and analysis for potential fraud 6.22 0.54 0.74 Are an innovative way of presenting information 6.35 0.42 0.65 Are an important tool in a fraud investigators toolkit 6.04 0.77 0.88
N=23
Accuracy, efficiency and performance. The prototype was rated as producing quality, useful and accurate results. Panel members agreed that the prototype was an improvement over basic analytical tools and results were produced in a much faster time than if done manually. They also felt that there was potential to save costs and reduce future fraud by early detection of suspicious user activities (Table 9).
Table 9 Accuracy, Efficiency and Performance Accuracy, Efficiency and Performance
(Questionnaire scale 1 to 7) Mean Variance Std Dev.
Produces quality results that are useful in
identifying potential fraud 5.96 0.50 0.71
Results are accurate and dependable 6.09 0.36 0.60 Produces the same results as a human expert 6.00 0.55 0.74 Generates results much faster than doing a similar
task manually 6.35 0.42 0.65
Is an improvement over basic analysis as it replaces blind querying of data with contextual analysis
5.96 0.59 0.77
Significantly enhances the internal auditing process 5.87 0.30 0.55 Potential to save costs due to improved fraud
detection 6.13 0.39 0.63
Potential to reduce future fraud by early detection
of suspect user activity 6.22 0.45 0.67
N=23
Auditor productivity. Panel members collectively agreed that the prototype may reduce time taken to identify potential fraud (Table 10). They were asked to rate the number of person days it would take to review a system for fraud based on 30,000 transactions. Their responses are shown in Tables 11 to 13.
Table 10 Visualisations
Auditor Productivity
(Questionnaire scale 1 to 7) Mean Variance Std Dev.
This software may reduce time taken to identify potential fraud in an organisation
6.30 0.49 0.70
N=23
Panel members generally agreed that it would take 20+ days (39.1%) or it would be an impractical task (60.9%) to audit the stated number of transactions, if done manually (Table 11).
Table 11 Time to Process Manually Q 4.1a Value (days) Count % How long would it take to review for fraud, if done manually? Impractical U 14 60.9% 20+ 9 39.1% 10 0 0.0% 5 0 0.0% 3 0 0.0% 1 0 0.0% Less than 1 <1 0 0.0% N=23
Panel members agreed that it would take between 1 and 20+ days to audit the stated number of transactions using other software (e.g., ACL, Access, and Excel) (Table 12).
Table 12 Time to Process with Other Software Q 4.1b Value (days) Count % How long would it take to review for fraud, if done using other software?
Impractical U 0 0.0% 20+ 8 34.8% 10 9 39.1% 5 3 13.0% 3 1 4.3% 1 2 8.7% Less than 1 <1 0 0.0% N=23
Panel members agreed that it would take between <1 to 5 days to audit the stated number of transactions using the prototype. Most agreed that 3 days (43.5%) was standard, 21.7% said 1 day and 17.4% said either 5 days or <1 day (Table 13). From these ratings, it may be concluded that using the prototype as a tool for detection of potential fraud improves auditor productivity.
Table 13 Time to Process with Prototype Q 4.1c Value (days) Count % How long would it take to review for fraud, if done using the prototype software?
Impractical U 0 0.0% 20+ 0 0.0% 10 0 0.0% 5 4 17.4% 3 10 43.5% 1 5 21.7% Less than 1 <1 4 17.4% N=23
Overall evaluation. Panel members considered the prototype a useful auditing tool that represented substantial advances over other tools currently available in the market. They are likely to use or recommend this tool should it be commercially available (Table 14).
Table 14 Overall evaluation Overall Evaluation
(Questionnaire scale 1 to 7) Mean Variance Std Dev.
This software represents substantial advances over other tools currently available in the market
5.96 0.41 0.64
If available, I am likely to use this software 5.70 0.68 0.82 If available, I am likely to recommend this software
to others
6.04 0.59 0.77
Overall, this software is a useful auditing tool 6.22 0.72 0.85 N=23
The findings and contributions of this study need to be considered within its limitations. These limitations and recommendations for future research are discussed next.
11. LIMITATIONS AND FUTURE RESEARCH
The first limitation of this study is that there is insufficient access to data to determine the level of fraud prevalent in organisations. Many frauds that occur are handled quietly by the victim organisations as they are more concerned about the embarrassment of making frauds public and the costs associated with fraud investigations. Consequently, organisations with and without fraud experiences are not prepared to provide access to their transaction data. This
found that one of the 10 key challenges for data analytics is the difficulty of getting data to perform analyses. Therefore, the single case study approach was adopted for this study. Future research could extend this study by replication in other organisations locally and internationally to test whether the same findings are observed or not.
The second limitation of this study is the generalisability of results is limited. The focus of this study is on a single category of occupational fraud, namely, asset misappropriation. Within asset misappropriation, the study focuses on billing fraud schemes involving shell companies and non-accomplice vendors in accounts payable. This limits identification of potential threats or frauds. Generalising the findings to other categories of fraud (such as accounts receivable) therefore must be made with caution. Extending the focus of the catalogue of fraud symptoms and fraud detection algorithms developed in this study to include other fraud schemes will extend identification of potential threats or frauds.
12. CONCLUSION
Fraud is a global problem that continues to grow annually. Results from the ACFE (2012) Report to the Nation on Occupational Fraud and Abuse highlights the significance and pervasiveness of the fraud problem. The Report concluded that the projected annual loss due to fraud is approximately $3.5 trillion. Furthermore an AuditNet survey (2012) of more than 1500 auditors concluded that the use of data analytics tools and techniques are not being maximized in routine audit activities. Therefore the financial impact of fraud appears to be increasing yet resources and technology are not being effectively deployed to address the problem. Enhancing the ability of organizations to detect potential fraud may have a positive impact on the economy. An effective model that facilitates proactive detection of potential fraud may potentially save costs and reduce the propensity of future fraud by early detection of suspicious user activities.
Enterprise systems generate hundreds of thousands to millions of transactions annually. The enormous amount of generated transactions makes it difficult to find few potentially fraudulent instances among legitimate transactions. Without the availability of proactive fraud detection tools, investigating suspicious activities becomes overwhelming.
Using the Design-Science framework, this study has established that:
enterprise system audit trails document adequate data to allow retrospective monitoring of user activities (RP1a).
violations in segregation of duties can be identified by analysing audit trails for critical combinations of user activities (RP1b).
potentially fraudulent transactions can be identified by investigating user activities that violate segregation of duties, match known fraud symptoms, or appear otherwise anomalous (RP1c).
software can be developed to identify potentially fraudulent activities and report these using an intuitive visual interface (RP2a).
threat monitoring and potential fraud detection can be implemented on a stand-alone external computer system based on the MCL approach (RP2b.
efficiency and effectiveness of the audit process can be improved by using technology to perform continuous monitoring (RP2c).
This study has demonstrated the feasibility of implementing proactive vendor fraud detection in enterprise systems.
REFERENCES
ACFE (2010). Report to the nation on occupational fraud and abuse. Retrieved from http://www.acfe.com/rttn on 6/10/2010.
ACFE (2012). Report to the nation on occupational fraud and abuse. Retrieved from http://www.acfe.com/rttn on 27/02/2013.
Albrecht, W. S., Albrecht, C. C., & Albrecht, C. D. (2009). Fraud examination, 3rd ed. USA: Thomson/South-Western.
Alles, M., Brennan, G., Kogan, A., & Vasarhelyi, M. A. (2006). Continuous monitoring of business process controls: A pilot implementation of a continuous auditing system at Siemens. International Journal of Accounting Information Systems, 7(2), 137-161.
Alles, M. G., Kogan, A., & Vasarhelyi, M. A. (2008). Putting continuous auditing theory into practice: Lessons from two pilot implementations. Journal of Information Systems, 22(2), 195-214.
Asur, S., & Hufnagel, S. (1993, 28-30 Jun 1993). Taxonomy of rapid-prototyping methods and tools. Paper presented at the Rapid System Prototyping, 1993. Shortening the Path from Specification to Prototype. Proceedings of 4th International Workshop.
AuditNet (2011). Study shows auditors slow to adopt hi-tech fraud detection strategies. Retrieved from http://cpatrendlines.com/2011/12/05/study-shows-
auditors-slow-to-adopt-hi-tech-fraud-detection-strategies/?utm_source=dlvr.it&utm_medium=twitter on 17/01/2012.
AuditNet (2012). AuditNet 2012 state of technology use by auditors. Retrieved from http://www.auditnet.org/ on 27/02/2013.
Best, P. J. (2000). SAP R/3 audit trail analysis. Paper presented at the Sapphire 2000. 4th Annual SAP Asia Pacific Institute of Higher Learning Forum, Brisbane, Australia, 23-25 July 2000.
Best, P. J. (2005). Audit trail analysis for fraud control with SAP R/3. Paper presented at the Oceania Computer Audit, Control and Security Conference (CACS) 2005 Conference.
Best, P. J. (2008). SAP–Accounts payable. On ACC3101–Accounting Information Systems: USQ.
Best, P. J., Mohay, G., & Anderson, A. (2004). Machine-independent audit trail analysis – A decision support tool for continuous audit assurance. International Journal of Intelligent Systems in Accounting, Finance & Management, 12(2), 85-102.
Best, P. J., Rikhardson, P., & Toleman, M. (2009). Continuous fraud detection in enterprise systems through audit trail analysis. Journal of Digital Forensics, Security and Law, 4(1).
BOS (2009). Benefits of using SAP for your business. Retrieved from
http://www.bos.com.np/index.php?option=com_content&view=article&id=61: benefits-of-using-sap-for-your-business&catid=34:articles&Itemid=72 on 08/11/2010.
Broady, D. V., & Roland, H. A. (2008). SAP GRC for dummies. Available from http://library.books24x7.com.ezproxy.usq.edu.au/toc.asp?bkid=25161
Budde, R., & Zullighoven, H. (1990). Prototyping revisited. Paper presented at the CompEuro '90. Proceedings of the 1990 IEEE International Conference on Computer Systems and Software Engineering, 8-10 May 1990.
CMU (2011). Companies using SAP? Retrieved from
http://sapua.cba.cmich.edu/sap_usersDB/ on 19/12/2012.
Coderre, D., & Warner, P. D. (1999). Computer-asisted techniques for fraud detection. CPA Journal, 69(8), 57.
Cojocariu, A., Munteanu, A., & Sofran, O. (2005). Verification, validation and evaluation of expert systems in order to develop a safe support in the process of decision making. Computational Economics. Retrieved from
http://ideas.repec.org/p/wpa/wuwpco/0510002.html on 10/11/2011.
Cressey, D. R. (1953). Other people's money: A study of the social psychology of embezzlement. New York, NY US: Free Press.
Davis, A. M. (1992). Operational prototyping: A new development approach. Software, IEEE, 9(5), 70-78.
Debreceny, R. S., Gray, G. L., Jun-Jin Ng, J., Siow-Ping Lee, K., & Yau, W.-F. (2005). Embedded audit modules in enterprise resource planning systems: Implementation and functionality. Journal of Information Systems, 19(2), 7-27. Du, H., & Roohani, S. (2007). Meeting challenges and expectations of continuous auditing in the context of independent audits of financial statements. International Journal of Auditing, 11(2), 133-146.
Edge, M. E., & Falcone Sampaio, P. R. (2009). A survey of signature based methods for financial fraud detection. Computers & Security, 28(6), 381-394. Fama, E. F., & Jensen, M. C. (1983). Separation of ownership and control. Journal of Law & Economics, XXVI.
Fetaji, B. (2011). Development and analyses of dynamical visualization process tool in run time and its usability evaluation. Technics Technologies Education Management, 6(2), 447-454.
Gartner (2010). Gartner says worldwide business intelligence, analytics and performance management software market grew 4 Percent in 2009 2010. Retrieved from http://www.gartner.com/it/page.jsp?id=1357514 on 27/10/2010.
GraphViz (2010). Graphviz - Graph visualization software. Retrieved from
http://www.graphviz.org/About.php on 21/12/2011.
Groomer, S. M., & Murthy, U. S. (1989). Continuous auditing of database applications: An embedded audit module approach. Journal of Information Systems, 3(2), 53.
Hevner, A. R., March, S. T., Park, J., & Ram, S. (2004). Design science In Information Systems Research. [Article]. MIS Quarterly, 28(1), 75-105. Hirao, J. (2009). SAP security configuration and deployment: The IT administrator's guide to best practices. Burlington, MA: Syngress Publishing. IEEE (2004). Guide to the software engineering body of knowledge
(SWEBOK). Retrieved from
http://www.computer.org/portal/web/swebok/html/ch11 on 14/11/2011.
Jensen, M. C., & Meckling, W. H. (1976). Theory of the firm: Managerial behaviour, agency costs and ownership structure. Journal of Financial Economics, 3(4), 305-360.
Kuhn Jr, J. R., & Sutton, S. G. (2010). Continuous auditing in ERP system environments: The current state and future directions. Journal of Information Systems, 24(1), 91-112.
Kuhn, J. R., & Sutton, S. G. (2006). Learning from WorldCom: Implications for fraud detection through continuous assurance. Journal of Emerging Technologies in Accounting, 3(1), 61-80.
Lager, M., & Tsai, J. (2008). SAP retains market-share lead in CRM. Customer Relationship Management,(October 2008), 17-18.
Lanza, R. B. (2003). Proactively detecting occupational fraud using computer audit reports. Florida: The IIA Research Foundation.
Lanza, R. B. (2007). Auditing vendor accounts forfraud or at least some cash recovery. Fraud Magazine, 15-17.
Li, N., Tripunitara, M. V., & Bizri, Z. (2007). On mutually exclusive roles and separation-of-duty. ACM Transactions on Information and System Security, 10(2), 5.
Liang, L. Y., & Miranda, R. (2001). Dashboards and scorecards: Executive information systems for the public sector. Government Finance Review.
Little, A., & Best, P. J. (2003). A framework for separation of duties in an SAP R/3 environment Managerial Auditing Journal, 18(5), 419-430.
Luqi, L., & Steigerwald, R. (1992). Rapid software prototyping. Paper presented at the System Sciences, 1992. Proceedings of the Twenty-Fifth Hawaii International Conference, 7-10 January 1992.
Narayan, V. (2008). Financial Accounting (FI). SAP FI/CO questions and answers. Sudbury: Infinity Science Press.
NIST (2005). An Introduction to computer security: The NIST handbook,
Special Publication, 800(12). Retrieved from
http://csrc.nist.gov/publications/nistpubs/800-12/handbook.pdf.
O'Gara, J. D. (2004). Corporate fraud case studies in detection and prevention. Hoboken, NJ: Wiley & Sons.
Padhi, S., N (2010). SAP ERP financials and FICO handbook. Burlington, MA: Jones and Bartlett.
Potla, L. (2003). Detecting accounts payable abuse through continuous
auditing. ITAudit, 6(3). Retrieved from
http://www.theiia.org/itaudit/index.cfm?fuseaction=forum&fid=5458.
Rezaee, Z., Sharbatoghlie, A., Elam, R., & McMickle, P. L. (2002). Continuous auditing: Building automated auditing capability. Auditing, 21(1), 147.
Romney, M. B., & Steinbart, P. J. (2009). Accounting Information Systems, 11th ed. Upple Saddle River, NJ: Pearson.