Henry Ford Health System Scholarly Commons
Henry Ford Health System Scholarly Commons
Cardiology Articles Cardiology/Cardiovascular Research
1-1-2017
Predicting diabetes mellitus using SMOTE and ensemble machine
Predicting diabetes mellitus using SMOTE and ensemble machine
learning approach: The Henry Ford ExercIse Testing (FIT) project.
learning approach: The Henry Ford ExercIse Testing (FIT) project.
Manal Alghamdi Mouaz H. Al-Mallah
Henry Ford Health System, [email protected] Steven J. Keteyian
Henry Ford Health System, [email protected] Clinton Brawner
Henry Ford Health System, [email protected] Jonathan K. Ehrman
Henry Ford Health System, [email protected]
See next page for additional authors
Follow this and additional works at: https://scholarlycommons.henryford.com/cardiology_articles
Recommended Citation Recommended Citation
Alghamdi M, Al-Mallah M, Keteyian S, Brawner C, Ehrman J, Sakr S. Predicting diabetes mellitus using SMOTE and ensemble machine learning approach: The Henry Ford ExercIse Testing (FIT) project. PLoS One. 2017;12(7):e0179805.
This Article is brought to you for free and open access by the Cardiology/Cardiovascular Research at Henry Ford Health System Scholarly Commons. It has been accepted for inclusion in Cardiology Articles by an authorized administrator of Henry Ford Health System Scholarly Commons.
Sakr
This article is available at Henry Ford Health System Scholarly Commons: https://scholarlycommons.henryford.com/ cardiology_articles/148
Predicting diabetes mellitus using SMOTE and
ensemble machine learning approach: The
Henry Ford ExercIse Testing (FIT) project
Manal Alghamdi1,2, Mouaz Al-Mallah1,2,3, Steven Keteyian3, Clinton Brawner3, Jonathan Ehrman3, Sherif Sakr1,2*1 King Saud bin Abdulaziz University for Health Sciences, Riyadh, Saudi Arabia, 2 King Abdullah International
Medical Research Center, Riyadh, Saudia Arabia, 3 Heart and Vascular Institute, Henry Ford Hospital System, Detroit, MI, United States of America
Abstract
Machine learning is becoming a popular and important approach in the field of medical research. In this study, we investigate the relative performance of various machine learning methods such as Decision Tree, Naïve Bayes, Logistic Regression, Logistic Model Tree and Random Forests for predicting incident diabetes using medical records of cardiorespira-tory fitness. In addition, we apply different techniques to uncover potential predictors of dia-betes. This FIT project study used data of 32,555 patients who are free of any known coronary artery disease or heart failure who underwent clinician-referred exercise treadmill stress testing at Henry Ford Health Systems between 1991 and 2009 and had a complete 5-year follow-up. At the completion of the fifth 5-year, 5,099 of those patients have developed diabetes. The dataset contained 62 attributes classified into four categories: demographic characteristics, disease history, medication use history, and stress test vital signs. We developed an Ensembling-based predictive model using 13 attributes that were selected based on their clinical importance, Multiple Linear Regression, and Information Gain Rank-ing methods. The negative effect of the imbalance class of the constructed model was han-dled by Synthetic Minority Oversampling Technique (SMOTE). The overall performance of the predictive model classifier was improved by the Ensemble machine learning approach using the Vote method with three Decision Trees (Naïve Bayes Tree, Random Forest, and Logistic Model Tree) and achieved high accuracy of prediction (AUC = 0.92). The study shows the potential of ensembling and SMOTE approaches for predicting incident diabetes using cardiorespiratory fitness data.
Introduction
Over the last century, the prevalence of diabetes has been increasing dramatically with the aging population worldwide. Today, about 415 million people around the world have diabetes [1]. Globally, the projection of having diabetes will rise from one in 11 adults in 2015 to one in a1111111111 a1111111111 a1111111111 a1111111111 a1111111111 OPEN ACCESS
Citation: Alghamdi M, Al-Mallah M, Keteyian S,
Brawner C, Ehrman J, Sakr S (2017) Predicting diabetes mellitus using SMOTE and ensemble machine learning approach: The Henry Ford ExercIse Testing (FIT) project. PLoS ONE 12(7): e0179805.https://doi.org/10.1371/journal. pone.0179805
Editor: Bin Liu, Harbin Institute of Technology
Shenzhen Graduate School, CHINA
Received: March 3, 2017
Accepted: June 5, 2017
Published: July 24, 2017
Copyright:©2017 Alghamdi et al. This is an open access article distributed under the terms of the
Creative Commons Attribution License, which permits unrestricted use, distribution, and reproduction in any medium, provided the original author and source are credited.
Data Availability Statement: Due to ethical
restrictions imposed by the Institutional Review Board of Henry Ford Health Systems, the data underlying this study are available upon request to interested researchers after receiving the Institutional Review Board’s approval. To apply for access to these data, interested researchers may query Dr. Tim Roehrs ([email protected]) of Henry Ford Health Systems’ Institutional Review Board.
10 adults by 2040 [1]. Diabetes is a significant contributor to increased mortality rates and thus reduction in life expectancy of elderly diabetic patients [2]. In 2015, diabetes was responsible for 4.5 million deaths around the world [1] and is projected to be the 7th leading cause of death in 2030. This epidemic disease is continuously escalating and a major economic burden on health care systems [1].
Known coronary artery disease was defined as an existing history of any of the following: myocardial infarction, coronary angioplasty, coronary artery bypass surgery, or documented obstructive CAD on angiogram. Heart failure was defined as a prior clinical diagnosis of systolic or diastolic heart failure (heart failure with reduced or preserved left ventricular function). Dia-betes mellitus was defined as a prior clinical diagnosis of diaDia-betes, use of anti-hyperglycemic medications including insulin, or an electronic medical record (EMR) or problem list-based diagnosis of diabetes [3].
Diabetes contributes significantly in increasing mortality and reducing life expectancy in elderly diabetic patients [4,5]. The key problem is that patients who might develop diabetes are not aware of the associated high risks. Late or lack of diabetes diagnosis increases the chance of developing any disease due to chronic vascular complications [4,5]. However, screening patients and detecting asymptomatic disease such as diabetes might help in delaying its progression and preventing its complications [2], controlling the treatment, and reducing the costs of this preventable disease in the health care system [4]. Furthermore, it is also benefi-cial for both public health and clinical practice in general [2]. Demographic characteristics such as age, sex and race are non-modifiable risk factors of diabetes. The association of these characteristics to diabetes has been explored in a number of studies and has proven their direct association to diabetes. Diabetes is more prevalent in men than in women [6–8] and increases with the increase of age [6,9]; in 2015 there were about 199.5 million women who had diabetes in comparison to 215.2 million men [9]. Also, a systematic review by Alhyas et al. [7] has found that there is a significant relationship between incidents of diabetes and the increase in age of both sexes. Major risk factors of diabetes mellitus include obesity, physical inactivity, unhealthy diet [2,9,10], population growth, aging, urbanization [9], family history of diabetes, previous history of gestational diabetes and ethnicity groups [10].
Machine learning methods are gaining increasing momentum and attracting a lot of atten-tion in the field of medical research [11]. They have shown their capabilities to effectively deal with large numbers of variables while producing powerful predictive models. They also embed variable selection mechanisms which can detect complex relationships in the data. Supervised classification techniques [12] are popular machine learning methods that aim to explain the dependent variable in terms of the independent variables. The aim of this study is to take advantage of the unique opportunity provided by our access to a large and rich clinical research dataset collected by the The Henry Ford ExercIse Tesing (FIT) project [13] and using it to investigate the relative performance of various machine learning classification methods such as Decision Tree (DT), Naïve Bayes (NB), Logistic Regression (LR), Logistic Model Tree (LMT) and Random Forests (RF) for predicting incident diabetes using medical records of cardiorespiratory fitness. In addition, we apply different techniques to uncover potential pre-dictors of diabetes using the available large set of dataset attributes.
Materials and methods
Henry Ford FIT dataset
The dataset was collected from patients who underwent treadmill stress testing by physician referrals at Henry Ford Affiliated Hospitals in metropolitan Detroit, MI in the U.S. The FIT Project data has been obtained from the electronic medical records, administrative databases, Funding: Funding was provided by King Abdullah
International Medical Research Center. Funding grant number SP16/100. The funders had no role in study design, data collection and analysis, decision to publish, or preparation of the manuscript.
Competing interests: The authors declare no
and the linked claim files and death registry of the hospital [13]. Study participants underwent routine clinical treadmill exercise stress testing using the standard Bruce protocol between Jan-uary 1st, 1991 and May 28th, 2009. The day the treadmill test was performed served as the baseline for this study. The exercise stress test would be terminated by the supervising clinician if the patient had exercise-limiting chest pain, shortness of breath, or other limiting symptoms independent of the achieved heart rate. Furthermore, testing could also be terminated early at the discretion of the supervising clinician for significant arrhythmias, abnormal hemodynamic responses, diagnostic ST-segment changes, or if the participant was unwilling or unable to continue.
This FIT project study used data of 32,555 patients free of known coronary artery disease or heart failure who underwent clinician-referred exercise treadmill stress testing at Henry Ford Health Systems Between 1991 and 2009 and had a complete 5-year follow-up. The dataset con-tained four categories: demographic characteristics, disease history, medication use history, and exercise test data for 62 attributes. At the completion of the fifth year, 5,099 of those patients have developed diabetes. Resting heart rate and blood pressure were measured in the seated position prior to treadmill testing. The percent of maximal heart rate achieved was based on the age-predicted maximal heart rate formula: 220—age. Cardiorespiratory fitness, expressed in metabolic equivalents (METs), was based on the workload derived from the maxi-mal speed and grade achieved during the total treadmill time. MET results were categorized into 4 groups based on distribution of the data as follows:<6, 6–9, 10–11,12 METs. For detailed description of the final dataset, seeS1 Appendix.
Data preprocessing
Data discretization. All binary attributes were transformed to nominal withYesandNo values including the label class (diabetic/non-diabetic). Also, all continuous numeric attributes were discretized by the unsupervised discretization filter using different bins range precision depending on the type of the attribute.
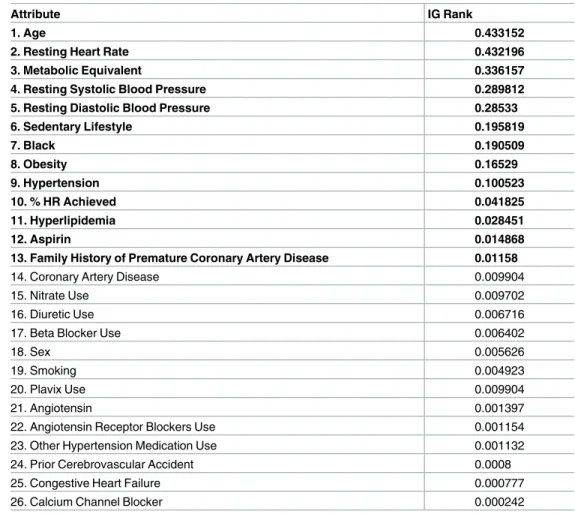
Feature selection. Feature selection is the main process of data dimensionality reduction; selecting subset of features that contribute significantly to the target class improves the overall prediction performance of the classifier, reduces the length of the process as well as the cost of computation [14]. Also, it clarifies the underlying process that generates the data [15]. In this study, the first group of attributes (G1) consisted of 26 attributes that were selected manually based on their clinical importance in the domain. Then, the SPSS statistical software was used to find the significant p-value for each attribute in relation to the target class by using Multiple Linear Regression (MLR). Furthermore, these 26 attributes were evaluated by the Attribute Evaluator in the WEKA software (http://www.cs.waikato.ac.nz/ml/weka/) using the Informa-tion Gain Technique (Entropy) [16].Table 1shows the significance rank of these attributes where theAgeis ranked the highest in the list whileCalcium Channel Blocker Medi-cationis ranked the least. The second group of attributes (G2), highlighted in bold font in Table 1, have been deduced from the attributes of (G1). The selection was based on the highest ranked attributes that scored 0.01 or more (SeeTable 1).G2included 13 attributes which are half the number of the first group (G1).
Machine learning classification models
Classification technique is one of the most important machine learning prediction models [17]. Classification is described as the process of systematic arrangement of objects in groups or categories according to observed similarities. Many studies for predicting diabetes have
used this type of classification, and this algorithm model has been proven to be highly effective in our study as well [18–20].
J48 [21] is a decision tree classification algorithm that generates a mapping tree that includes attributes nodes linked by two or more sub-trees, leaves, or other decision nodes. When building the classifier for this study, pruning was used to avoid the over-fitting problem. J48 uses the post-pruning approach that removes branches when the model tree is completed. Naïve Bayes Tree is another decision tree algorithm that generates a decision tree with naïve Bayes classifiers [22] at the leaves levels.
Logistic Regression (LR) [23] is a statistical classifier that provides the probability for pre-dicting the labeled class of categorical type by using a number of attributes. The prediction model classifier measures the relationship between the attributes and the labeled class. Naïve Bayes (NB) [24] provides a probability based on the theorem of Bayes which is one of the Bayesian network algorithms that is well-known for its simplicity and good performance. It is built with the assumption of conditional independency between the attributes. The model does not require any iterative parameter estimation; therefore, it is very suitable for large datasets.
The Logistic Model Tree (LMT) algorithm [23–26] is a supervised training algorithm that combines the basic technique of decision tree learning with the standard Logistic Regression functions at the leaves. The LogitBoost algorithm is used to fit iteratively the Logistic Table 1. Ranking of the dataset attributes based on their Information Gain (IG).
Attribute IG Rank
1. Age 0.433152
2. Resting Heart Rate 0.432196
3. Metabolic Equivalent 0.336157
4. Resting Systolic Blood Pressure 0.289812
5. Resting Diastolic Blood Pressure 0.28533
6. Sedentary Lifestyle 0.195819 7. Black 0.190509 8. Obesity 0.16529 9. Hypertension 0.100523 10. % HR Achieved 0.041825 11. Hyperlipidemia 0.028451 12. Aspirin 0.014868
13. Family History of Premature Coronary Artery Disease 0.01158
14. Coronary Artery Disease 0.009904
15. Nitrate Use 0.009702
16. Diuretic Use 0.006716
17. Beta Blocker Use 0.006402
18. Sex 0.005626
19. Smoking 0.004923
20. Plavix Use 0.009904
21. Angiotensin 0.001397
22. Angiotensin Receptor Blockers Use 0.001154
23. Other Hypertension Medication Use 0.001132
24. Prior Cerebrovascular Accident 0.0008
25. Congestive Heart Failure 0.000777
26. Calcium Channel Blocker 0.000242
Regression at each node in the tree by using five-cross validation to determine the appropriate number of iteration while J48 is applied to each node for splitting. If the node is a nominal attribute; then, it will be split into k-value of child nodes, and if the node is a numeric attribute; then, it will be split into only two child nodes. These two nodes will be compared to a thresh-old; if the values of the instances is less than the value of the threshthresh-old; then, they will be sorted to the left side; otherwise, they will be sorted to the right side. The splitting will continue until the criterion is met.
Random Forest (RF) [27,28] is a decision tree that follows the strategy of the ensemble method which combines more than one tree-structured classifier. Independent and random vectors are identically distributed among the structured trees. The grown trees are built ran-domly and mostly controlled by the generated random vectors. The accuracy of the classifica-tion predicclassifica-tion has significantly improved due to the algorithm of trees combinaclassifica-tion in which the most popular classes are selected based on the vote mechanism at the inputxof vector.
Dealing with imbalanced dataset
The five-year FIT Project dataset consists of 32,555 instances and composed of a heteroge-neous sample of diabetic and non-diabetic patients. However, diabetic patients represent only 15.7% of the whole sample while non-diabetic patients represent 85.3%. The variance between the two classes is considerably large and could lead to lower accuracy on the prediction of the classifiers. In general, balance and imbalance classes are two representations of datasets. In most cases, the real-world data is imbalanced in many applications such as fraud detection, prevalence of diseases, credit scoring, or medical diagnosis. Class imbalance is a supervised learning problem and is very popular in the community of data science. The class imbalance problem occurs when there is a big difference between the number of majority class and the minority class and mostly in classes with binary values [29,30]. The disparity caused in the val-ues of the target class could have an extremely negative impact on the performance of the machine learning algorithms [31]. Most of the time, it would lead to false classification and the prediction result will be either over-fitted because the model does not attenuate the bias for the majority class or under-performed due to the very few instances of positive class [32].
In practice, several studies have shown that better prediction performance can be achieved by having balanced data; therefore, a number of well-known methods has been developed and used in machine learning to tackle this issue for improving the prediction models’ perfor-mance [33]. These methods [33–36] are called “Sampling Methods”. The main concept of these methods is to modify the original dataset target class values to equal the distribution in the label class. Under-sampling and over-sampling methods are applied in many forms. In our study, we designed our classification models experiments based on two techniques which are:Random Under-SamplingandSynthetic Minority Over-Sampling Technique (SMOTE). Previous studies showed that the random undersampling technique outperforms the SMOTE technique with some datasets; however, there are other studies that observed that SMOTE performed better with other datasets [37].
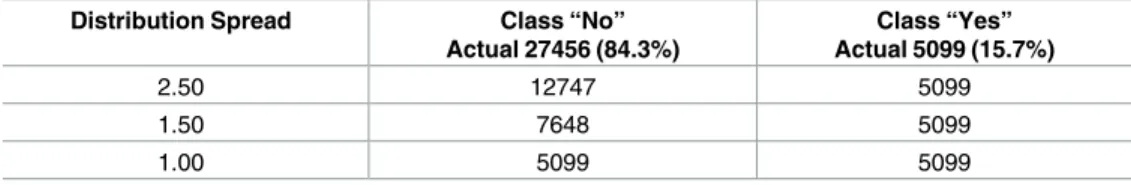
Random Under-Sampling technique. In this technique, all instances in the minority class are used while some instances of the majority class are removed randomly until both clas-ses are equally balanced. One drawback of this technique is the loss of important information from the majority class. In this study, we used the undersampling method in three experiments by changing the values of the distribution spread in three levels (1.00, 1.50, and 2.00). As a result, three new training datasets are generated. Random Under-Sampling with (2.00) distri-bution spread value decreased the majority sample from 27,456 patients to 12,747 patients. Random Under-Sampling with (1.50) distribution spread value decreased the majority sample
to 7,648 patients while with (1.00) distribution spread value, the majority sample has been decreased to 5,099 patients which is equal to the number of the minority class of positive cases (Table 2).
Synthetic Minority Oversampling Technique (SMOTE). The SMOTE technique is a type of oversampling method that has been shown to be powerful and is widely used in machine learning with imbalance high-dimensional data that are increasingly used in medi-cine [37]. The SMOTE technique generates randomly new examples or instances of the minor-ity class from the nearest neighbors of line joining the minorminor-ity class sample to increase the number of instances. These instances are created based on the features of the original dataset so that they become similar to the original instances of the minority class [38]. In our study, we applied the SMOTE techniques with three different percentages: 100%, 200%, and 300%. As a result, three new training datasets were generated. SMOTE with (100%) increased the positive sample from 5,099 instances of the minority class to 10,198 patients. SMOTE with (200%) increased the positive sample from 5,099 to 15,297 instances. SMOTE with (300%) increased the positive sample from 5,099 to 20,396 instances. This made an incremental increase in the minority class from 15.7% in the original dataset to 47% in the SMOTE with 300% dataset (Table 3).
Model validation
In general, there are two main validation methods used, namely theHold-outmethod and K-fold Cross Validation method, in machine learning to validate the model’s perfor-mance after training the classifier [39–42]. The selection of each method depends on the goal of each classification problem and the data size. TheHold-outmethod divides the dataset into two data sets, training and test. The training set will be used to train the algorithm and will be evaluated against the test set which is the unseen data. TheK-fold Cross Valida-tion method[42], which we have used in this study, uses the whole dataset to be trained and tested by the given algorithm. First, the dataset is separated intoKparts called folds, and all the folds have instances of equal size. The training process is applied on all folds except one fold for testing. This process is iterative and is repeated by the specifiedKnumber, where each fold has the chance to be tested once. The final performance measure will be the average of all the tests performance of all folds. The advantage of this method is that all the instances of the whole dataset are trained and tested, so lower variance occurs within the set estimator. This Table 3. Number of instances increased by SMOTE technique.
Percentage of SMOTE Increase Class “No” Actual 27456 (84.3%) Class “Yes” Actual 5099 (15.7%) 100% 27456 10198 200% 27456 15297 300% 27456 20396 https://doi.org/10.1371/journal.pone.0179805.t003
Table 2. Number of instances decreased by Random Under-Sampling technique. Distribution Spread Class “No”
Actual 27456 (84.3%) Class “Yes” Actual 5099 (15.7%) 2.50 12747 5099 1.50 7648 5099 1.00 5099 5099 https://doi.org/10.1371/journal.pone.0179805.t002
ensures a more accurate prediction and less bias of the true rate estimator; however, this method is computationally intensive and the validation takes a long time to be completed. In our study, we have relied on the 10-fold Cross Validation method, which has been used in sev-eral health care and medical related studies [43,44].
Results
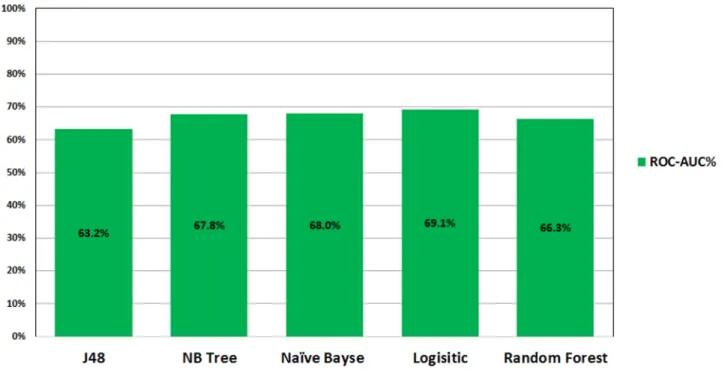
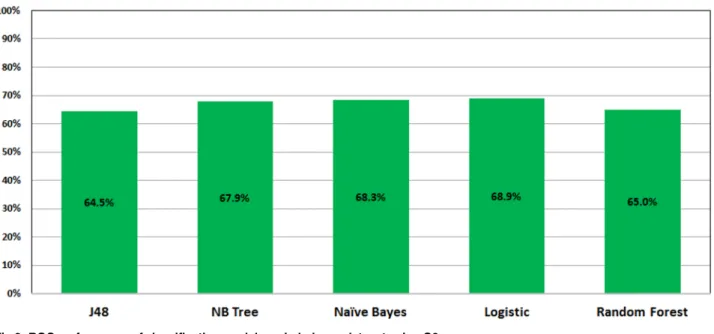
Figs1and2show the ROC performance of the ML classification methods on the imbalanced datasets using the two sets of attributes:G1andG2, respectively. The results show that the Logistic Regression (LR) classifier achieves the highest performance (69.1% forG1and 68.9% forG2) while the J48 Decision Tree (DT) classifier achieves the lowest performance (63.2% for G1and 64.5% forG2).
Tables4and5show the detailed performance results of the ML classification methods on the imbalanced datasets using the two sets of attributesG1andG2, respectively. WithG1 attri-butes, theNaïve Bayes (NB)classifier achieves the best performance of theKappa(15.4), Specificity(27.7%) andPrecision(86.7%) metrics. TheRandom Forest (RF) classifier achieves the best performance of theRecall(99.9%) andAccuracy(84.3%). The Random Forest (RF)and theLogistic Regression (LR)classifiers jointly achieve the highestF1-Score(91.5). WithG2attributes, theLogistic Model Tree (LMT) clas-sifier achieves the best performance of theKappa(3.63) metric. TheNaïve Bayes (NB) classifier achieves the best performance of theSpecificity(21.2%) andPrecision (86.1%). TheLogistic Regression (LR)achieves the highestF1-Score(91.5).
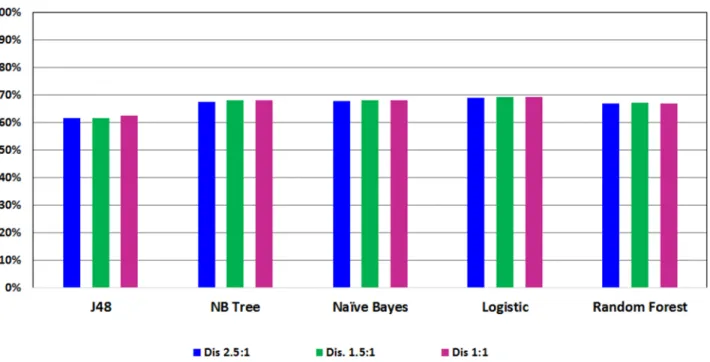
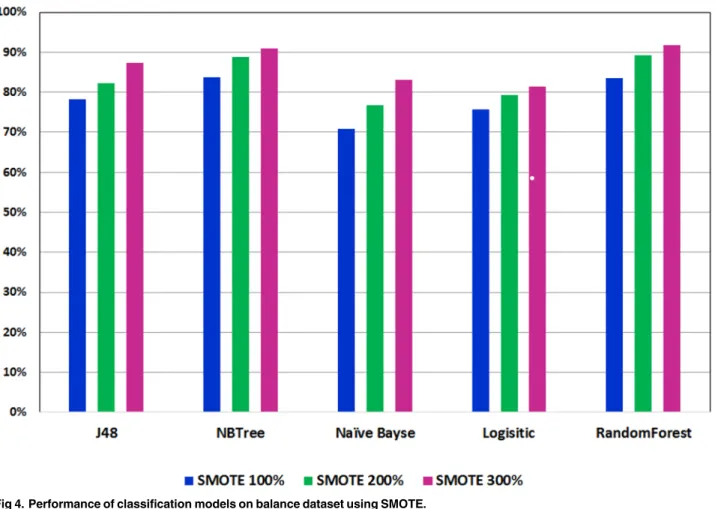
Figs3and4show the ROC performance of the ML classification methods with theG2 attri-butes using the balanced datasets which are generated using the two sampling methods: Random Under-Sampling techniqueandSMOTEtechniques, respectively. The results show that theRandom Under-Samplingdid not effectively the ROC performance of the classification models. With this sampling method, theLogistic Regression (LR)
Fig 1. ROC performance of classification models on imbalance dataset using G1.
classifier achieved the highest ROC performance for distribution spread 1 (69.1%), distribu-tion spread 1.5 (69.1%) and distribudistribu-tion spread 2.5 (68.8%). On the other hand, the results show that theSMOTEtechnique has effectively improved the ROC performance of the classifi-cation models. In particular, theLogistic Model Tree (LMT)achieved the highest ROC performance for the 100% increase (83.7%) and the 200% increase (88.9%) while theRandom Forests (RF)classifier achieved the highest ROC performance for the 300% increase (91.8%). With theSMOTEtechnique, the ROC performance improve the sampling percentage increased.
In general, the ensemble learning approach applies the concept of collecting multiple indi-vidual classifiers and combines their predictions into one decision classifier [45]. The ensem-bling technique in machine learning has shown to be very efficient in improving the
classification accuracy [18]. For example, Liu et al. [46] presented a method called iDNA-KACCwhich combines the support vector machine (SVM) and the auto-cross covariance transformation to identify the DNA-binding proteins only based on the protein sequence information. Liu et al. [47] has also presented another ensemble learning framework, called iDHS-EL, for identifying the location of DHS in human genome by fusing three individual Random Forest (RF) classifiers into an ensemble predictor.iRSpot-EL[48] is another ensemble learning framework which has been designed to identify recombination spots by fusing Fig 2. ROC performance of classification models on imbalance dataset using G2.
https://doi.org/10.1371/journal.pone.0179805.g002
Table 4. Evaluation of the performance of classification models on imbalance dataset using theG1attributes.
Model Kappa Recall (%) Specificity (%) Precision (%) Accuracy (%) F1-Score
J48 2.45 98.5 3.0 84.5 83.58 91 LMT 5.93 98.1 5.8 84.9 83.64 91 NB (15.4) 87.4 (27.7) (86.7) 78.8 87.1 LR 0.92 99.8 0.70 84.4 84.29 (91.5) RF 00.7 (99.9) 00.6 84.4 (84.3) (91.5) https://doi.org/10.1371/journal.pone.0179805.t004
different modes of pseudo K-tuple nucleotide composition and mode of dinucleotide-based auto-cross covariance. Song et al. [49] employed an ensemble classifier using a new predictor (nDNA-Prot) to obtain the protein structure and identify DNA-binding proteins. The identifi-cation was conducted using a feature that selected the minimum Redundancy and Maximum Relevance (mRMR). Wang et al. [50] used an ensemble learning concept in combination with weights and sample misclassification information to effectively classify imbalanced data.
Table 6shows the results of the Ensembling “Vote” method with three Decision Trees (Naiive Bayes,Random Forest, andLogistic Model Tree) on improving the over-all ROC performance of the model classifiers to 92.2%. In particular, the ROC performance has increased by (0.4%) over the best ROC performance achieved by theRandom Forests (RF)classifier (91.8%). The results ofTable 6show also that the ROC performance of the Ensembling “Vote” method using the set of attributes (G1) is very comparable to the ROC performance using the set of attributes (G2).
Discussion
To the best of our knowledge, this is the first study for predicting incident diabetes using machine learning methods based on cardiorespiratory fitness data. This study take advantage Table 5. Evaluation of the performance of classification models on imbalance dataset using theG2attributes.
Model Kappa Recall (%) Specificity (%) Precision (%) Accuracy (%) F1-Score
J48 1.34 99.2 1.6 8.44 83.93 91.2 LMT (3.63) 99.2 3.1 84.6 84.14 91.3 NB 1.37 90.8 (21.2) (86.1) 79.94 88.4 LR 0.70 (99.9) 0.50 84.4 84.32 (91.5) RF 1.14 99.4 1.3 84.4 84.04 91.3 https://doi.org/10.1371/journal.pone.0179805.t005
Fig 3. Performance of classification models on balance dataset using Random Under-Sampling.
of the unique opportunity provided by our access to a large and rich clinical research dataset of the FIT project. In this study, a combination of three decision tree models (Random Forest, NB Tree, and LMT) in the Ensembling “Vote” approach achieved a high accuracy prediction (AUC = 0.92) using 13 features. The features areage,resting heart rate,metabolic equivalent level,resting systolic blood pressure,resting diastolic blood pressure,sedentary lifestyle,black,obesity,hypertension, percentage of heart rate achieved,history of hyperlipidemia,use of aspirin medicationandfamily history of premature coronary artery disease.
With accelerating economic growth and changing lifestyles worldwide, it is important to evaluate and build predictive models for diabetes using common risk factors. Recently, machine learning methods have become of great interest and have been used by many scholars to build and compare models for predicting diseases including diabetes [20,45]. For example, decision tree models have been widely used to predict diabetes [18] and experimental results Fig 4. Performance of classification models on balance dataset using SMOTE.
https://doi.org/10.1371/journal.pone.0179805.g004
Table 6. Evaluation of the performance of classification models on imbalance dataset using theG2attributes.
ROC Kappa Recall (%) Specificity (%) Precision (%) Accuracy (%) F1-Score
G1 92.2 76.8 99.7 74.7 84.1 89.0 91.3
G2 92.2 77 99.9 74.6 84.1 89.0 91.3
showed that the weighted voting method not only improves the classification accuracy, but also has a strong generalization ability and universality [51,52].
The prediction model developed by Habibi et. al. [4] used decision tree for screening T2DM which did not require laboratory tests for T2DM diagnosis. The prediction model is designed to identify T2DM patients and healthy people (AUC = 0.717) using 22,398 records. The model was built based on diagnosis variables defined by other studies as main predictor variables (age, Body Mass Index (BMI)) while sex, systolic and diastolic blood pressure, and family history of diabetes were found to be the highest risk factors.
Three machine learning models (logistic regression, artificial neural network, and decision tree) were used by Meng et. al. [18] for predicting diabetes and pre-diabetes based on 12 risk factors and a dataset of 1,487 patients. The results obtained from the comparison among these three models was in terms of their accuracy, sensitivity, and specificity; the best accuracy achieved was by using the decision tree model (77.87%) followed by the logistic regression model (76.13%), and finally the ANN (73.23%). The increase of age, family history of diabetes, BMI, and preference for salty food increases a person’s risk of developing diabetes while educa-tion level and drinking coffee showed a negative relaeduca-tionship with the disease.
Farran et al. [53] built a model to predict the incidents of diabetes, hypertension, and comorbidity through applying machine-learning algorithms on a dataset of 13,647,408 medical records for various ethnicities in Kuwait. The result of the classification accuracy for the four techniques was relatively high (80.7%) for Logistic Regression (LR), 78.6% for K-Nearest Neighbors (KNN), 78.30% for Multi-factor Dimensionality Reduction (MDR), 81.3% for Sup-port Vector Machines (SVM), and 82% represents the result for the performance of all tech-niques collaboratively. The used models show that ethnicity is a significant factor for predicting diabetes.
In general, machine learning methods can provide great support for healthcare systems in various ways such as managing the hospital resources, recognizing high-risk patients, ranking the hospital, and improving patient care [54]. Healthcare organizations should leverage the advantage provided by machine learning tools to reduce the expenses of diabetes incidents by preventing the occurrence of the disease; thus, improving the public health and the population in general. However, one of the biggest challenges of machine learning in healthcare is that of data quality and consistency. Small dataset size, low quality of the data, incomplete data, and the lack of standardizations and interoperability may negatively affect the ability of building models that provide effective prediction.
Conclusion
Although a large body of research efforts has accumulated to design methods that can predict incident diabetes, the majority of these methods uses traditional statistical methods. Machine learning methods are increasingly gaining momentum and the attention of the healthcare community. This study shows the potential of machine learning methods for predicting inci-dent diabetes using cardiorespiratory fitness data. We have investigated 42 demographic and clinical features for (32,555) patients of the FIT Project who were non-diabetic at baseline and took the stress mill test; then they were followed up for five years. Applying the Random Under-Sampling technique showed no improvement on the five classification models used in this study. On the other hand, the SMOTE technique showed significant improvement on the prediction of all classification models prediction performance in line with the gradual increase of the percentages used. The Random Forest and NB Tree models showed greater results in all model evaluation metrics (Kappa, Recall, Precision and Specificity). The two models achieved AUC of 0.916 and 0.917, respectively. In order to further enhance the the prediction accuracy,
we used an ensembling method, specifically with the “Vote” technique that combined three decision tree classification methods (Random Forest, NB Tree, and LMT). The ensembling method improved the prediction accuracy to AUC = 0.922. The study shows the potential of ensembling and SMOTE approaches for predicting incident diabetes using cardiorespiratory fitness data. In general, our results significantly outperform the results which are reported in other reports of the literature. However, more work can be done to further increase the quality of prediction by exploring other machine learning models. In our future work, we will for vali-dating our results with other related cohorts.
Ethical approval
This article does not contain any studies with human participants or animals performed by any of the authors. The FIT project is approved by the IRB (ethics committee) of HFH hospital (IRB #: 5812).
Supporting information
S1 Appendix. Description of the final dataset. (DOCX)
Author Contributions
Conceptualization: M. Al-Mallah SS. Data curation: M. Al-Mallah. Formal analysis: M. Alghamdi. Funding acquisition: SS.
Investigation: M. Al-Mallah SK CB JE. Methodology: M. Alghamdi SS M. Al-Mallah. Project administration: M. Al-Mallah SK CB JE. Resources: M. Al-Mallah SK CB JE.
Software: M. Alghamdi SS. Supervision: SS M. Al-Mallah. Validation: SS.
Visualization: M. Alghamdi.
Writing – original draft: M. Alghamdi. Writing – review & editing: SS.
References
1. International Diabetes Federation,http://www.diabetesatlas.org.;.
2. Ryde´n L, Standl E, Bartnik M, Van den Berghe G, Betteridge J, De Boer MJ, et al. Guidelines on diabe-tes, pre-diabediabe-tes, and cardiovascular diseases: full text. European Heart Journal Supplements. 2007; 9(suppl C):C3–C74.https://doi.org/10.1093/eurheartj/ehl261
3. Juraschek SP, Blaha MJ, Blumenthal RS, Brawner C, Qureshi W, Keteyian SJ, et al. Cardiorespiratory fitness and incident diabetes: the FIT (Henry Ford ExercIse Testing) project. Diabetes Care. 2015; 38(6):1075–1081.https://doi.org/10.2337/dc14-2714PMID:25765356
4. Habibi S, Ahmadi M, Alizadeh S. Type 2 Diabetes Mellitus Screening and Risk Factors Using Decision Tree: Results of Data Mining. Global journal of health science. 2015; 7(5):304.https://doi.org/10.5539/ gjhs.v7n5p304PMID:26156928
5. Zhu M, Li J, Li Z, Luo W, Dai D, Weaver SR, et al. Mortality rates and the causes of death related to dia-betes mellitus in Shanghai Songjiang District: an 11-year retrospective analysis of death certificates. BMC endocrine disorders. 2015; 15(1):45.https://doi.org/10.1186/s12902-015-0042-1PMID:
26341126
6. Leahy S, O’Halloran A, O’Leary N, Healy M, McCormack M, Kenny R, et al. Prevalence and correlates of diagnosed and undiagnosed type 2 diabetes mellitus and pre-diabetes in older adults: Findings from the Irish Longitudinal Study on Ageing (TILDA). Diabetes research and clinical practice. 2015; 110(3): 241–249.https://doi.org/10.1016/j.diabres.2015.10.015PMID:26520567
7. Alhyas L, McKay A, Majeed A. Prevalence of type 2 diabetes in the States of the co-operation council for the Arab States of the Gulf: a systematic review. PloS one. 2012; 7(8):e40948.https://doi.org/10. 1371/journal.pone.0040948PMID:22905094
8. Williams PT. Vigorous exercise, fitness and incident hypertension, high cholesterol, and diabetes. Medi-cine and science in sports and exercise. 2008; 40(6):998.https://doi.org/10.1249/MSS.
0b013e31816722a9PMID:18461008
9. Wild S, Roglic G, Green A, Sicree R, King H. Global prevalence of diabetes estimates for the year 2000 and projections for 2030. Diabetes care. 2004; 27(5):1047–1053.https://doi.org/10.2337/diacare.27.5. 1047PMID:15111519
10. Statistics D. National diabetes information clearinghouse. Bethesda Md: National Institute of Diabetes and Digestive and Kidney Diseases, NIH publication. 1999; p. 99–3926.
11. Kononenko I. Machine learning for medical diagnosis: history, state of the art and perspective. Artificial Intelligence in medicine. 2001; 23(1):89–109.https://doi.org/10.1016/S0933-3657(01)00077-XPMID:
11470218
12. Aggarwal CC. Data classification: algorithms and applications. CRC Press; 2014.
13. Al-Mallah MH, Keteyian SJ, Brawner CA, Whelton S, Blaha MJ. Rationale and design of the Henry Ford Exercise Testing Project (the FIT project). Clinical cardiology. 2014; 37(8):456–461.https://doi.org/10. 1002/clc.22302PMID:25138770
14. Blum AL, Langley P. Selection of relevant features and examples in machine learning. Artificial intelli-gence. 1997; 97(1):245–271.https://doi.org/10.1016/S0004-3702(97)00063-5
15. Guyon I, Elisseeff A. An introduction to variable and feature selection. Journal of machine learning research. 2003; 3(Mar):1157–1182.
16. Kent JT. Information gain and a general measure of correlation. Biometrika. 1983; 70(1):163–173.
https://doi.org/10.1093/biomet/70.1.163
17. Kotsiantis SB, Zaharakis I, Pintelas P. Supervised machine learning: A review of classification tech-niques; 2007.
18. Meng XH, Huang YX, Rao DP, Zhang Q, Liu Q. Comparison of three data mining models for predicting diabetes or prediabetes by risk factors. The Kaohsiung journal of medical sciences. 2013; 29(2):93–99.
https://doi.org/10.1016/j.kjms.2012.08.016PMID:23347811
19. Stern SE, Williams K, Ferrannini E, DeFronzo RA, Bogardus C, Stern MP. Identification of individuals with insulin resistance using routine clinical measurements. Diabetes. 2005; 54(2):333–339.https://doi. org/10.2337/diabetes.54.2.333PMID:15677489
20. Breault JL, Goodall CR, Fos PJ. Data mining a diabetic data warehouse. Artificial intelligence in medi-cine. 2002; 26(1):37–54.https://doi.org/10.1016/S0933-3657(02)00051-9PMID:12234716 21. Quinlan JR. C4. 5: programs for machine learning. Elsevier; 2014.
22. Kohavi R. Scaling Up the Accuracy of Naive-Bayes Classifiers: A Decision-Tree Hybrid. In: KDD. vol. 96; 1996. p. 202–207.
23. Le Cessie S, Van Houwelingen JC. Ridge estimators in logistic regression. Applied statistics. 1992; p. 191–201.https://doi.org/10.2307/2347628
24. John GH, Langley P. Estimating continuous distributions in Bayesian classifiers. In: Proceedings of the Eleventh conference on Uncertainty in artificial intelligence. Morgan Kaufmann Publishers Inc.; 1995. p. 338–345.
25. Landwehr N, Hall M, Frank E. Logistic model trees. Machine Learning. 2005; 59(1–2):161–205.https:// doi.org/10.1007/s10994-005-0466-3
26. Sumner M, Frank E, Hall M. Speeding up logistic model tree induction. In: European Conference on Principles of Data Mining and Knowledge Discovery. Springer; 2005. p. 675–683.
28. Breiman L. Random forests. Machine learning. 2001; 45(1):5–32.https://doi.org/10.1023/ A:1010933404324
29. Batista GE, Prati RC, Monard MC. A study of the behavior of several methods for balancing machine learning training data. ACM Sigkdd Explorations Newsletter. 2004; 6(1):20–29.https://doi.org/10.1145/ 1007730.1007735
30. Menardi G, Torelli N. Training and assessing classification rules with imbalanced data. Data Mining and Knowledge Discovery. 2014; 28(1):92–122.https://doi.org/10.1007/s10618-012-0295-5
31. Ganganwar V. An overview of classification algorithms for imbalanced datasets. International Journal of Emerging Technology and Advanced Engineering. 2012; 2(4):42–47.
32. He H, Garcia EA. Learning from imbalanced data. IEEE Transactions on knowledge and data engineer-ing. 2009; 21(9):1263–1284.https://doi.org/10.1109/TKDE.2008.239
33. Poolsawad N, Kambhampati C, Cleland J. Balancing class for performance of classification with a clini-cal dataset. In: Proceedings of the World Congress on Engineering. vol. 1; 2014.
34. Wang J, Xu M, Wang H, Zhang J. Classification of imbalanced data by using the SMOTE algorithm and locally linear embedding. In: 2006 8th international Conference on Signal Processing. vol. 3. IEEE; 2006.
35. Garcı´a V, Alejo R, Sa´nchez JS, Sotoca JM, Mollineda RA. Combined effects of class imbalance and class overlap on instance-based classification. In: International Conference on Intelligent Data Engi-neering and Automated Learning. Springer; 2006. p. 371–378.
36. Jack CR, Bernstein MA, Fox NC, Thompson P, Alexander G, Harvey D, et al. The Alzheimer’s disease neuroimaging initiative (ADNI): MRI methods. Journal of Magnetic Resonance Imaging. 2008; 27(4): 685–691.https://doi.org/10.1002/jmri.21049PMID:18302232
37. Lusa L, et al. Joint use of over-and under-sampling techniques and cross-validation for the development and assessment of prediction models. BMC bioinformatics. 2015; 16(1):1.
38. Chawla NV. Data mining for imbalanced datasets: An overview. In: Data mining and knowledge discov-ery handbook. Springer; 2005. p. 853–867.
39. Refaeilzadeh P, Tang L, Liu H. Cross-validation. In: Encyclopedia of database systems. Springer; 2009. p. 532–538.
40. Kim JH. Estimating classification error rate: Repeated cross-validation, repeated hold-out and boot-strap. Computational Statistics & Data Analysis. 2009; 53(11):3735–3745.https://doi.org/10.1016/j. csda.2009.04.009
41. Kohavi R, et al. A study of cross-validation and bootstrap for accuracy estimation and model selection. In: IJCAI. vol. 14; 1995. p. 1137–1145.
42. Bengio Y, Grandvalet Y. No unbiased estimator of the variance of k-fold cross-validation. Journal of Machine Learning Research. 2004; 5(Sep):1089–1105.
43. Liu B, Fang L, Liu F, Wang X, Chen J, Chou KC. Identification of real microRNA precursors with a pseudo structure status composition approach. PloS one. 2015; 10(3):e0121501.https://doi.org/10. 1371/journal.pone.0121501PMID:25821974
44. Liu B, Fang L, Liu F, Wang X, Chou KC. iMiRNA-PseDPC: microRNA precursor identification with a pseudo distance-pair composition approach. Journal of Biomolecular Structure and Dynamics. 2016; 34(1):223–235.https://doi.org/10.1080/07391102.2015.1014422PMID:25645238
45. Zhang Y, Zhang H, Cai J, Yang B. A weighted voting classifier based on differential evolution. In: Abstract and Applied Analysis. vol. 2014. Hindawi Publishing Corporation; 2014.
46. Liu B, Wang S, Dong Q, Li S, Liu X. Identification of DNA-binding proteins by combining auto-cross covariance transformation and ensemble learning. IEEE transactions on nanobioscience. 2016; 15(4):328–334.https://doi.org/10.1109/TNB.2016.2555951
47. Liu B, Long R, Chou KC. iDHS-EL: identifying DNase I hypersensitive sites by fusing three different modes of pseudo nucleotide composition into an ensemble learning framework. Bioinformatics. 2016; 32(16):2411–2418.https://doi.org/10.1093/bioinformatics/btw186PMID:27153623
48. Liu B, Wang S, Long R, Chou KC. iRSpot-EL: identify recombination spots with an ensemble learning approach. Bioinformatics. 2017; 33(1):35–41.https://doi.org/10.1093/bioinformatics/btw539PMID:
27531102
49. Song L, Li D, Zeng X, Wu Y, Guo L, Zou Q. nDNA-prot: identification of DNA-binding proteins based on unbalanced classification. BMC bioinformatics. 2014; 15(1):298. https://doi.org/10.1186/1471-2105-15-298PMID:25196432
50. Wang C, Hu L, Guo M, Liu X, Zou Q. imDC: an ensemble learning method for imbalanced classification with miRNA data. Genetics and Molecular Research. 2015; 14(1):123–133.https://doi.org/10.4238/ 2015.January.15.15PMID:25729943
51. Quinlan JR. Induction of decision trees. Machine learning. 1986; 1(1):81–106.https://doi.org/10.1007/ BF00116251
52. Seni G, Elder JF. Ensemble methods in data mining: improving accuracy through combining predic-tions. Synthesis Lectures on Data Mining and Knowledge Discovery. 2010; 2(1):1–126.https://doi.org/ 10.2200/S00240ED1V01Y200912DMK002
53. Farran B, Channanath AM, Behbehani K, Thanaraj TA. Predictive models to assess risk of type 2 diabe-tes, hypertension and comorbidity: machine-learning algorithms and validation using national health data from Kuwait—a cohort study. BMJ open. 2013; 3(5):e002457. https://doi.org/10.1136/bmjopen-2012-002457PMID:23676796
54. Tomar D, Agarwal S. A survey on Data Mining approaches for Healthcare. International Journal of Bio-Science and Bio-Technology. 2013; 5(5):241–266.https://doi.org/10.14257/ijbsbt.2013.5.5.25