Recebido: 15/05/2017 Aceito: 06/12/2017
ESTIMATION OF THE WET BULB GLOBE TEMPERATURE FROM
TEMPERATURE AND RELATIVE HUMIDITY GRADIENTS
1Osvaldo Borges Pinto Junior, 2Sérgio Wagner Gripp Silveira, 1Carlo Ralph De Musis, 3Luiz Annunciação e Osvaldo Alves Pereira
1Universidade de Cuiabá, Brasil
2Instituto Nacional de Pesquisas Espaciais, Brasil 3Instituto Federal do Estado de Mato Grosso, Brasil
Abstract
In this study, maps of the estimated heat index for a preservation area in the city of Cuiabá, Mato Grosso, Brazil, were constructed using temperature and relative humidity gradients. Understanding microclimate variable behavior is useful for explaining the relationship between urban sprawl and increased environmental distress. The implementation and preservation of green areas is one way to mitigate the environmental impacts of human activities. Urban parks are one common type of green area in cities. According to ISO 7243, heat exposure can be assessed using the Wet Bulb Globe Temperature (WBGT). This study used multivariate statistical techniques and ordinary kriging to produce a WBGT map of the park during the dry and rainy seasons. Places with heat or
freshness islands were identified. Locations along hiking trails and areas with exercise equipment were analyzed
for WBGT tendencies in order to propose precautionary heat exposure measures.
1 Introduction
Large cities create a host of problems related to environmental quality. Naturally occurring phenomena, such as variations in rainfall regime and temperature inversions, can be enhanced. Industrial activity and transportation cause air pollution. Urban heat islands, with their increased heat generation, can cause thermal discomfort, increased energy consumption, changes in ventilation and humidity, and possible compromises in thermal equilibrium at larger scales.
In order preserve a large existing savannah area in the city of Cuiabá — the state capital of Mato Grosso, Brazil—the Mãe Bonifácia park (MBP) was created on July 9, 2000. It is currently an important recreational area for the Cuiabá citizens, where they often exercise, hike, and hold events, among other activities.
Heat stress evaluation is generally determined through meteorological parameters that enable the estimation of the influence
of several environmental factors on thermal comfort and physiological ability. The wet bulb globe temperature (WBGT) is an empirical index and does not have a physiological basis as the physiological equivalent temperature (PET). However, because International Organization for Standardization standards employ the WBGT as an index for estimating heat stress on workers it is one of the most widely used heat stress indices (ISO 7243, 1989; PARSONS, 2006). In addition, there are research works that have investigated the relationship between the thermal environment and heart diseases risks (MAYER & HÖPPE, 1987; BUDD, 2008; OHASHI ET AL., 2014). We therefore employed the WBGT as the heat index for the present study.
A common technique for data collection is the use of a mobile transect. A psychrometer with globe thermometer takes a
minimum of 30 minutes to equilibrate with the surroundings, making it difficult to take mobile transects of humidity data. Hence, in this work, we use an alternate device that allows collection of temperature and relative humidity profiles with an
equilibration of 10 seconds, much faster than conventional devices. The technique uses georeferenced measurements to estimate the Wet Bulb Globe Temperature (WBGT) by way of a geostatistical model, quadratic regression, and principal component analysis, enabling the construction of transects.
2 Materials and methods
2.1 Study areas
The MBP located in the western region of Cuiabá, Mato Grosso, between the geographical coordinates 15º34’44” S and 56º05’016” W. The 77.16 hectares park is managed by the State Government.
Four characteristic points were selected for a discussion of the results obtained (Figure 1). Point 1 is located in a popular area with exercise equipment. The ground is covered with cement, but the area is close to a wooded preserved with large trees.
Point 2 is close to a paved avenue with heavy vehicle traffic. Point 3 is located near a valley shaded by medium-sized trees
and between two freshness islands. Point 4 is located in an area with low tree cover, asphalt surfaces, a small strip of bare soil, and small trees spaced far apart.
Vegetation is a factor that influences temperatures along the trails. According to Vilanova and Guarim (2008), the park
vegetation consists of Savanna (Cerrado) formations distributed in at least three distinct layers: gallery forest, savanna forest, and bush land. The gallery forest (along the watercourse), and the savanna forest (over a valley away from the watercourse) are forest formations consisting of large, evergreen species that contribute to the process of evapotranspiration and shading throughout year round. The gallery and savanna forests occurring near Point 3 were upright in form, while the gallery forest
found near Point 1 had an altered form. Savanna occurs at higher elevations in the park, and is made up of medium-sized trees
and shrubs (VILANOVA and CHICHORRO, 2014).
2.2 Transect
The use of this technique requires care in determining the duration of a trip, since for long routes the time difference between the first and the last measurement can be significant. For best results, collection times should not exceed 1 hour (SUGAWARA
et al., 2015; LIU et al, 2016; WANG et al., 2016).
The paths of transects were not exactly same, due to related operational issues unavailability of trails due to maintenance work in the park, but seek similar and equally representative routes.
2.3 Instrumentation
The data collection and storage system was based on the Arduino standard and can be used in conjunction with other de
-vices (subject to compliance with the pinout and voltage supply). The device was set up in a shelter on wheels that had three psychrometers with a 1 second minimum response time attached at heights of 1 m, 1.5 m, and 2.0 m. A GPS was placed on the roof. This entire system is referred to as the Data Logger in this paper. The WBGT was estimated by a Globe Thermometer
1 Introduction
ITWTG-2000 with a 30 minutes response time. 2.4 Modeling
WBGT index presented in (1) includes three variables of thermal comfort: black globe temperature (GT) which reflects the
solar radiation, natural wet bulb temperature (NWB), and dry bulb temperature (DB). (ISO 7243, 1989; PARSONS, 2006).
WGBT = 0.7 NWB + 0.2 GT - 0.1 DB
(1)
Although GT gives an assessment of solar radiation, the calculation of WBGT involves measuring GT from a thermometer surrounded by a 6” blackened sphere, which is inconvenient and simply not practical to use under many circumstances. Fur
-thermore, measuring GT by a black globe thermometer requires about 20–30min for the instrument to reach equilibrium. A model was developed for estimating the WBGT from the data collected by fast response microsensors in a gradient, with a 10 Figure 1 - Site map
second sample time, in a newly developed Data Logger.
The models and statistical experiments were operationalized with the support of IBM SPSS 23 and ArcGIS 9.3. A calibra -tion experiment was first prepared by collecting data using a compound apparatus consisting of three Kestrel 4500 sta-tions at
the same heights as the psychrometers. Data was collected simultaneously with the Data Logger along a transect of the MBP.
Calibration was completed by applying the Wilcoxon test for paired samples (α >> 5%) and a Kendall correlation (ρ = 0.999, α < 0.001). (AIROLA et al., 2011)
After calibration of the Data Logger, measurements of temperature and relative humidity profiles were collected in various parts of the city at different times (randomized). Locations were chosen with varying characteristics in terms of topography
and land use (woody, bare soil, and covered ground). Variability in WBGT was sought.
Data were collected at thirty-three points around the park, with varying ground cover, vegetation, and ventilation profiles.
In order to reduce the dimensionality of the data collected, a decomposition model by principal component analysis (PCA) was
applied, obtaining a reduction of the dimensionality of the data to one principal component (C1) corresponding to 93.529% of
data variability (HAIR et al., 2006). The model of estimation of WBGT, a quadratic regression model, was applied between the
estimated WBGT and C1 (R2 = 0.726, α < 1%). The assumptions of auto-correlation, normal distribution, and data homosce-dasticity were evaluated by the Durbin-Watson procedure (DW = 2.1, α > 5%), the Kolmogorov-Smirnov test (α > 5 %), and the Wald-Wolfowitz test (α > 5%), respectively (TAN et al., 2016).
The climate of Cuiabá is mainly driven by large scale climatological phenomenon and characterized by two distinct seasons, a dry (May to September) and a wet (October to April). According to Machado et al. (2015, p.12),
The interannual variability of precipitation is driven by meso-large scale atmospheric system, such as cold fronts, SACZ, ITCZ. The peak of solar radiation is reached on the beginning of summer season and it is basically due to astronomical factors. Maximum and minimum average temperatures present the same standard of solar radiation reaching its values in November and July, respectively. Other important factor was the predominance of friagem during the winter (dry season) that decreases the average temperature. Highest values of relative humidity occur during the rainy season, mainly due to the SACZ and the Continental Tropical Mass. On the other hand, lowest values of relative humidity occur during the dry season due to the displacement of atmospheric systems, as well as the total inhibition of others, such Bolivia High Pressure. The wind speed is low in Cuiaba and had no seasonal variation due to the topography. The wind direction is predominantly from N during whole year. Although, South direction frequency is commonly observed during the winter season due to the advance of polar mass through the continent.
The Data Logger traveled pre-established routes on typical days, in the rainy and dry seasons during morning and evening periods (OKE, 2004).
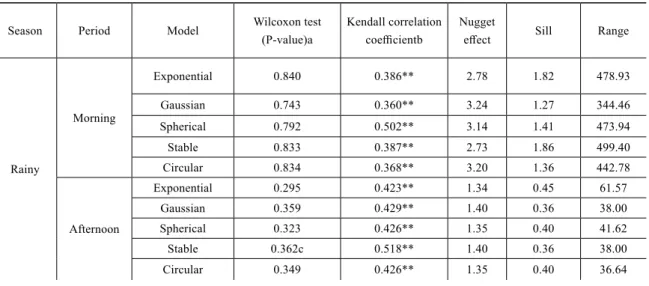
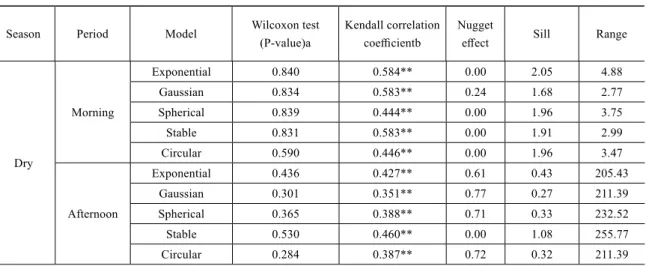
The data were used to obtain point estimates of georeferenced WBGT. The semivariographic adjustment referenced expo -nential, Gaussian, spherical, and stable models. The cross-validation procedure of the model calibrated 70% of the data, and validated the remaining 30%. The calibration and validation of the semivariographic models was carried out by the Wilcoxon test for paired values and Kendall correlation (Table 1). The best-fit models were used for ordinary kriging of data collected
on a mobile transect.
Table 1 – Cross-validation
Season Period Model Wilcoxon test
(P-value)a
Kendall correlation coefficientb
Nugget
effect Sill Range
Rainy Morning Exponential 0.840 0.386** 2.78 1.82 478.93 Gaussian 0.743 0.360** 3.24 1.27 344.46 Spherical 0.792 0.502** 3.14 1.41 473.94 Stable 0.833 0.387** 2.73 1.86 499.40 Circular 0.834 0.368** 3.20 1.36 442.78 Afternoon Exponential 0.295 0.423** 1.34 0.45 61.57 Gaussian 0.359 0.429** 1.40 0.36 38.00 Spherical 0.323 0.426** 1.35 0.40 41.62 Stable 0.362c 0.518** 1.40 0.36 38.00 Circular 0.349 0.426** 1.35 0.40 36.64
continuation...
Dry Morning Exponential 0.840 0.584** 0.00 2.05 4.88 Gaussian 0.834 0.583** 0.24 1.68 2.77 Spherical 0.839 0.444** 0.00 1.96 3.75 Stable 0.831 0.583** 0.00 1.91 2.99 Circular 0.590 0.446** 0.00 1.96 3.47 Afternoon Exponential 0.436 0.427** 0.61 0.43 205.43 Gaussian 0.301 0.351** 0.77 0.27 211.39 Spherical 0.365 0.388** 0.71 0.33 232.52 Stable 0.530 0.460** 0.00 1.08 255.77 Circular 0.284 0.387** 0.72 0.32 211.39
a Estimated for 1000 samples by the Monte Carlo method. b Estimated by 1000 bootstrap resamplings.
C Selected models for the preparation of maps in bold. **p < 0.01.
During the rainy season, WBGT values varied from 26.5 to 32.23 in the morning, and from 28.18 to 33.21 in the afternoon. In the dry season, WBGT values varied from 23.93 to 31.00 in the morning, and from 24.49 to 30.58 in the afternoon.
Above a WBGT the upper threshold provided by ISO 7243 (1989) for heat exposure tolerance, limiting moderate and heavy activity is the only control measure available when outdoors. Since the MBP is often used for exercise, people in the park would need to be given guidelines for limiting activity at high WBGT. Walking speed would need to be limited to a level where it is possible to maintain a conversation, and heavier exercises such as running would not be permitted.
During the rainy season mornings (Figure 2), the WBGT was 26.5 at Point 1, located in a very frequent environment, are
willing to exercise, their soil and lined with cement, and is close to a well-preserved forest with large trees, featuring a freshness island suitable for physical exercise outdoors. Point 2, being near the Miguel Sutil Avenue an asphalted road with great flow
of vehicles, had WBGT ranging from 30.84 to 32.23, high enough to limit moderate and heavy activity.
Points 3 and 4 had WBGT near 28, low enough to allow light and moderate activity. In this place, the trail has little
affo-restation, with the soil covered with asphalt and a small strip of bare soil. Vegetation predominates characteristics of Savanna (Cerrado) with small tree and well spaced making spaces with few shadows.
During the rainy season in the afternoon (Figure 3), one can observe the prevalence of heat islands along the length of the tracks, with WBGT ranging from 28.18 to 33.21. On the trail between Points 1 and 2, WBGT remains around 32, since the sun position causes solar radiation to fall directly on the track around 16:30 hours. When walking outside, air temperature increases and decreases repeatedly. At Point 3, there is a freshness island, with WBGT around 28, possibly related to shading. But, in Point 4, there are higher values, around 31, because there is little solar radiation interception by the small trees that prevail there. Point 3 is the only location with suitable conditions for light outdoor activity. Its structure is also similar the presence of freshness island, here also to the northwest and southeast. The zones of heat are more pronounced, crossing completely the
Park in the direction northeast-southwest, presenting an outstanding island of heat to the northeast.
During the dry season in the morning (Figure 4), the WBGT index ranged from 23.91 to 31.00. Heat and freshness islands are well distributed, interspersed throughout the trail route. The WBGT at Point 1 was around 30. As is characteristic this time of year, the decrease in leaf area index at this wooded site allowed more insolation through than during the wet season. The WBGT was approximately 27 at Point 2, probably due to the presence of trees near the trail, and 24 at Point 3, indicating freshness islands where light to heavy physical activity could be performed (ROSHAN et al., 2017). At Point 4, due to the relief and angle of incidence, the solar radiation was maximized, leading a WBGT ranged from 28.43 to 31.00, indicative of heat island.
During the dry season in the afternoon (Figure 5), most of the tracks have a WBGT of 30, a value typical of heat islands. Points 2 and 4 recorded higher heat index values, and are therefore tracks that should be avoided for exercise. Points 1 and 3 obtained WBGT values between 24.49 and 25.95, indicative of freshness islands where light to moderate activity could be performed.
Further studies should focus on the human energy budget as it relates to outdoor thermal comfort. Among the environmental
factors that influence the human energy budget, solar radiation is one of the most influential factors as well as air temperature
in the outdoor thermal environment (JEONG ET AL., 2016).
It is also important to consider that Points 1, 2 and 4 are close to the park boundary, and therefore the grand boulevards and buildings that surround it. In structural terms, a greater homogenization was observed: the triangular shaped heat island, observed for the raining season, widened, taking all frontier to the northeast
of the Park and the islands of freshness
Table 1 - continuation
Season Period Model Wilcoxon test(P-value)a
Kendall correlation coefficientb
Nugget
Figure 2 – WBGT during the rainy season in the morning
Figure 5 – WBGT during the dry season in the afternoon Figure 4 – WBGT during the dry season in the morning
united to form a U-shaped region, with base southwest of the park.
According to Ali et al. (2016), energy storage increases due to components of the urban fabric that contribute to maintaining the elevated air temperature. The concurrent removal of vegetation and reduction of liquid surfaces decreases evapotranspi -ration rates, which makes cooling more difficult. Air pollution and heat introduced by urban activities further contribute to raising the local temperature. However, as the improvement of trees on thermal comfort is not as significant as lawn. This is
mainly because trees can reduce the outdoor wind speed, making the heat accumulation phenomenon appeared and decreasing people’s comfort. (ZHENG ET AL., 2016)
Possibly, air pollution as well as the introduction of heat by the urban activities would contribute to raise the thermal sen -sation, leading to the predominance of WGBT values classified as uncomfortable (greater than 26ºC).
3 Conclusions
Estimation of WBGT from the combined use of principal component analysis and quadratic regression was proposed as an alternative to the use of globe thermometers. The estimation method made it possible to collect data along mobile transects and
to construct gradient maps. The WBGT maps obtained by ordinary Kriging were of high quality, and allowed for the detection
of freshness and heat islands, and helps establish a safe and successful use of the space. In all combinations between Season and Period, the presence of vegetation in the islands of freshness, was a favorable factor. Therefore, further studies should be conducted to investigate the role of green spaces in an urban area as well as the relationship between urban structure complexes and the actual human thermal responses, both psychological and physiological.
References
AIROLA, A.; PAHIKKALA, T.; WAEGEMAN, W.; DE BAETS, B.; SALAKOSKI, T. An experimental comparison of cross-validation techniques for estimating the area under the ROC curve. Computational Statistics & Data Analysis, V. 55, Issue 4, 2011, P. 1828-1844.
ALI, J. M.; MARSH, S. H.; SMITH, M. J. Modelling the spatiotemporal change of canopy urban heat islands. Building and Environment, V. 107, 2016, P. 64-78.
MACHADO, N.; BIUDES, M. S.; QUERINO, C. A. S.; DANELICHEN, V. H. M.; VELASQUE, M. C. S. Seasonal
and interannual pattern of meteorological variables in Cuiabá, Mato Grosso State, Brazil. Brazilian Journal of
Geophysics, Vol. 33(3), p. 1-12, 2015.
BUDD, G. Wet-bulb globe temperature (WBGT) — its history and its limitations. Journal of Science and Medicine in Sport, 2008, v. 11, 20-32.
ISO 7243. Hot enviroments estimation of the heat stress on working man, based on the WBGT index (wet bulb
globe temperature). International Organization for Standardization, Geneva, 1989.
JEONG, M.; PARKA, S.; SONG, G. Comparison of human thermal responses between the urban forest area and the central building district in Seoul, Korea. Urban Forestry & Urban Greening, V. 15, 2016, P. 133-148.
LIU, L.; LIN, Y.; WANG, D.; LIU, J. An improved temporal correction method for mobile measurement of outdoor thermal climates. Theoretical and Applied Climatology, 2016, p. 1-12.
MAYER, H.; HÖPPE, P. Thermal comfort of man in different urban environments, Theor. Appl. Climatol. 38, v. 1, 1987, 43-49.
OHASHI, Y.; KIKEGAWA, Y; IHARA, SUGIYAMA, T. Numerical simulations of outdoor heat stress index and
heat disorder risk in the 23 wards of Tokyo, J. Appl. Meteorol. Climatol. 53 (2014) 583–597.
OKE, T. R. Initial Guidance to Obtain Representative Meteorological Observations at Urban Sites. Instruments
and Methods of Observation Program, IOM Report No. 81, WMO/TD 1250, World Meteorological Organization, Geneva, Switzerland , 2004. Disponível em: https://www.wmo.int/pages/prog/www/IMOP/publications/IOM-81/ IOM-81-UrbanMetObs.pdf. Acesso em 4 de dezembro de 2017.
3 Conclusion
PARSONS, K. Heat stress standard ISO 7243 and its global application, Ind. Health, V. 44, v. 3, 2006, 368-379.
ROSHAN, G. R.; GHANGHERMEH, A. A.; ATTIA, S. Determining new threshold temperatures for cooling and
heating degree day index of different climatic zones of Iran. Renewable Energy, V. 101, 2017, P. 156-167.
SUGAWARA, H.; SHIMIZU, S.; TAKAHASHI, H.; HAGIWARA, S.; NARITA, K.; MIKAMI, T.; HIRANO, T.
Thermal Influence of a Large Green Space on a Hot Urban Environment. J. Environ. Qual. ,45:125-133, 2016. TAN, K. C.; LIM, H. S.; JAFRI, M. Z. M. Prediction of column ozone concentrations using multiple regression analysis and principal component analysis techniques: A case study in peninsular Malaysia. Atmospheric
Pollution Research, V. 7, Issue 3, 2016, P. 533-546.
VILANOVA, S.R.F; CHICHORRO, J. F. Cerrado: aspectos Florísticos e estruturais. IN: GUARIM, V.L.M.S.; VILANOVA, S.R.F. (Orgs.). Parque da cidade: aspectos socioambientais: Mãe Bonifácia. Cuiabá: EdUFMT, 2014.
133 p.
WANG, Y.; DE GROOT, R.; BAKKER, F.; WÖRTCHE, H.; LEEMANS, R. Thermal comfort in urban green spaces:
a survey on a Dutch university campus. Int J Biometeorol, 2016.
ZHENG, S.; ZHAO, L.; LI, Q. Numerical simulation of the impact of different vegetation species on the outdoor
thermal environment. Urban Forestry & Urban Greening, V. 18, 2016, P. 138-150.
Osvaldo Borges Pinto Junior Universidade de Cuiabá, Brasil
Email: [email protected]
Participação do autor: calibração e instrumentação dos equipamentos bem como na revisão e tradução do texto enviado
Sérgio Wagner Gripp Silveira Instituto Nacional de Pesquisas Espaciais, Brasil
Email: [email protected]
Participação do autor: semivariograma e validação cruzada para os períodos de estudo (seco: manhã e tarde; chuvoso: manhã e tarde). Também na elaboração dos mapas
(WBGT) usando Krigagem com o modelo de semivariograma escolhido para cada
período. Carlo Ralph De Musis Universidade de Cuiabá, Brasil
Doutor em Educação na Universidade Católica de São Paulo, Email: [email protected]
Participação do autor: análise dos resultados, construção do aparato, e redação. Luiz Annunciação
Instituto Federal do Estado de Mato Grosso, Brasil Email: [email protected]
Participação do autor: coleta de dados, construção do aparato, análise dos resultados e redação.
Osvaldo Alves Pereira Email: [email protected]