ZAFAR GILANI,
Department of Computer Science and Technology, University of Cambridge, UKREZA FARAHBAKHSH,
Institut Mines-Télécom, Télécom SudParis, CNRS Lab UMR5157, FranceGARETH TYSON,
Queen Mary University of London, UKJON CROWCROFT,
Department of Computer Science and Technology, University of Cambridge, UK Recent research has shown a substantial active presence of bots in online social networks (OSNs). In this paper we perform a comparative analysis of the usage and impact of bots and humans on Twitter — one of the largest OSNs in the world. We collect a large-scale Twitter dataset and define various metrics based on tweet metadata. Using a human annotation task we assign ‘bot’ and ‘human’ ground-truth labels to the dataset, and compare the annotations against an online bot detection tool for evaluation. We then ask a series of questions to discern important behavioural characteristics of bots and humans using metrics within and among four popularity groups. From the comparative analysis we draw clear differences and interesting similarities between the two entities.CCS Concepts: •Information systems→Social networks; •Networks→Network measurement; Additional Key Words and Phrases: bot characterisation; behavioural analysis; bot network traffic; bot generated content
ACM Reference Format:
Zafar Gilani, Reza Farahbakhsh, Gareth Tyson, and Jon Crowcroft. 2018. A Large Scale Behavioural Analysis of Bots and Humans on Twitter.ACM Trans. Web1, 1 (December 2018),24pages.https://doi.org/0000001.0000001
1 INTRODUCTION
Bots(automated agents) exist in vast quantities in online social networks. They are created for a number of different purposes,e.g.news, marketing [16], link farming,1political infiltration [5,22] spamming and spreading malicious content. The rise of bots on Twitter is evidenced by a number of studies [21,35], and articles.2This constitutes a radial shift in the nature of content production, which has traditionally been the realm of human creativity (or at least intervention). Although there have been past studies on various aspects of bots (§2), we are particularly interested in exploring their role in the wider social ecosystem, and how their behavioural characteristics differ from humans. This is driven by many factors. The limited cognitive ability of bots clearly plays a major role, however, it is also driven by their diverse range of purposes, ranging from curating news to 1Link farming –http://observer.com/2014/01/fake-traffic-means-real-paydays/
2Bots in press and blogs –https://www.cl.cam.ac.uk/~szuhg2/docs/papers/bots-discussions.txt
Authors’ addresses: Zafar Gilani, Department of Computer Science and Technology, University of Cambridge, Cambridge, CB3 0FD, UK, [email protected]; Reza Farahbakhsh, Institut Mines-Télécom, Télécom SudParis, CNRS Lab UMR5157, 9 rue Charles Fourier, Evry, 91011, France, [email protected]; Gareth Tyson, Queen Mary University of London, London, UK, [email protected]; Jon Crowcroft, Department of Computer Science and Technology, University of Cambridge, Cambridge, CB2 1TN, UK, [email protected].
Permission to make digital or hard copies of all or part of this work for personal or classroom use is granted without fee provided that copies are not made or distributed for profit or commercial advantage and that copies bear this notice and the full citation on the first page. Copyrights for components of this work owned by others than ACM must be honored. Abstracting with credit is permitted. To copy otherwise, or republish, to post on servers or to redistribute to lists, requires prior specific permission and/or a fee. Request permissions from [email protected].
© 2018 Association for Computing Machinery. 1559-1131/2018/12-ART $15.00
answering customer queries. This raises a number of interesting questions regarding how these bots operate, interact and affect online content production: What are the typical behaviours of humans and bots, in terms of their own activities as well as the reactions of others to them? What interactions between humans and bots occur? How do bots affect the overall social activities? These questions have implications for many fields such as social media analysis and systems engineering. Beyond the social implications, the combined popularity of social media and online bots may mean that a significant portion ofnetwork trafficcan be attributed to bots. This conjecture is not without support: according to one estimate, 51.8% of all Web traffic is generated by bots.3This, again, constitutes a radical shift from traditional views on web traffic bringing about both new research questions and engineering opportunities. Can we adapt our network and content delivery infrastructure to better meet their needs, and mitigate overheads? The latter is of particular impor-tance, as the above preliminary evidence seems to suggest that much of our network congestion is created by bots (that perform low priority work).
To answer the above questions, we build on our previous work [25] to perform a large-scale measurement and analysis campaign of Twitter (§3). We focus on bots in Twitter because it largely exposes public content, and past studies indicate a substantial presence of bots [11]. Addressing existing limitations of automated bot detection algorithms, we utilise a human annotation task to manually identify bots, providing us with a large ground-truth for statistical analysis. We offer a new and fundamental understanding of the characteristics of botsvs.humans, observing a number of clear differences (§4). For example, we find that humans generate far more novel content, while bots rely more on retweeting. We also observe less intuitive trends, such as the propensity of bots to tweet more URLs, and upload bulkier media (e.g.images). We also see divergent trends between different popularity groups (based on follower counts), with, for example, popular celebrities utilising bot-like tools to manage their fanbase. We then move on to explore the types of network traffic that bots may induce by sharing content and links (URLs) via Twitter. Specifically, this involves inspecting (i) the amount of data traffic bots generate on Twitter, and (ii) the nature of this traffic in terms of media type,i.e.URL, photo (JPG/JPEG), animated image (GIF), and video (MP4). We briefly touch upon on the possibilities of how this ever-increasing bot traffic might affect networked systems and their properties. Finally, we analyse the social interconnectedness of bots and humans to characterise how they influence the wider Twittersphere (§5). We observe that, although human contributions are considered more important via typical metrics (e.g.number of likes, retweets), bots still sustain significant influence over content production and propagation. Our experiments confirm that the removal of bots from Twitter could have serious ramifications for information dissemination and content production on the social network. As well as providing a powerful underpinning for future bot detection methods, our work makes contributions to the wider field of social content automation. Such understanding is critical for future studies of social media, which are often skewed by the presence of bots.
2 RELATED WORK
In this study we focus on characterising and comparing botsvs.humans to understand their key behavioural traits. Hence, we do not distinguish based on factors such as spam or fake information, because bots could belong to credible organisations and human accounts could be linked with spam or fake content. Similarly, we do not focus on bot detection technologies as, for us, the detection step is a precursor to our analysis rather than our core focus. Our intent is to provide a generic analysis by discerning the operating nature of the user account and not its intent. Consequently,
two main streams of research are relevant this paper: (i) social, demographical and behavioural analyses of either bots or humans; and (ii) impact analyses of bots in social environments.
Social analysis of bots or humans.The first step when performing an analysis of bots is
to devise mechanisms to effectively detect their presence. There are various techniques for this. Chavoshiet al.propose a technique to detect Twitter bots by cross-correlating user activities [9]. Their work is based on the premise that accounts that are unlikely to be human operated have abnormal activities, such as repeated behaviour, discords and bursts [10]. Their technique uses lag-sensitive hashing and a correlation measure for detection and does not require labelled data. The authors implement their technique into Debot [8] and BotWalk [28], both of which use an unsupervised ensemble anomaly detection method. The authors achieve a precision of 94% in detecting unique bots, as well as helping to identify 6000 bots a day. In our own evaluation (see
3.4.1), we found a lower accuracy with Debot, although we posit that this may be due to changes in
bot behaviour since its creation. Another tool by Chavoshiet al.collects, detects and maintains a list of cross-correlated accounts during certain time periods. This is effective in many settings, although is not applicable to our data as it depends on maintaining statistics on a much wider set of accounts.
Cresciet al.explored social behaviours of Twitter users by employing DNA-based behavioural modelling in [13], although they found little to no similarities among Twitter users. They concluded that Twitter users cannot be considered uniformly random. Using the DNA-based social fingerprint-ing technique, the authors in another piece of work [15] posit that more accurate spambot detection can be achieved via an in-depth analysis of collective behaviours. In another study, Cresciet al. used a similarity measure for social fingerprints to distinguish genuine users and spambots [19]. While we also study user behaviour we do not distinguish between bots and spambots, nor is our focus on bot detection. Instead, we perform an in-depth analysis by using a range of attributes across a popularity-based partitioned dataset.
Leeet al.performed a long-term study of general content polluters on Twitter [27]. The re-searchers accomplished this by deploying 60 social bot-driven honeypots for seven months. They provide a detailed examination of 36000 harvested content polluters including analysis of link payloads, user behaviour, and follower-following network dynamics. Four main categories of content producers were discovered: (i) duplicate spammers (that post near identical tweets); (ii) duplicate @ spammers (post near identical content and misuse Twitter’s @username system); (iii) malicious promoters (which use more sophisticated language for posting tweets about online business, marketing and finance); (iv) friend infiltrators (they engage in spam once they have acquired a large mass of legitimate Twitter users). Our work differs in that we do not focus on the content of the tweets but, rather, the features of the bots that tweet them.
A similar work, but along the lines of human-bot interaction, was carried out by Murgiaet al.[30]. In this work the authors used a bot emulating an ordinary user to answer user questions on Stack Overflow. They carried out two experiments, one in which the bot was impersonating a human, and the other in which the bot revealed its machine identity. Answers from human-impersonating bot were: accepted 8% (4 out of 50), up-voted 28% (14 out of 50), and down-voted 14% (7 out of 50) times. Comparatively, answers from the bot revealing its machine identity were: accepted 8% (1 out of 13), never up-voted, and down-voted 23% (3 out of 13) times. Despite being functionally identical, the two identities elicited different reactions. This is a fascinating line of study, although one that is orthogonal to our own. Researchers have also inspected bot or human behaviour. For example, [6] examined the retweet behaviour of people, focussing onhow people tweet, as well aswhy and what people retweet. The authors found that participants retweet using different styles, and for diverse reasons (e.g.for others or for social action). This is relevant to our own work, as we also study retweets although our focus is on comparing botsvs.humans (rather than focussing on just one).
Our work therefore provides further insights on important differences and striking similarities between bots and humans in terms ofretweet patterns,account lifetime,content creation,content popularity,entity interaction,content consumption,account reciprocity, andcontent propagation.
There has also been work on the human perception of bots. For instance, Cresciet al.tested known bots on Twitter to see if they are perceived differently than humans [14]. The researchers employed 240 human participants and divided them into two treatment groups,i.e.one for viewing mock Twitter pages with tweets by bots, and the other for viewing mock Twitter pages with tweets by humans. After viewing the Twitter page each participant would then score credibility, interpersonal interaction, and demographics among other things. The bots scored closely to humans for competence, character, social attraction, and communication. The experimental study concluded that bots were perceived as a credible source of information in most cases by human participants. In our study we also show the similarities that exist between bots and humans and highlight features where bots have outperformed humans, but we do not create fake or bot profiles4and instead rely on the data collected from Twitter.
Social influence of bots.The above studies primarily inspect the characteristics of bots. There
has also been work inspecting the social influence of bots,i.e.how other users react to them and how they impact the surrounding Twittersphere. In [2], the authors use a bot on aNobii, a social networking site aimed at readers, to explore thetrust,popularityandinfluenceof bots. They show that gaining popularity does not require individualistic user features or actions, but rather simple social probing (i.e.bots following and sending messages to users randomly). The authors also found that an account can circumvent trust if it is popular (since popularity translates into influence). The results confirm that bots can have a profound effect on online social media environments. Closely related is [34], which developed models to identify users who aresusceptibleto social bots,i.e.likely to follow and interact with bots. The authors use a dataset from the Social Bot Challenge 2011, and make a number of interesting observations,e.g.that users who employ more negation words have a higher susceptibility level. Recent work [24] has also shown the impact of bots on Twitter activity using a non-infiltrating honeypot experiment. In this paper, we do not use honeypots or create bots ourselves; instead, we perform a wider-scale analysis of existing bots. These two complementary approaches yield different results; for example, whereas [2] reveals how popular bots can gain influence, we provide a wider viewpoint across many different popularity groups.
There have also been several interesting studies looking at domain-specific bot activities. For instance, Cresciet al.[17] focused on Twitter bot activities in stock markets and observed malicious practices perpetrated by coordinated groups. These aim at promoting low-value stocks by exploiting the popularity of high-value ones. A similar study in [29] explored the impact of Twitter bots on diffusion of information. Authors coordinated a set of 39 Twitter bots to monitor the behaviour of popular target users based on the interactions that they generated. More disturbingly, bots have been found to influence political scenes and democratic procedures; several studies have demonstrated the influence [7] and impact [5] of bots when attempting to proliferate an opinion. In another study [4], the authors employed a set of social bots in a hybrid crowdsourcing fashion for humanitarian purposes. These important studies have offered key insights into particular domains, although we emphasise that our goal is to offer a more generalisable insight into the bounds of bot activities, rather than the specifics of individual bot behaviours. That said, we do take inspiration from the feature-sets used within these past workse.g.tweeting behaviour and follower-friend circles. In our work, we study the characteristics of existing bots in detail and argue that this provides far broader vantage into real bot activities. Hence, unlike studies that focus on the influence of individual bots
(e.g.the Syrian Civil War [1]), we gain perspective on the wider spectrum of how bots and humans operate, and interact.
To the best of our knowledge, we are the first to perform a methodical comparison of repre-sentative metrics across the two main types of Twitter accounts, offering a thorough comparison between bots and humans. We focus on similar features to that used by existing bot detection tools, however, rather than utilising these for bot classification, we collect and analyse these features to build up a comprehensive understanding on botvs.human behavioural characteristics.
3 METHODOLOGY
We use and build upon our previous workStweeler5[26] for data collection, pre-processing, feature
extraction, bot classification through human annotation, and analysis. We define a ‘bot’ as any account thatconsistentlyinvolves automation over the observed period,e.g.use of the Twitter API or other third party tools, performing actions such as automated likes, tweets, retweets,etc. Note that atweetis an original status and not a retweet (we differentiate original tweets and retweets using the tweet metadata returned from the Streaming API), and astatusis either a tweet or a retweet. Also note thatcontenton Twitter is limited to whatever is contained within a tweet: text, URL, image, and video.
3.1 Data Collection
To collect a representative OSN dataset, we have selected Twitter because it is open, large-scale and is known to contain a wide breath of bot activity. We collect data on bot and human behaviour for 30 days in April 2016 from the Streaming API. Note that every single action is recorded as a tweet(status) on Twitter, whether a tweet, retweet, reply or mention. Since we collect all tweets offered by the Streaming API (we do not mention any topics as filtering criterion) within a time periodT, wheret1Apr ≤T ≤t30Apr, we have good approximate insights withinT. Note, however, that the Streaming API only reports 1% of all tweets and, thus we can only offer a lower bound on activity. This campaign resulted in 65 million tweets, with approximately 2 to 2.5 million recorded per day. In total, we recorded information on 2.9 million unique accounts.
3.2 Data Pre-Processing
Our data6contains a range of accounts in terms of their popularity (i.e.number of followers). Hence,
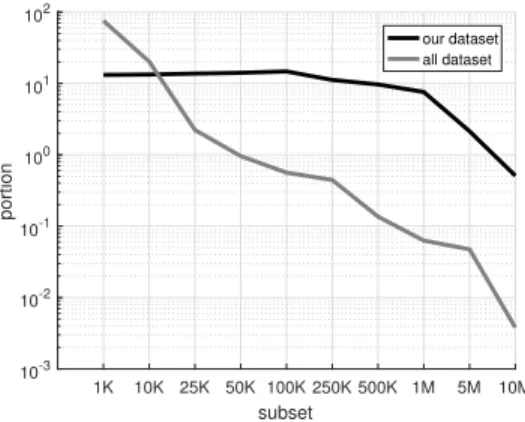
we partition profiles into four popularity groups to enable a deeper understanding of how each group behaves. The intuition behind this partitioning is that popularity might intrinsically reveals profile and network attributes. For instance, the most credible accounts will have high numbers of followers, whereas it is much more likely that spam or dark accounts will have lower popularity. To this end, we select four popularity groups, ranging from low popularity (around 1K followers) to high popularity (over 10M followers). From these groups, we then extract a random subset of accounts for later manual annotation,i.e.to classify them as either botvs.human (see §3.4). Figure1
presents the density distribution of both the overall population and the sampled population. Broadly speaking, the trends are similar, however, it is necessary to oversample high popularity accounts, because they make-up only a small fraction of the overall population. For example, only 0.003% of accounts have over 10M followers in our non-sampled dataset, but this constitutes 1.414% of our annotated dataset. To gain statistically representative populations, it is therefore important we oversample these groups. We do this because popular accounts exert far greater influence on the Twittersphere, and therefore we wish to have statistically significant vantage on their activities.
5Stweeler–https://github.com/zafargilani/stcs
1K 10K 25K 50K 100K 250K 500K 1M 5M 10M subset 10-3 10-2 10-1 100 101 102 portion our dataset all dataset
Fig. 1. Twitter user account normalised distribution - allvs.annotated.
The popularity groups are as follows:
G10M+– celebrity status:This is the subset of Twitter users with the highest number of followers,
i.e.>9M followers. These are the most popular users, who hold celebrity status and are globally renowned. Popular and credible organisations (e.g.CNN, NetGeo) use these accounts for various purposes, which makes them free of spam, thus having high credibility and trustworthiness.
G1M– very popular:This subset of Twitter users is amongst the most popular on the platform,
i.e.900K to 1.1M followers. These users are close to celebrity status and global recognition (e.g. nytfood, pcgamer).
G100k– mid-level recognition:This subset represents popular accounts with mid-level
recog-nition (e.g.CBSPhilly, DomusWeb),i.e.90k to 110k followers.
G1k– lower popularity:This subset represents more ordinary users,i.e.0.9k to 1.1k followers.
These users (e.g.hope_bot, Taiwan_Agent) form a large base and, though they show lower individual and accumulated activity, they do form the all-important tail of the distribution.
3.3 Feature Extraction
After randomly selecting user accounts to populate these four groups, we extract all associated metadata and compute values for a range of features (e.g.number of tweets). We then use Principal Component Analysis from thescikit-learnmachine learning library7to test the relevance and importance of the selected features. A set of 22 features across account profile, network and activity revealsσ2of almost 100%. This means that our feature-set is representative of most of the variance found in the dataset. The final feature set along with the correlation among different popularity groups is shown in Figure2.
In this study, in addition to known metrics (age, tweets, retweets, favourites, replies and mentions, URL count, follower-friend ratio,etc), we also analyse a set of six novel metrics not explored in past bot research. These are:likes per tweet,retweets per tweet,user replies and mentions,activity source count,type of activity sources, andsize of content uploaded. The selection of these features is mainly driven by Duguéet al.[20]. Although, there are existing studies that focus on using features (and their associated values) [18] for things like fake follower detection (see §2), here we use these features to explore the general differences between bots and humans.
3.4 Bot Classification
To compare bots with humans, it is next necessary to identify which accounts are operated by bots. This is not a trivial problem, as bots many not exhibit properties that allow them to be easily classified. Even many automated tools rely on existing human annotations, which are naturally also susceptible to bias. Here, we describe our approach to bot classification.
3.4.1 Bot Detection Tools.We started by experimented with existing bot detection tools. We have found two research tools available: BotOrNot (now rebranded as Botometer8) [32] and Debot9[8].
Using their APIs, we can provide a set of Twitter accounts and receive classifications (humanvs. bot) in return. We next outline the results from these experiments.
BotOrNot:We first experimented with the updated release of BotOrNot, a state-of-the-art
bot detection tool. To confirm its efficacy, we compared the outcomes against human annotators (see §3.4.2) using two confidence thresholds (40% and 60%). In both cases, the overlap is limited: BotOrNot reports an overall accuracy (48%). Table1illustrates the differences in a confusion matrix. These findings show both the difficulty of accurately detecting bots, and the potential failures due to the amassing of unnecessarily large number of features (as opposed to a few most relevant features). The reason appears to be that BotOrNot is trained on rather different bot accounts, therefore challenging the accuracy of the classifier.
Table 1. Confusion matrix of BotOrNot predictions and human annotations. n = 3535 Predicted bot Predicted human Total annotated
Annotated bot 707 818 1525
Annotated human 943 1067 2010
Total predicted 1650 1885 n = 3535
Debot:We also experimented with the Debot tool, using itsdb.check_user(’@screen_name’)
method10. This returns an empty response for the accounts we tested. To circumvent this problem,
we extracted the list of Debot detected bots for the month of April 2016 (when we collected our dataset) to compare the outcomes against our manual annotations (§3.4.2). We only found a very small overlap with the bots detected by Debot,i.e.4 out of 3535 accounts in our dataset (0.11%). We found that out of these 4 accounts, two are misclassified as bots by Debot according to our own ground-truth. We also found that Debot collects, detects and maintains a list of cross-correlated accounts during certain time periods; hence, it is limited to detecting accounts it has already collected data on. Again, we do not comment on the accuracy of Debot overall, only that its coverage is not sufficient for our dataset.
3.4.2 Human labelling.The above experiments indicate that using existing automated bot detection tools, trained on alternative accounts, is not sufficient for our dataset. The agreement levels between BotOrNot and Debot are extremely low, making it impossible to conclude definitively which is correct without additional manual inspection. Hence, we choose to supplement this strategy with a manual approach. We employed human participants to perform ahuman annotation task11
to identify bots and humans.
Human labelling or annotations is a standard and common practice followed in labelling unla-belled data, such as for the purposes of manual classification, or for training supervised machine 8Botometer –https://botometer.iuni.iu.edu/#\protect\kern-.1667em\relax/
9Debot –http://www.cs.unm.edu/~chavoshi/Debot/index.html 10Debot API –https://github.com/nchavoshi/Debot_api
Table 2. Summary of Twitter dataset post-annotation.
Group #Bot accts #Human accts #Bot statuses #Human statuses
G10M+ 24 26 71303 79033
G1M 295 450 145568 157949
G100k 707 740 148015 82562
G1k 499 794 24328 13351
Total 1525 2010 389214 332895
learning algorithms. We recruited four undergraduate students for the purposes of annotation. Each account was reviewed by all recruits independently, before being aggregated into a final judgement using a final collective review (via discussion if needed).
As well as providing the recruits with the Twitter profile, we also presented summary data to streamline the task. This included: account creation date, average tweet frequency, content posted on user Twitter page, account description, whether the user replies to tweets, likes or favourites received and the follower-friend ratio. We further provide participants with a list of the ‘sources’ used by the account over the month,e.g.Twitter app, browser,etc. The human workers consider both the number of sources used, and the types of sources used. This is because sources can reveal traces of automation,e.g.use of the Twitter API. Additionally, the human worker would also visit a user’s Twitter page and verify the content and URLs posted. That said,we emphasise that annotators were not simply asked to look at the Twitter page to make a decision — they were given a range of pertinent metadata.Overall, we presented participants with randomised lists that fell into the four popularity groups containing roughly 25k accounts each. Human annotators were instructed to filter out any account that matched the following criteria: an account that does not exhibit activity (i.e.no tweet, retweet, reply, and mention), or an account that is suspended. In total, the volunteers successfully annotated 3535 active accounts: 1525 were classified as bots and 2010 as humans. Table2provides a summary of the data. Some sample annotated bot accounts per popularity group is as follows:G10M+(AlArabiya, CNN, FoxNews, MTV),G1M(AlArabiya_EGY, ActualidadRT, CaptainAmerica, ExpressNewsPK),G100k(263Chat, AnimeVoice, AutoSportsArt, candangaNoticia), andG1k(BeerAlien, BietenOnline, CeritaHitam, NPRandBplaylist).
For context, we can cross validate by comparing the agreement of final annotations by the human workers to the BotOrNot annotation12. The average inter-annotator agreement compares the pairs of labels by each human annotator to capture the percentage of accounts for which all four annotators unanimously agree. The average agreement is measured as a percentage of agreement: 0% shows lack of agreement and 100% shows perfect agreement. Our human annotation task shows very high unanimous agreement between human annotators for each popularity group:G10M+
(96.00%),G1M(86.32%),G100k(80.66%), andG1k(93.35%). Whereas, BotOrNot shows lower than average agreement with the final labels assigned by the human annotators:G10M+(46.00%),G1M
(58.58%),G100k(42.98%), andG1k(44.00%). In fact, BotOrNot exhibits negative Cohen’skappa[12] thus showing less agreement than exists by chance. Unfortunately, Debot only produced 4 account labels and therefore we cannot use it to say anything conclusive. Since, BotOrNot yields a lower accuracy and Debot does not produce any labels, we restricted ourselves to the dataset of accounts that were manually annotated.
3.5 Media Extraction and Processing
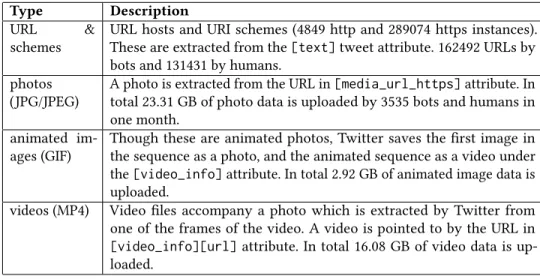
Finally, we note that users are allowed to tweet content such as video and images. These are identified by metadata within our Twitter data. Table3summarises the types of media content we observe from the annotated data. For each tweet, we also extracted all media and URLs. Importantly, Twitter automatically creates different resolutions of photos and videos, as well as generating images from animated sequences or videos to accompany static displays: we areonlyconsidering the media originally uploaded by users.
Table 3. Types of bot traffic uploaded by Twitter users.
Type Description
URL & schemes
URL hosts and URI schemes (4849 http and 289074 https instances). These are extracted from the[text]tweet attribute. 162492 URLs by bots and 131431 by humans.
photos (JPG/JPEG)
A photo is extracted from the URL in[media_url_https]attribute. In total 23.31 GB of photo data is uploaded by 3535 bots and humans in one month.
animated im-ages (GIF)
Though these are animated photos, Twitter saves the first image in the sequence as a photo, and the animated sequence as a video under
the[video_info]attribute. In total 2.92 GB of animated image data is
uploaded.
videos (MP4) Video files accompany a photo which is extracted by Twitter from one of the frames of the video. A video is pointed to by the URL in
[video_info][url]attribute. In total 16.08 GB of video data is
up-loaded.
3.6 Data Limitations
Before beginning our analysis, it is important to discuss key limitations of our dataset, as well as considerations that should be included when interpreting results. First, we emphasise that our bot detection process is underpinned by human annotators. Thus, just like any other study, our results are contingent on correct annotations. By the very nature of some bots, we acknowledge that this is a challenge and may result in errors as there is no clear ground-truth that can be used to validate results. A perfectly disguised botwillbe classified as human. To mitigate its impact, we have experimented with multiple classifiers and empirically shown that a manually classified dataset provides more accurate outcomes. For example, the human annotators have high levels of agreement and our secondary manual validation revealed high accuracy. That said, we temper our later analysis with this consideration.
Second, as we chose to use a manual classification approach, we also note that our dataset is smaller than possible with more automated techniques. In total, we evaluate 3535 accounts which, inevitably, means that we are only inspecting a subset of the total Twittersphere. Our dataset also only covers a single month, so it is difficult to identify large-scale emerging events that may exceed this period. Overall, this smaller data set is necessary, as scaling up manual annotations beyond this level is challenging. A similar issue is the sampling we perform amongst popularity groups, which means that we do not present data relevant to users who are not within the popularity groups defined. We took this step to ensure coverage of different types of accounts. However, naturally, this results in over-sampling of high popularity bot/human accounts and under-sampling of low popularity bot/human accounts. As such, we emphasise that our results cannot be generalised
across the entire Twitter population — they only represent Twitter users who fall into the popularity groups we discuss.
4 DISSECTING THE CHARACTERISTICS OF TWITTER BOTS
The purpose of this study is to discover the key account characteristics that are typical (or atypical) of bots and humans. Recall that we take a broad perspective on what a ‘bot’ is,i.e.any account that consistentlyinvolves automation over the observed period, but may involve human intervention. This definition is justified by the purpose of automation,i.e.humans act asbot managers, whereas bots areworkers. To explore this, we use our data (§3) to empirically characterise bots (dashed lines in figures) and humans (solid lines in figures). To begin, we simply compute the correlation between each feature for bots and humans; Figure2presents the results as a heatmap (where perfect correlation is 1.0). Notice that most features exhibit very poor correlations (0.0 to 0.35), indicating significant discrepancies between bot and human behaviour — we therefore spend the remainder of this paper exploring these differences in depth.
10M 1M 100K 1K
user statuses user tweets user retweets user favourites user replies & mentions likes per tweet retweets per tweet lists account age ratio follower friend ratio lifetime statuses freq favourite tweet ratio age of account in days sources count urls count daily favouriting freq photo in kb gif in kb video in kb total in kb 0.05 0.1 0.15 0.2 0.25 0.3 0.35 correlation
Fig. 2. Spearman’s rank correlation coefficient (ρ) between bots and humans per measured metric. The figure shows none (0.0) to weak correlation (0.35) across all metrics, indicating clear distinction between the two entities.
4.1 Content Generation
We begin by askingif bots generate more content on Twitter than humans?We initially consider two forms of content creation: atweet, which is an original status written by the account, and aretweet, which is to repost an existing status. When using the termstatus, we are referring to the sum of both tweets and retweets. First, we inspect the amount of content shared by computing the number of statuses (i.e.tweets + retweets) generated by each account across the 30 days. As anticipated, humans post statuses less frequently than bots (monthly average of 192 for humansvs.303 for bots), in all popularity groups exceptG10M+, where surprisingly humans post slightly more than
bots. The sheer bulk of statuses generated byG10M+(on average 2852 for bots, 3161 for humans in a month) is likely to acquire popularity and new followers. Overall, bots constitute 51.85% of all statuses in our dataset, even though they are only 43.14% of the accounts.
100 101 102 103 104 105 user-tweets 0 0.2 0.4 0.6 0.8 1 CDF Bot-10M Human-10M Bot-1M Human-1M Bot-100K Human-100K Bot-1K Human-1K
(a) Tweets issued by a user.
100 101 102 103 user-retweets 0 0.2 0.4 0.6 0.8 1 CDF Bot-10M Human-10M Bot-1M Human-1M Bot-100K Human-100K Bot-1K Human-1K
(b) Retweets issued by a user.
100 101 102 103 104 user-replies 0 0.2 0.4 0.6 0.8 1 CDF Bot-10M Human-10M Bot-1M Human-1M Bot-100K Human-100K Bot-1K Human-1K
(c) Replies and mentions posted by a user.
100 101 102 103 104 105 106 follower-friend-ratio 0 0.2 0.4 0.6 0.8 1 CDF Bot-10M Human-10M Bot-1M Human-1M Bot-100K Human-100K Bot-1K Human-1K
(d) Follower-friend ratio of a user.
Fig. 3. Content Creation: Tweets issued, Retweets issued, Replies and mentions; Account Reciprocity: Follower-friend ratio.
An obvious follow-up iswhat do accounts tweet?This is particularly pertinent as bots are often reputed to lack original content. To explore this, we inspect the number oftweets vs. retweets performed by each account. Figures3(a)and3(b)present the empirical distributions of tweets and retweets, respectively, over the 30 days. We see that the retweet distribution is rather different to tweets. Bots inG1M,G100kandG1k are far more aggressive in their retweeting; on average, bots generate 2.20×more retweets than humans. The only exception to this trend isG10M+where humans retweet 1.54×more often than bots. This is likely driven by the large number of tweets generated by celebrity users. Typically, humans do generatenewtweets more often, while bots rely more heavily on retweeting existing content. Generally, humans post 18 tweets for every retweet, whereas bots post 13 tweets for every retweet in all popularity groups exceptG10M+(where both entities show similar trends).
Whereas tweets and retweets do not require one-to-one interaction, a further type of messaging on Twitter, viareplies, does require one-to-one interaction. These are tweets that are created in response to a prior tweet (using the @ notation). Figure3(c)presents the distribution of the number of replies issued by each account. We anticipate that bots post more replies and mentions given their automated capacity to do so. However, inG10M+both bots and humans post a high number of
replies, and bots post only marginally more than celebrities. While bot-masters inG10M+deploy chatbotsto address simple user queries, celebrities reply in order to engage with their fanbase. It also possible that celebrities employ managers as well as automation and scheduling tools (§4.5) for such a purpose. Bots in the remaining popularity groups respond twice as frequently as their human counterparts. Again, this is driven by the ease by which bots can automatically generate replies: only the most dedicated human users can compete.
4.2 Content Popularity
The previous section has explored the amount of content generated by accounts, however, this does not preclude such content from being of a low quality. To investigate this, we compute standard popularity metrics for each user group.
First, we inspect thenumber of favouritesorlikesreceived for tweets generated by the accounts. This is a reasonable proxy for tweet quality. These features are retrieved from[favorite_count]
and[retweet_count]attributes within the tweet structure. These attributes can then be
accumu-lated for the observed time period. Recall that we collect all available data from the Streaming API for April 2016. The Streaming API is a live stream and does not present an option for gathering historical data. However, we do not require historical data because our observation is set within a certain time-frame. In fact, historical data in this instance will pollute our dataset and bias the consequent results. 100 101 102 103 104 likes-per-tweet 0 0.2 0.4 0.6 0.8 1 CDF Bot-10M Human-10M Bot-1M Human-1M Bot-100K Human-100K Bot-1K Human-1K
(a) Likes per tweet received by a user.
100 101 102 103 104 105 retweets-per-tweet 0 0.2 0.4 0.6 0.8 1 CDF Bot-10M Human-10M Bot-1M Human-1M Bot-100K Human-100K Bot-1K Human-1K
(b) Retweets per tweet received by a user.
Fig. 4. Content Popularity: Likes per tweet, Retweets per tweet.
Figure4(a)presents the empirical distribution of the number of favourites or likes received for all the tweets generated by the profiles in each group. A significant discrepancy can be observed. Humans receivefarmore favourites per tweet than bots across all popularity groups exceptG1k. Close inspection revealed that bots inG1kare typically part of largersocial botnetsthat try to promote each other systematically for purposes as outlined in §1. In contrast, human accounts are limited to their social peers and do not usually indulge in the ‘influence’ race. ForG10M+,G1M
andG100kpopularity groups, humans receive an average of 27×, 3×and 2×more favourites per
tweet than bots, respectively.G1kbots are an exception that receive 1.5×more favourites per tweet than humans. These findings suggest that: (i) the termpopularitymay not be ideally defined by the number of followers, (ii) human content gathers greater engagement due to its personalised attributes.
A furtherstrongersign of content quality is another user retweeting content. Humans consistently receive more retweets for all popularity groupsG10M+: 24-to-1,G1MandG100k: 2-to-1, exceptG1k:
1-to-1. This difference, shown in Figure4(b), is indicative of the fanbase loyalty, which is vastly higher for individual celebrities than reputable organisations. In other words, thequalityof human content appears to be much higher. We then inspectwhoperforms the retweets,i.e.do bots tend to retweet other bots or humans? We find that bots retweeting bots is over 3×greater than bots retweeting humans. Similarly, humans retweeting humans is over 2×greater than humans retweeting bots. Overall, bots are retweeted 1.5×more often than humans. This indicates a form of homophily and assortativity.
4.3 Content Consumption
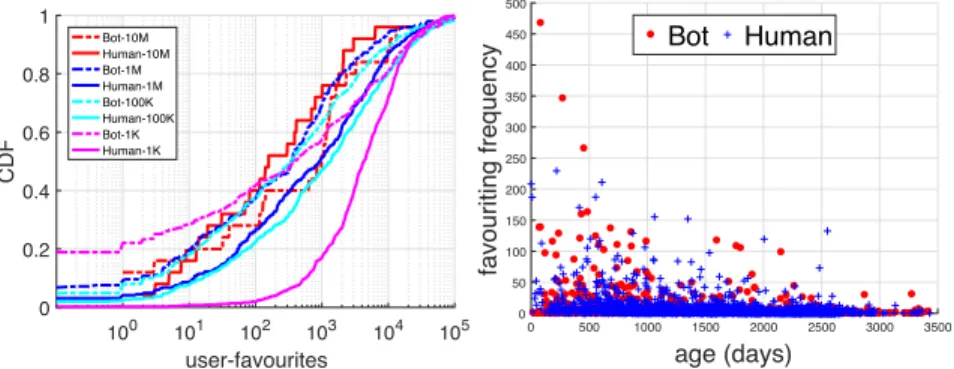
Whereas the previous metrics have been based on content producedbythe accounts under study, our dataset also includes the consumption preferences of the accounts themselves. Hence, we ask how often do bots ‘favourite’ content from other users and how do they compare to humans?Intuitively, bots would be able to perform far more likes than humans (who are physically constrained). Figure
5(a)shows the empirical distribution of the number of likes performed by each account. It can be seen that, actually, for most popularity groups (G1M,G100k,G1k), humans favourite tweets more often than bots (on average 8251 for humansvs.5445 for bots across the entire account lifetimes). Linking into the previous discussion, it therefore seems that bots rely more heavily on retweeting to interact with content. In some cases, the difference is significant;e.g.humans inG1MandG100k
place twice as many likes as bots do.G10M+, however, has an average of 1816 by humans compared to 2921 by bots. We conjecture that there are several reasons for this trend: (i) humans ‘appreciate’ content more than bots, and demonstrate this via likes; (ii) bots are workers for their human managers and serve a purpose, which may not require them to like other tweets; and (iii) humans have a social incentive to like other tweets, potentially as a social practice (with friends) or in the hope of receiving likes in return [31].
100 101 102 103 104 105 user-favourites 0 0.2 0.4 0.6 0.8 1 CDF Bot-10M Human-10M Bot-1M Human-1M Bot-100K Human-100K Bot-1K Human-1K
(a) Tweets favourited (liked) by a user.
0 500 1000 1500 2000 2500 3000 3500 age (days) 0 50 100 150 200 250 300 350 400 450 500 favouriting frequency Bot Human
(b) Number of favourites performedvs.age of the account.
Fig. 5. Content Consumption: Likes performed, Favouriting behaviour.
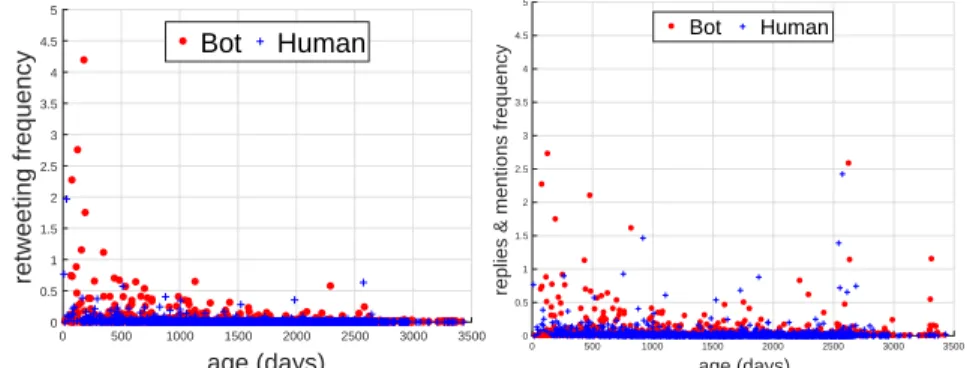
We also noted that these consumption patterns are impacted by the age of the bots. For example, Figure5(b)plots the number of favourites performed by an accountvs.the age of the account. It can be seen that more recent (i.e.modern) bots are significantly more aggressive in liking other tweets. Older bots, instead, use this feature less frequently; deeper inspection suggests this is driven by the trustworthy nature of older bots, which are largely run by major organisations Figure6presents
0 500 1000 1500 2000 2500 3000 3500 age (days) 0 0.5 1 1.5 2 2.5 3 3.5 4 4.5 5 retweeting frequency Bot Human
(a) Retweets madevs.age of the account.
0 500 1000 1500 2000 2500 3000 3500 age (days) 0 0.5 1 1.5 2 2.5 3 3.5 4 4.5 5
replies & mentions frequency
Bot Human
(b) Replies & mentions madevs.age of the ac-count. 0 500 1000 1500 2000 2500 3000 3500 age (days) 0 0.5 1 1.5 2 2.5 3 3.5 4 4.5 5 sources frequency Bot Human
(c) Sources usedvs.. age of the account.
0 500 1000 1500 2000 2500 3000 3500 age (days) 0 0.5 1 1.5 2 2.5 3 3.5 4 4.5 5 urls frequency Bot Human
(d) URLs postedvs.age of the account.
Fig. 6. Young aggressive bots: Retweets, Replies & mentions, Sources, URLs.
the relationship between the age of the accounts and number of retweets performed, replies and mentions, sources used, and URLs posted during the measurement period. This reveals trends similar to Figure5(b), where younger bots more aggressively retweet content (Figure6(a)), perform replies and mentions more often (Figure6(b)), and post URLs with tweets more frequently (Figure6(d)). Again, this appears to be driven by the nature of these newer bots, which are exploiting retweets, replies, mentions, and URLs for easy content generation and disseminationvs.older bots, which carry out less spam-like activity. This, however, does not hold across all metrics and, indeed, we find cases where account behaviour remains consistent regardless of age. For example, Figure6(c)
plots the number of sources used by account based on age; it can be seen that trends are hardly any different across age (i.e.young or old) or type of account (i.e.bot or human).
4.4 Account Reciprocity
As well as content popularity, we can also measure reciprocity (i.e.friendship). Twitter classifies two kinds of relationships: reciprocal follower-relationshipi.e.when two accounts follow each other, and non-reciprocal relationshipi.e.an account has many followers who are not followed in return (this is often the case for celebrities). We measure this via theFollower-Friend Ratio. Figure
3(d)shows empirical distribution of theFollower-Friend Ratiofor each group of accounts. Humans display higher levels of friendship (G10M+: 4.4×,G1MandG100k: 1.33×,G1k: 15×) and thus a lower Follower-Friend Ratiothan bots.
Previous research [11] argues that humans typically have a ratio close to 1, however, our analysis contradicts this assumption. For celebrities, very popular and mid-level recognition accounts this ratio is in the order of thousands-to-1, irrespective of whether an account is a bot or a human (G10M+: 629011-to-1 for botsvs.144612-to-1 for humans,G1M: 33062-to-1 for botsvs.24623-to-1 for humans,G100k: 2906-to-1 for botsvs.2328-to-1 for humans). In fact, even the ratios for low popularity accounts are not 1, but consistently greater (G1k: 30-to-1 for botsvs.2-to-1 for humans). This is caused by the human propensity to follow celebrity accounts (who may not follow in return), as well as the propensity of bots to indiscriminately follow large numbers of other accounts (largely in the hope of being followed in return).
4.5 Tweet Generation Sources
Finally, we inspect the tools used by bots and humans to interact with Twitter. This is possible because each tweet is tagged with thesourcethat generated it; this might be the website, a third-party app or tools that employ the Twitter API. Figure7(a)presents the number of sources used by human and bot accounts of varying popularities. Bots migt be expected to use a single source (i.e. an API or tool) for tweeting, yet bots actually inject tweets using far more sources than humans (cf. Table4).
Bot-10M Human-10MBot-1MHuman-1M Bot-100K Human-100K Bot-1K Human-1K 0 5 10 15 20 25 30 35 40 45 50 sources-count
(a) Activity sources used by a user (Reddot isµof the distribution).
0 2 4 6 8 10
x 104 SocialFlow
Twitter Web Client Twitter for mobile TweetDeck Buffer IFTTT Hootsuite ICGroupInc Sprinklr SnappyTV Spredfast dlvr it twittbot SocialOomph Instagram UberSocial App./Tool count of usage
Bot usage Human usage
(b) Bar chart of accounts that use each type of Twitter source.
Fig. 7. Tweet Sources: Count of Activity Sources, and Type of Activity Sources.
To explore this further, Figure7(b)presents the number of accounts that use each source observed. It can be seen that bots use a multitude of third-party tools. Bot news services (especially from
G10M+) are found to be the heaviest users of social media automation management and scheduling services(SocialFlow, Hootsuite, Sprinklr, Spredfast), as well as a Cloud-based service that helps live video editing and sharing(SnappyTV). Some simpler bots (fromG100kandG1kgroups) use basic automation services(Dlvr.it, Twittbot), as well as services that post tweets by detecting activity on other platforms(IFTTT). A social media dashboard management tool seems to be popular across most groups exceptG1k(TweetDeck). Interestingly, it can also be seen that bot accounts regularly tweet using Web/mobile clients — pointing to the possibility of amixof automated and human operation. In contrast, 91.77% of humans rely exclusively on the Web/mobile clients. That said, a small number (3.67%) also use a popular social media dashboard management tool(TweetDeck), and automated scheduling services(Buffer, Sprinklr). This is particularly the case for celebrities,
who likely use the tools to maintain high activity and follower interaction — this helps explain the capacity of celebrities to so regularly reply to fans (§4.1).
4.6 Media Upload
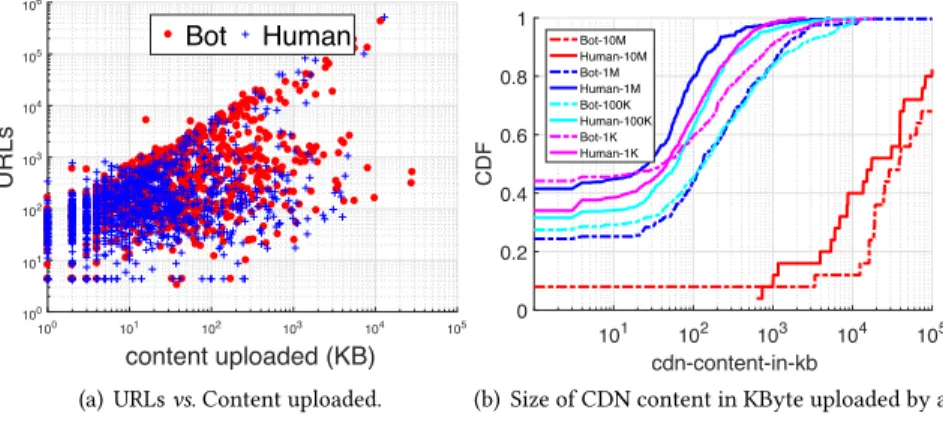
Finally, we inspect the actual content of the tweets being generated by the accounts. We do this using two metrics: number of URLs posted by accounts, and the size of media uploaded. Figure8(a)
presents the scatter plot of the number of URLs (y-axis) and content uploaded in KB (x-axis). Bots place far more external URLs in their tweets than humans (see Table4): 162% inG10M+, 206% more inG1M, 333% more inG100k, and 485% more inG1k.
100 101 102 103 104 105 content uploaded (KB) 100 101 102 103 104 105 106 URLs Bot Human
(a) URLsvs.Content uploaded.
101 102 103 104 105 cdn-content-in-kb 0 0.2 0.4 0.6 0.8 1 CDF Bot-10M Human-10M Bot-1M Human-1M Bot-100K Human-100K Bot-1K Human-1K
(b) Size of CDN content in KByte uploaded by a user.
Fig. 8. Content Creation: URLs in tweets, Content uploaded on Twitter.
Bots are therefore a clear driving force for generating traffic to third party sites, and upload far more content on Twitter than humans. Figure8(b)presents the distribution of the amount of content uploaded by accounts (e.g.photos). Account popularity has a major impact on this metric. Bots in
G10M+have a 102×lead over bots in other popularity groups; and humans inG10M+have a 366× lead over humans in other popularity groups. Overall, bots upload substantially more bytes than humans do (see Table4): 141% inG10M+, 975% more inG1M, 376% more inG100k, and 328% more inG1k. This is due to their ability to automate tasks, while humans are limited by their physical capacity. It is also worth noting that both content upload and URL inclusion trends are quite similar, suggesting that both are used with the same intention,i.e.spreading content. Since bots inG10M+
mostly belong to news media, sharing news headlines is clearly a means of operating their business. This potentially has a big impact on the network traffic produced as well as the required network capacity. As the amount of traffic is correlated to the cost and energy [33], identifying the content produced by a bot is a key step to reshaping or optimising the way that service providers should deal with this type of traffic and content.
We can also inspect the specific types of the media uploaded. Our data reveals a significant presence of media content generated by bots. Figure9presents a scatter plot comparing the number of media types uploaded per URI (one URI is a single object). It can be seen that both bots and humans upload significant quantities, however, it is clear that bots contribute the most. In total, bots account for 55.35% (12.90 GB) of the total photo traffic uploaded in our dataset; 53.58% (1.56 GB) of the total animated image traffic uploaded; and 40.32% (6.48 GB) of the total video traffic uploaded. This is despite the fact that they only constitute 43.16% of the accounts under study and
100 102 104 106 #URI (Http + Https) 100 105 #photos Bot Human
(a) No. of photos (JPG/JPEG) uploaded by bots & humans per URI (http + https).
100 102 104 106 #URI (Http + Https) 100 105 #anumated gif Bot Human
(b) No. of animated images (GIF) up-loaded by bots & humans per URI (http + https). 10-5 100 105 1010 #URI (Http + Https) 100 105 #videos Bot Human
(c) No. of videos (MP4) uploaded by bots & humans per URI (http + https).
Fig. 9. Media (photos, animated images, videos) uploaded by bots and humans on Twitter.
102 104 #visits www.youtube.comyoutu.be gyac.tix.com www.haberdar.comm.youtube.com www.ahmnews.com www.teamiblends.comitunes.apple.com kbsworld.co.krespn.go.com www.oprah.com uk.sports.yahoo.comm.facebook.com coobis.com www.prizeo.comsmarturl.it petfilm.biz headlines.yahoo.co.jpjamie-dornan.org www.facebook.com visited url Bots Human
(a) Human popular URLs
102 104 #visits www.sunfrogshirts.comwww.youtube.com byvue.com www.haberdar.com www.ahmnews.comyoutu.be dzxcq.comcjsab.com www.fenerbahce.orgmoca-news.net smarturl.it gcnhu.com entertain.naver.comwww.facebook.com www.alwatan.com.saliferdefempire.com time.compaper.li aldiyar.net www.amazon.com visited url Bots Human
(b) Bot popular URLs
100 102 104 #visits www.youtube.comyoutu.be www.haberdar.comm.youtube.com www.ahmnews.comsmarturl.it itunes.apple.com entertain.naver.comm.facebook.com www.facebook.compaper.li petfilm.biz aldiyar.net headlines.yahoo.co.jpwww.amazon.com www.buzzfeed.comtoyzone.com.sa profile.empowr.com www.instagram.comwww6.nhk.or.jp visited url Bots Human
(c) Combined popular URLs
Fig. 10. Visiting trends to popular URLs by bots and humans.
53.90% of the tweets generated. When combined, bots account for a total of 49.52% (20.95 GB) of traffic uploaded.
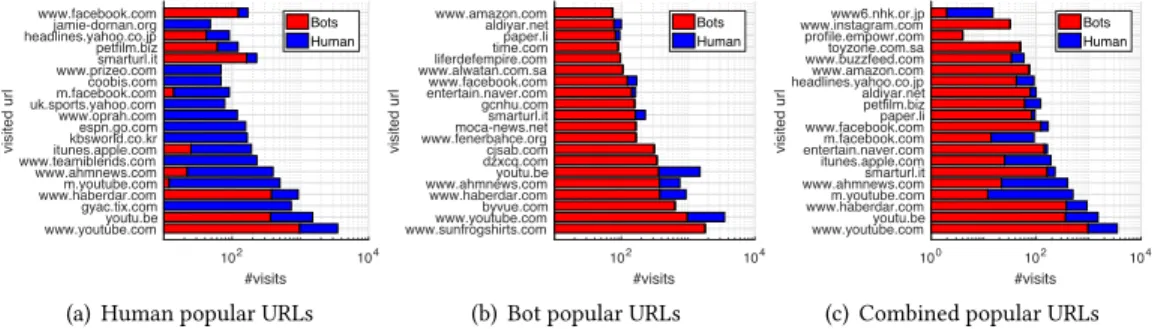
Briefly, it is also worth noting that many bot accounts post URLs. In fact, 55.28% of all URLs are posted by bots, despite the fact that bots only make up 43.16% of the accounts. This is important because these have the potential to trigger further traffic generated amongst the accounts that view the tweets. To explore this, Figure10presents the most popular domains posted by bots and humans. Significant differences can be observed. For example, whereas humans tend to post mobile sites (e.g.m.youtube.com, m.facebook.com), bots rather post the desktop version (e.g.youtube.com, facebook.com). We also see a range of websites exclusively posted by humans,e.g.espn.com and oprah.com. One can also see a few URLs posted by bots, but never by humans. These differences highlighted the differing goals of bots and humans when posting content, with more well-known websites dominating the human dataset. For example, the most regularly posted URL in our bot dataset is sunfrogshirt.com, which is actually a website for purchasing bespoke t-shirts. This highlights a common purpose of media posting on Twitter: spam and marketing. Note that bots infiltrate human popular URLs more often than humans infiltrate bot popular URLs. This shows that bots can reach further due to their automated ability and can considerably impact systems in unusual ways.
5 A WORLD WITHOUT BOTS?
The previous section has discussed the characteristics that make bots and humans different. However, one of the most important things on Twitter is its social graph,i.e.the interconnections between users. Hence, in this section, we will briefly inspect thesocial impactorinfluencethat bots have on Twitter, as well as the impact of removing them. In this context we defineinfluenceas the capacity or the ability to drive an action,e.g.sharing an item (whether text, photo or video) on social media that induces or generates a response.
5.1 How Influential are Bots?
We begin by inspecting thesocial influencethat bots and humans exercise on Twitter.Influence (sometimes referred to asinduction) is the phenomenon where actions of an individual are affected by other individuals through social interaction. Social interaction can be of two main types: (i) passive direct interaction (i.e.following); and (ii) active (direct or indirect) interaction (i.e.retweeting). The former covers follower relationships, where two users are connected (and seeing each others’ tweets), but not necessarily directly engaging,e.g.replying or retweeting. The latter covers retweet, mention and reply activities, where users are directly or indirectly engaging in an active sense. In this section we focus only on active interactions as this is a more direct measure of influence. We therefore construct a graph of these direct/indirect interactions, whereby vertices are Twitter users (bots or humans), and edges represent active interactions,i.e.retweeted statuses, quoted statuses, replies, or mentions. As previous research shows [3], influence in OSNs is directional and position-dependent (i.e.the position in the social graph). Therefore, theinfluenceof a user (vertex) in this context is the sum of direct/indirect but active interactions (edges) it has been engaged in by other users (vertices).
To answerhow influential bots are, we present interaction graphs that depict retweeted statuses, quoted statuses, replies, and mentions of bots and humans by their followers, in Figure11,12and
13. We use two popularity groups: users with 10M and 100k followers. Each graph includes all other users who are involved in the direct interaction,e.g.all accounts that retweet content generated by the users. For brevity, we do not present results for the 1M and 1k popularity groups as they show similar graphs and properties to 10M and 100k groups, respectively. We use directed edges for our interaction graphs, where an edge is directed from theinfluencerto theinfluenced.
The mean degree for the 10M popularity group is very similar for both bots (1.18) and humans (1.176). This shows that both humans and bots are tightly intra-connected within their respective assortative neighbourhoods: The assortative intra-connectedness is stronger than diversified inter-connectedness. We also find that bots have almost 2×the mean degree than humans (4.025vs. 2.164) for the 100k popularity group. This shows that bots have accumulated a large influence both within their assortative as well as diversified neighbourhoods. This is partly driven by the more aggressive tweeting activity of the bots under-study.
5.2 What happens if Bots disappear?
The above confirms that bots have significant influence in Twitter. Thus, an obvious question is what would happen if all bots were blocked or removed from Twitter?This may shed light on the overall impact (positive or negative) that bots have. If bots produce high amounts of content (tweets, URLs, content size), then their existence should be critical for intermediary connections (or form centrality verticesthat sit on critical paths).
Figure11presents the influence graph for the 10M group for retweets and quotes, as well as the graph after removing bots. The density of edges (due to retweeting and quoting) for both bots (Red) and humans (Blue) emphasises the influence of these vertices within their network. We also notice
(a) 10M bots and humans (b) 10M when bots disappear
Fig. 11. Botsvs.Humans - graphs for retweets and quotes of 10M popularity group. Black dots are Twitter users, edges represent aninteraction.Rededges represent retweeting by bots andBlueedges represent retweeting by humans.
two separate sub-graphs appearing for bots and humans which confirms most of the connections are between similar entities,i.e.bots following other bots, and humans following other humans. Despite two separate sub-graphs, vertices of both entity types are connected to each other too,i.e. bots following humans, and humans following bots. This shows thatintra-influence is stronger thaninter-influence,i.e.bots influencing other bots is stronger than bots influencing humans, and vice versa. In the case of bots, this is largely driven by their blanket retweeting behaviour, where they indiscriminately retweet content.
Figure12presents the influence graph from the 100k vertices for retweets and quotes; it exhibits profound differences to the 10M graphs. Inspection reveals that bots are holding the social graph together as they form the medium that connects vertices on the edge of the network. The effects are apparent in Figure12(b), which plots the same graph with all bots removed. This indicates that the human part of the 100k retweet graph is only loosely connected,i.e.bots play a significant role in influencing and consequently propagating content between humans. Though there are small human communities that seem to be tightly connected, the number of weakly connected components are much higher than strongly connected components.
We also look at replies and mentions for 10M and 100k groups in Figure13, which exhibits substantially different trends to the retweet graph. The density of edges (due to replies and mentions) for both bots (Red) and humans (Blue) shows a range of homophily and interconnectedness between bots and humans. The interconnectedness between bots and humans for 10M and 100k groups ranges from low to very low, respectively. The average degree of interconnectedness in 10M group is 15.4 edges, whereas in 100k group it is 2.7 edges. This observation highlights two important trends within this dataset: (i) since replies and mentions are direct one-to-one interactions, strong assortative behaviour is observed in both bots and humans; (ii) humans intra-connect more often than bots in 10M group, whereas the trends for 100k group are the exact opposite. This is partly driven by the propensity for automated bots to generate unsophisticated automated responses (e.g. spam). It is likely that suspecting humans do not respond to these direct messages by bots, especially
(a) 100k bots and humans (b) 100k when bots disappear
Fig. 12. Botsvs.Humans - graphs for retweets and quotes of 100k popularity group. Black dots are Twitter users, edges represent ainteraction.Rededges represent retweeting by bots andBlueedges represent retweeting by humans.
(a) 10M bots and humans (b) 100k bots and humans
Fig. 13. Botsvs.Humans - graphs for replies and mentions of 10M and 100k popularity groups. Black dots are Twitter users, edges represent aninteraction.Rededges represent replies/mentions by bots andBlueedges represent replies/mentions by humans.
those that seem automated or employastroturfing. It is equally likely that naive or simplistic bots are not capable of responding to or engaging in direct messages by unwary humans.
6 CONCLUSIONS, IMPLICATIONS & FUTURE WORK
Bots exercise a profound impact on Twitter. Our work confirms a number of noteworthy trends: (i) bots generally retweet more often, while some humans can exhibit bot-like activity (G10M+); (ii) bots can post up to 5×more URLs in their tweets (§4.1); (iii) bots can upload 10×more content with their tweets; (iv) humans can receive as much as 27×more likes and 24×more retweets as bots (§4.2); (v) bots retweeting other bots is over 3×more regular than bots retweeting humans, whereas humans retweeting other humans is over 2×greater, indicating homophily (§4.2); (vi) humans favourite others’ tweets much more often than bots do, thoughnewerbots are far more aggressive in favouriting tweets to replicate human behaviour (§4.3); (vii) humans enjoy higher levels of friendship and usually form reciprocal relationships (§4.4); (viii) bots typically use many different sources for active participation on Twitter (up to 50 or more); and (ix) activity sources include basic automation and scheduling services (§4.5) — used abundantly by bots and seldomly by humans. We have also shown that bots inject significant proportions of content via the uploading of media (§4.6). We found that there were clear differences between the URLs and content posted by botsvs.humans. By regularly posting links, we posit that bots may trigger further traffic generation amongst their followers. These findings are summarised in Table4; each feature is presented, alongside which type of account (botvs.human) has the higher value for that feature.Bindicates that bots have an average value (for that feature) that is at least 2×the average for humans;H indicates the opposite.⃝indicates that neither is true. The number of * symbols indicate the scale of the difference (no * means up to 2×; * means 2–4×; ** means more than 4×difference). The terms moreandlessgeneralises the trends witnessed across all the popularity groups.
Table 4. Feature inclination:Bis more indicative of bots, whereasHis more indicative of human behaviour, and⃝is neutral (i.e.both exhibit similar behaviour). * represents magnitude of inclination: * is considerable difference, ** is large difference.signif.shows statistical significance of each feature as measured byt-test.
Feature & value Fig. 10M+ 1M 100K 1K signif.
Moreuser tweets 3(a) ⃝ B* B* B*
Higheruser retweets 3(b) H* B∗ B∗ B∗ 99% Moreuser replies and mentions 3(c) ⃝ B* B* B 99%
MoreURLs in tweets 8(a) B** B** B** B** 99%
Moretotal content uploaded (KByte) 8(b) B** B** B** B** 95% Higherlikes received per tweet 4(a) H** H** H** B 99% Higherretweets received per tweet 4(b) H** H** H** B 99% Moretweets favourited (liked) 5(a) B** H** H** H** 99% Morefavourites byyoungeraccounts 5(b) B H B B Higherfollower-friend ratio 3(d) B** B* B* B**
Moreactivity sources 7(a) B* B B B 99%
Although these findings have scientific value in themselves, we also emphasise that there are a series of practical implications from our work. Exploring the above implications is an important next step. A range of bot detection mechanisms exist, typically relying on a mix of manual annotation, machine learning classifiers, honeypots or simply checking if Twitter suspends the accounts. §4
identified a number of clear trends amongst bots, which may help in this endeavour. A clear take-home message was the divergence seen between different groups of bots (based on their follower count). This suggests, for example, that separate classifiers could be built for each of these groups. We also envisage that as bots grow in sophistication it will becomes increasingly necessary to devise
targeted classifiers that are finely tuned to identify bots with particularly characteristics. That said, we highlight that our groupings (based on follower count) only represent one potential taxonomy, and many alternatives exist (e.g.based on topic, number of tweets, place in the social graph). §4.6
also revealed that bots inject a disproportionately large amount of content into Twitter. This is both via direct content uploads and via the sharing of URLs. If one assumes that bot traffic is of a lower priority than human traffic, this offers significant scope for resource allocation optimisation. For example, Twitter could de-prioritise such uploads by redirecting bots to more distant, less optimal servers (when the optimal server is being used by human users). It might even be possible for network operators to directly de-prioritise bot traffic in-network during periods of congestion to avoid networks becoming overloaded. Although it would be undesirable to uniformly block bot initiated content uploads, giving such activities a lower priority would allow operators to better serve their (latency intolerant) human user-base. A range of other interesting future work stem from our analysis. These include exploring credibility scores, influence botnets and analysing bot content. We also note that we have not dived into thepurposebehind the bot accounts we observe. These may be both malicious and benevolent; exploring these roles the motivations behind bot creation is a ripe area of future work.
We conclude by saying that bots have an existential impact on social media, and we believe understanding their activities has inherent scientific value. The scale of their role within Twitter is equal to that of humans and, as such, our work is intended as a foundation for further exploration. That said, this should not be done at the expense of research into human behaviour, which consists of an interesting interplay with both bots and other humans. We therefore envisage that, in the longterm, the distinction between human and bot research will wane, with greater integration of their activities (e.g.greater automation of human accounts).
7 ACKNOWLEDGMENTS
This work was partially funded by EU Metrics project (Grant EC607728). Authors would like to acknowledge students at NUST SEECS for human annotation task.
REFERENCES
[1] N. Abokhodair, D. Yoo, and D. W. McDonald. Dissecting a social botnet: Growth, content and influence in twitter. In
Proceedings of the 18th ACM Conference on Computer Supported Cooperative Work & Social Computing, pages 839–851. ACM, 2015.
[2] L. M. Aiello, M. Deplano, R. Schifanella, and G. Ruffo. People are strange when you’re a stranger: Impact and influence of bots on social networks. InProceedings of the 6th ICWSM, 2012.
[3] A. Anagnostopoulos, R. Kumar, and M. Mahdian. Influence and correlation in social networks. InProceedings of the 14th ACM SIGKDD International Conference on Knowledge Discovery and Data Mining, KDD ’08, pages 7–15. ACM, 2008.
[4] M. Avvenuti, S. Bellomo, S. Cresci, M. N. La Polla, and M. Tesconi. Hybrid crowdsensing: A novel paradigm to combine the strengths of opportunistic and participatory crowdsensing. InProceedings of the 26th International Conference on World Wide Web Companion, WWW ’17 Companion, pages 1413–1421, Republic and Canton of Geneva, Switzerland, 2017. International World Wide Web Conferences Steering Committee.
[5] A. Bessi and E. Ferrara. Social bots distort the 2016 u.s. presidential election online discussion.First Monday, 21(11), 2016.
[6] D. Boyd, S. Golder, and G. Lotan. Tweet, tweet, retweet: Conversational aspects of retweeting on twitter. InSystem Sciences (HICSS), 2010 43rd Hawaii International Conference on, pages 1–10, Jan 2010.
[7] F. Brachten, S. Stieglitz, L. Hofeditz, K. Kloppenborg, and A. Reimann. Strategies and influence of social bots in a 2017 german state election - a case study on twitter.CoRR, abs/1710.07562, 2017.
[8] N. Chavoshi, H. Hamooni, and A. Mueen. Debot: Twitter bot detection via warped correlation. InICDM, pages 817–822, 2016.
[9] N. Chavoshi, H. Hamooni, and A. Mueen. Identifying correlated bots in twitter. In E. Spiro and Y.-Y. Ahn, editors,