Software, Performance and Resource Utilisation Metrics
for Context-Aware Mobile Applications
Caspar Ryan and Pablo Rossi
School of Computer Science & IT, RMIT University
GPO Box 2476V Melbourne 3001 Victoria Australia
{caspar,pablo}@cs.rmit.edu.au
Abstract
As mobile applications become more pervasive, the need for assessing their quality, particularly in terms of efficiency (i.e. performance and resource utilisation), increases. Although there is a rich body of research and practice in developing metrics for traditional software, there has been little study on how these relate to mobile context-aware applications. Therefore, this paper defines and empirically evaluates metrics to capture software, resource utilisation and performance attributes, for the purpose of modelling their impact in context-aware mobile applications.
To begin, a critical analysis of the problem domain identifies a number of specific software, resource utilisation and performance attributes. For each attribute, a concrete metric and technique of measurement is defined. A series of hypotheses are then proposed, and tested empirically using linear correlation analysis. The results support the hypotheses thus demonstrating the impact of software code attributes on the efficiency of mobile applications. As such, a more formal model in the form of mathematical equations is proposed in order to facilitate runtime decisions regarding the efficient placement of mobile objects in a context-aware mobile application framework. Finally, a preliminary empirical evaluation of the model is carried out using a typical application and an existing mobile application framework.
1.
Introduction
It has been recognised that applications with distributed components differ from traditional non-distributed applications along a number of dimensions including communication type, latency, concurrency, partial versus total failure, and referencing/parameter-passing strategies [1].
Context-aware mobile applications are even more complex than their non-mobile distributed counterparts, since they involve connections between executable software components or objects that can migrate from node to node within a heterogeneous software and networking environment [2, 3]. Such environments can be highly dynamic, changing over time as users and devices roam between networks [4] resulting in CPUs becoming loaded and unloaded and network hot spots or congestion points being in a constant state of flux.
Given these differences, this paper argues that it is necessary to extend established software engineering metrics and models before applying them to the emerging domain of adaptive mobile applications. Note that it has been argued before, in the domain of web applications, that traditional methods and metrics should be re-assessed before being applied to a new domain [5].
A context-aware adaptive mobile application framework called MobJeX [2] is being developed, in conjunction with the work described in this paper, as part of the Applications Program of the Australian Telecommunications Cooperative Research Centre (ATcrc). MobJeX is a software development platform with a middleware component enabling dynamic application adaptation based on runtime resource monitoring and declarative rule specification, thus dynamically supporting the transparent distribution of application objects at runtime to supporting devices in a heterogeneous Internet environment.
In this context, application adaptation refers to the ability of an application, or the underlying middleware, to modify its behaviour in response to changes in environmental context, (e.g. available network bandwidth or CPU load changes). In the case of MobJeX, adaptation is achieved via object mobility, in which individual system components, potentially down to the discrete object level, can migrate through the system whilst maintaining location transparency via
remote object references. The decision of when and how object migration should be performed is dependent on factors such as available resources and the nature of the interaction between objects. As such, this serves as an area of study in this paper which proposes and tests metrics to model the impact of software code attributes (which characterise objects and their interactions) upon resource utilisation (of resources such as network, CPU and memory) and performance.
In summary, many software metrics1 have been
defined for traditional applications [6], however few relate to distributed applications in general [7-10], and fewer, if any, consider the unique characteristics of context-aware mobile applications. Furthermore, of the previous studies on metrics, few have focused on evaluating the runtime efficiency of applications in terms of performance and resource utilisation.
The rest of this paper is organised as follows: Section 2, through a critical analysis of the problem domain, identifies a number of specific software, resource and performance attributes, with a concrete metric and technique of measurement defined for each. This facilitates the empirical testing of hypotheses related to these attributes using linear correlation analysis in Section 3, providing support for the hypotheses and thus demonstrating the relationship between software code attributes and the efficiency, in terms of performance and resource utilisation, of mobile applications. As such, a more formal model in the form of mathematical equations is presented in section 4, with the intention of facilitating runtime decisions concerning the efficient placement of mobile objects in a context-aware mobile application framework. Section 5 provides preliminary empirical support for the model in the form of a practical application, using a typical mobile system running on the MobJeX framework. Finally, section 6 closes with a summary, conclusions and discussion of future work.
2.
Specification of Attributes and Metrics
As discussed previously, this paper is concerned with the effect of software and resource attributes on the runtime mobility of software components, and the subsequent impact on application efficiency. For the purpose of this paper, in line with ISO 9126-1 [11], efficiency is considered to be a high-level quality
1
In the narrow sense, as used in Mathematics, ‘metric’ is a special case of ‘measure’ that satisfies certain properties. In the wide sense, as used in SE, both terms are generally seen as equivalent.
attribute comprising the sub-attributes performance (the capability of software to provide appropriate response and processing times, and throughput rates) and resource utilisation (the capability of software to use appropriate amounts and type of resources when the software performs its function). Software is considered to be more efficient as performance increases and resource utilisation decreases.
From a critical analysis of the problem domain a number of software code attributes were identified that were likely to have an impact on efficiency in a mobile application context. Next, concrete metrics were derived for each of the attributes in a form that could be measured at runtime within a middleware environment for each of the attributes. For example,
the attribute method interface volume was quantified
by the metric size of serialised parameters (SOS). As a
concrete example in Java, SOS can be measured directly in a Remote Method Invocation (RMI) [12] context by serialising the method parameters into a
standard java.io.ByteArrayOutputStream and
measuring the size of the resulting byte array. Other implementation details concerning how specific metrics were collected in the empirical studies of section 3 and 5 are available from the authors upon request. The complete set of derived attributes, their descriptions, and their associated metrics and units of measurement are listed in Table 1, with grouping from top to bottom being by software, resource utilisation and performance respectively. Note that additional
attributes such as object life span and participation in
critical scenarios were identified but considered beyond the scope of this paper and thus left to future work.
The next stage of the model derivation process, again via a critical analysis of the problem domain, was the formulation of hypotheses expressing the intuitive multi-way relationships between software, resource utilisation, and performance attributes.
Note that the resource utilisation attributes are split into two categories i.e. those related explicitly to
particular resources (e.g. the resource attribute of
memory represented by the metric memory capacity
[MC] Table 1), and the resource utilisation of such
resources (e.g. the resource utilisation attribute of
memory utilisation represented by the metric memory
usage [MU]). However, since the relationship between resources and their utilisation is effectively constant (as in the case of memory and network bandwidth) or a pre-determined function as in the case of mapping processing power in terms of instructions per second to
processor usage [PU] of a specific CPU; this section only directly presents hypothesis concerning resource
utilisation, since any impact of the resource itself on utilisation can be derived.
These hypotheses are stated below and tested empirically using linear correlation analysis in the following section. Hypotheses P1-P4 are concerned with the impact of software attributes on performance, whilst hypotheses RU1-RU8 relate to the effect of software attributes on resource utilisation. Finally, RUP1-RUP4 express the general effect of resource utilisation on performance.
P1. The larger the serialisation volume of an object,
the greater the object migration cost across a network link. [+SOS +MIT]
P2. The larger the compilation volume of an object,
the greater the class migration cost across a network link (assuming the class is not cached and must be transmitted with the object instance above) [+ECS, +MCT]
P3. The larger the volume of a method interface, the
higher the remote method invocation cost [+SSP, +IT]
P4. The greater the intensity of a method body, the
higher the execution cost [+NEI, +ET]
RU1. The more intensive the body of a method, the
greater the processor utilisation [+NEI, +PU].
RU2. The higher the invocation frequency of a
method, the greater the processor utilisation [+NI, +PU]
RU3. The larger the serialisation volume of an object,
the greater the network utilisation required to migrate the object [+SOS, +NU]
RU4. The larger the compilation volume of an object,
the greater the network utilisation required to migrate the object (assuming the class is not cached and must be transmitted with the object instance) [+ECS, +NU]
RU5. The larger the interface volume of a method, the
greater the network utilisation required to invoke it remotely [+SSP, +NU]
RU6. The higher the invocation frequency of a
method, the greater the network utilisation [+NI, +NU].
RU7. The larger the memory volume of an object, the
greater the memory utilisation upon creating a new instance [+OMS, +MU].
RU8. The larger the execution volume of a method,
the greater the memory utilisation [+EMS, +MU].
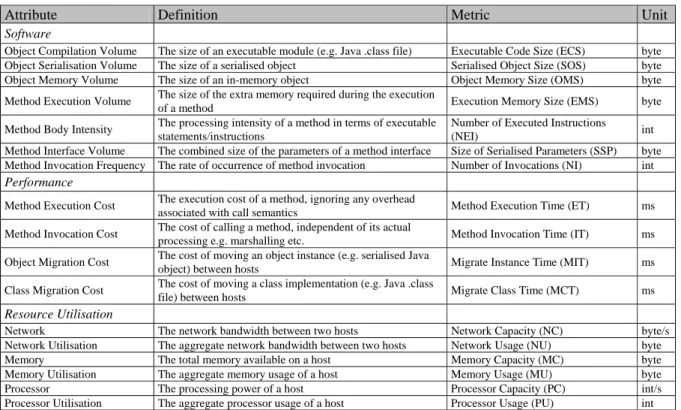
Table 1 Software, Performance and Resource Utilisation Attributes and Metrics
Attribute Definition Metric Unit
Software
Object Compilation Volume The size of an executable module (e.g. Java .class file) Executable Code Size (ECS) byte
Object Serialisation Volume The size of a serialised object Serialised Object Size (SOS) byte
Object Memory Volume The size of an in-memory object Object Memory Size (OMS) byte
Method Execution Volume The size of the extra memory required during the execution
of a method Execution Memory Size (EMS) byte
Method Body Intensity The processing intensity of a method in terms of executable
statements/instructions
Number of Executed Instructions
(NEI) int
Method Interface Volume The combined size of the parameters of a method interface Size of Serialised Parameters (SSP) byte
Method Invocation Frequency The rate of occurrence of method invocation Number of Invocations (NI) int
Performance
Method Execution Cost The execution cost of a method, ignoring any overhead
associated with call semantics Method Execution Time (ET) ms
Method Invocation Cost The cost of calling a method, independent of its actual
processing e.g. marshalling etc. Method Invocation Time (IT) ms
Object Migration Cost The cost of moving an object instance (e.g. serialised Java
object) between hosts Migrate Instance Time (MIT) ms
Class Migration Cost The cost of moving a class implementation (e.g. Java .class
file) between hosts Migrate Class Time (MCT) ms
Resource Utilisation
Network The network bandwidth between two hosts Network Capacity (NC) byte/s
Network Utilisation The aggregate network bandwidth between two hosts Network Usage (NU) byte
Memory The total memory available on a host Memory Capacity (MC) byte
Memory Utilisation The aggregate memory usage of a host Memory Usage (MU) byte
Processor The processing power of a host Processor Capacity (PC) int/s
RUP1.As network utilisation increases, method invocation cost increases [+NU, +IT].
RUP2.As network utilisation increases, object
migration cost increases [+NU, +MIT].
RUP3.As network utilisation increases class migration
cost increases [+NU, +MCT].
RUP4.As processor utilisation increases, method
execution cost increases [+PU, +ET].
Note that there are no relationships and hypotheses concerning the effect of performance and resource utilisation on software attributes, because software attributes are independent of performance and resource utilisation. The same applies with performance versus resource utilisation.
Also note that the authors identified other potential relationships that are not expressed by hypotheses. For example as memory utilisation increases, paging could affect performance. Furthermore, as processor utilisation increases there will inevitably be an effect on performance attributes such as method invocation cost. However since these factors were not expected to have a primary effect, and in the interests of studying a manageable set of metrics in this paper, the analysis of such attributes and metrics is left to future work.
3.
Empirical Evaluation
This section describes an empirical evaluation designed to test statistically the relationship between metrics, as expressed by the hypotheses introduced in section 2.
For each hypothesis, experimental data was collected using a synthetic Java application, with the measurement of metrics obtained either through internal instrumentation of the code, or from the operating system via a native interface. All tests were executed in a university research computing lab using two identical machines (Pentium IV 1.8 GHz, 256 MB, Windows 2003 Enterprise Server OS) in a client server configuration via a 100 Mbps Ethernet link. The test machines were disconnected from the main university network.
To broaden the applicability of the tests beyond the simple configuration described above, a number of tests were replicated with different devices (e.g. laptops, PDAs and smart-phones) and networks links (e.g. 56 Kbps modem, ADSL, 11 Mbps wireless etc.).
The empirical data was analysed using linear correlation analysis [13] (via SPSS [14]), a technique commonly used in exploratory software engineering research [15]. The hypotheses established in section 2
were statistically significant at the 0.01 level and all correlation coefficients are greater than 0.95, indicating a non-trivial association of the code metrics with efficiency metrics (the raw data is available upon request). All correlation coefficients are positive, implying greater usage of resources and higher times (i.e. worse performance).
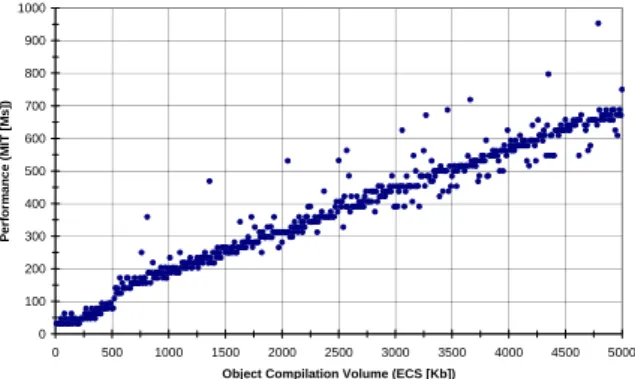
As stated previously, the authors are aware of factors not encompassed by the metrics described in this paper, which may have an impact on performance. These include scheduling policies, memory management, garbage collection etc., the effect of which can be seen in the form of the outliers in Figure 1. Nevertheless the linear relationship of the actual independent and dependent factors is clearly visible and dominant. 0 100 200 300 400 500 600 700 800 900 1000 0 500 1000 1500 2000 2500 3000 3500 4000 4500 5000
Object Compilation Volume (ECS [Kb])
Pe rf or manc e ( M IT [ M s ])
Figure 1. Scatterplot of Object Compilation Volume versus Migration Performance
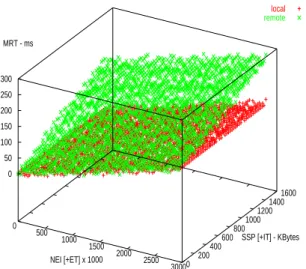
Having established the significance of the simple pair wise relationships, the next step was to examine composite relationships affecting the performance of distributed objects in a mobile application. Figure 2 shows the impact on total method response time [RT] (method invocation time [IT] + execution time [ET]), for both local and remote method invocations, as method body intensity [NEI] and method interface volume [SSP] grow. From this graph we can draw a number of useful conclusions. Firstly, for two machines with identical processing power and load, the factor that differentiates the total method response time for local versus remote calls, is the invocation cost incurred by the interface volume of the call parameters. Therefore, in terms of selecting candidates for distributed versus local execution, it is clear that methods whose computational intensity is high [NEI] compared to their communication requirements [SSP], are less impacted by remote execution.
Figure 3 shows the impact of processor load on remote versus local method call response time for a
combination of high and low load client and server machines. Method invocation volume remains null due to a void interface, and thus invocation time remains constant. The graph expresses the difference in terms of remote minus local response time. Therefore, as expected, as load increases on the client (and thus the site of the local call) the response time of the remote call is less than the local call.
local remote 0 500 1000 1500 2000 2500 3000 NEI [+ET] x 1000 0 200 400 600 800 1000 1200 1400 1600 SSP [+IT] - KBytes 0 50 100 150 200 250 300 MRT - ms
Figure 2. Difference between Local and Remote Method Response Time
-600 -400 -200 0 200 400 600 800 0 50 100 150 200 250 300 NEI [Millons] ET L - E T R [M il li s econds]
High Load Client - Low Load Server Low Load Client - Low Load Server
High Load Client - High Load Server Low Load Client - High Load Server
Figure 3. Impact of processor load on local (ETL) versus remote method execution time (ETR)
4.
Modelling Local Adaptation
This section builds a model, represented by a series of mathematical equations, based on the metrics introduced in section 2 and empirically evaluated in section 3. In general, the practical application of this model is an adaptive mobile application framework in
which an intelligent system controller collects software code metrics describing the objects that constitute applications in the system, and makes decisions in terms of object clustering and placement. In this context, two broad adaptive decision making strategies are defined in this paper.
First, a global adaptation strategy whereby the
application is analysed as a whole, and optimisation performed in terms of mapping objects or object clusters to nodes. Whilst this strategy is likely to be expensive, it has the potential to yield the greatest efficiency, and thus would be run at start-up, in periods of low application activity, or on demand. The global strategy is discussed further in terms of future work in section 5.
The second, called local adaptation, is more
dynamic and reactive and involves an individual node making a decision to move one object at a time to another host when either a performance or resource utilisation threshold is met. This type of adaptation is expected to have a significantly lower cost than global optimisation. As such it would take place more frequently, in order to maintain pre-specified levels of performance and resources utilisation in a dynamic environment comprising a constantly changing set of resources, as described in section 1.
This paper explicitly models local adaptation as a series of equations, with performance and resource utilisation treated separately in sub-sections 4.1 and 4.2. Note that efficiency is achieved by obtaining a balance between these two factors.
4.1.
Performance
Equation 1 describes the general performance case for object migration based on local adaptation.
Migration occurs when the performance difference
between two nodes (rtd), following migration of an
object from one node (currentC) to another
(destinationD), exceeds a specific threshold (rtk).. The
performance difference is measured in terms of
aggregate method response time (rt) across a certain
number of invocations (ni) for all methods of the
object being considered for migration.
This equation could also be used for load balancing in terms of resource utilisation (section 4.2) where a
negative rtk specifies the lowest bounds of
performance degradation acceptable in order to balance load. Note that variables in non-italicised bold represent previously defined metrics from Table 1.
[
rt rt]
mot rt m i D i C i i d =∑
=1.. NI *( − ) − (1)where
• mot: total time for migration of object (see equation
1a)
• rti: actual (or estimated) total response time of
method i (see equation 1b)
• m: number of methods of the object
mot = MCT(ECS, NU) + MIT(SOS, NU) (1a)
rt = IT(SSP, NU) + ET(NEI, PU) (1b) Equations 1a and 1b summarise relationships that are implicit in the hypotheses of section 2. Firstly, total object migration time comprises both class migration time (assuming it is not cached), which is a function of executable code size and network usage, and instance migration time which is a function of serialised object size and network usage. Secondly, total method response time consists of invocation time (which is a function of the size of the serialised parameters and network usage) plus execution time (which is a function of the number of executed instructions and processor usage).
4.2.
Resource Utilisation
Equation 2 models the decision making process concerning whether an object should be migrated in order to more evenly distribute resource usage across
nodes. Migration occurs when the difference (rud)
between the current and future resource usage (ru) of
two nodes, following migration of an object from one
node (currentC) to another (destinationD), exceeds a
user-defined threshold (ruk). This avoids over-reactive
behaviour wherein the migration of an object has an insignificant impact on utilisation.
The basic formula of equation 2 has been generalised for the three resource types investigated in
this paper: memory, network and processor2. Note
however that for each of these three resource types, specific definitions of the sub-variables (rui and ruF) of
object resource utilisation (ruO) are given. These
definitions, which are expressed in terms of the metrics
presented in this paper, are provided for memory (mui
and muF), network (nui and nuF) and processor (pui and
puF) in equations 2b-2d respectively. As in the
previous section, non-italicised bold indicates metrics from Table 1.
2 Other resources such as mass-storage capacity and power
consumption are to be studied in future work.
Note that in practice this resource utilisation model would be used in conjunction with the performance model described in section 4.1. This would be done in order to provide a suitable balance of efficiency in terms of performance versus resource utilisation as described in section 5.1. D O D C O C D D C C d rc ru ru rc ru ru rc ru rc ru ru = − − − − + (2) where
• ruC, ruD: resource usage at the current and
destination nodes of the object respectively
• rcC, rcD: total resource capacity of the current and
destination nodes of the object respectively. The measurement units for the resource capacities of memory, processor and network are presented in Table 1.
• ruO: object resource usage (see equation 2a)
Equation 2a defines the resource usage of an object
(ruO) comprising a fixed usage component (ruF) plus
an average, based on the usage of individual methods
(rui) considering the number of invocations (NIi) of
each.
(
)
m ru ru ruO = F+∑
i=1..m i*NIi (2a) where• m: number of methods of the object
• ruF: fixed resource usage component (independent
of method usage)
• rui: resource usage of method i
muF = OMS, mui = EMS (2b)
nuF = SOS + ECS3, nu
i = SSP (2c)
puF= 0, pui = f(NEIi,PC) (2d)
Equation 2b shows that in the case of memory utilisation, the fixed usage component is defined by the
static object memory size (OMS), and the per method
component by execution memory size (EMS).
Equation 2c is similar with executable code size (ECS)
and serialised object size (SOS) forming the fixed
component and size of serialised parameters (SSP)
constituting the per method element.
3
Equation 2d differs more substantially with no fixed component, and per method usage being a function of
number of executed instructions (NEI) and the
processing capacity (PC). Note that in practice this
function would be used for each type of processor under consideration. For example, in the Java
language, the function would map NEI to processor
usage by approximating NEI/s for a given processor.
5.
Practical Applicability
Software engineering measurement is not merely about defining new metrics, but about building new theories that can help solve practical problems [16]. As stated previously, one of the main goals of this research is to provide middleware support enabling mobile applications to maintain specified levels of efficiency.
5.1.
Local Adaptation
In the case of local adaptation, as modelled in section 4, a reactive/adaptive decision is typically triggered by the utilisation of a resource that at some point in time exceeds a predetermined threshold. The objective of this adaptation is to distribute the utilisation of resources whilst maintaining (or improving) performance.
However, performance and resource utilisation are attributes that generally conflict with each other and since compromises may have to be reached, this decision is not trivial even for the simplest scenario of two objects and two machines. Additionally, a more typical case may involve numerous application objects and many nodes, and thus achieving an effective decision requires an appropriate process.
Therefore, in order to test the ability of our model to support such decision making, whilst yielding a tangible benefit in terms of efficiency, an empirical study was conducted by deploying a prototype of a Taxi Dispatching System (TDS) on the MobJeX framework [2]. The TDS application was chosen because it is simple enough to be described within this paper, but complex enough in terms of its design, functionality and object topology, to provide meaningful evaluation of the new metrics and models presented in this paper. Furthermore, the TDS application has sufficient scope to suggest explicit directions for future work.
MobJeX was chosen since it directly represents the type of middleware to which the metrics and models presented in this paper are aimed, and provides a working implementation of an object mobility system,
system controller and resource monitoring framework. For the TDS experiment, software metrics were collected directly via instrumentation in the TDS code, whereas resource utilisation and performance metrics were obtained via MobJeX.
The local adaptation decisions (which determine if and when a given object should migrate to another host) were calculated manually, with MobJeX supporting the adaptation via object migration where necessary. Therefore, the intention of this experiment is not to evaluate the efficiency of the metric collection and adaptation process itself, although this is the subject of ongoing work. Rather, this experiment aims to demonstrate that the model and metrics presented herein can support the objective placement of application objects to hosts in a distributed mobile application, in order to improve efficiency compared with the baseline of random adaptation.
Furthermore, neither was the focus of this experiment the efficacy of a particular adaptation strategy tailored for a specific application such as the TDS, but rather an exploratory or prima facie evaluation of the application of metrics and models to a representative distributed application.
The experiment was conducted under the same laboratory conditions, using three machines of the same specification, as described in section 3.
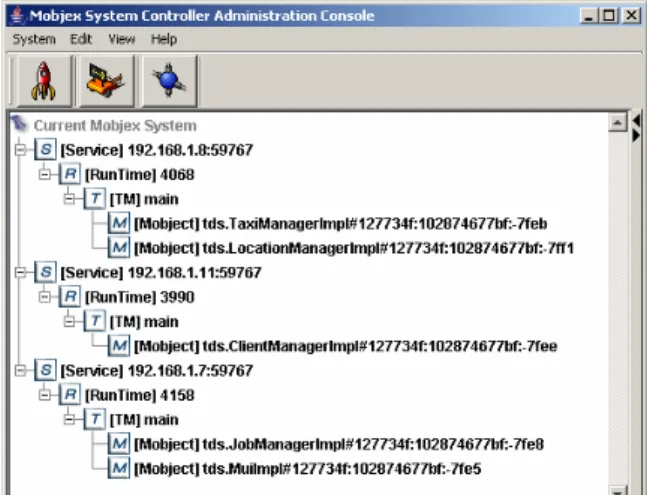
Figure 4. MobJeX administration console showing deployment of the TDS application
Figure 4 is a screen shot of the administration console of MobJeX, showing the TDS application loaded with its five mobile objects allocated onto three nodes based on the algorithm presented in Figure 5 and evaluated in the rest of this section. The mobility subsystem of MobJeX is presented in detail in [2] but is summarised here to help illustrate the experimental
procedure that was followed. Briefly, the [s] icon represents a service (individual host), whilst the [r] and [t] components are object containers (runtime and transport manager respectively) forming an intrinsic part of the mobility subsystem. The [m] components (mobjects) are mobile objects, which can be transparently moved at runtime between hosts.
Figure 5 lists the local adaptation algorithm used to produce the results described below. The basic operation involves two load balancing loops whereby
ruk and rtk are varied until a load balance is reached
such that the difference in resource utilisation across nodes can no longer be improved. This algorithm was applied to the TDS application, which started with all of the main application objects on a single node. The
application was then adapted (favoring ru over rt) by
migrating objects to two other nodes until the balanced memory utilisation state (in which object migration could not improve the difference in memory utilisation between nodes) was reached.
// load balance for varying ruk andrtk
do
set ruk set rtk
// load balance for current ruk andrtk
do
// o is an object and n is a node
S = set of tuples <o, n, rud, rtd>
satisfying eq1 and eq2
if S = ø then
exit loop
else
if priority is ru then
s = tuple with maximum rud else // priority is rt
s = tuple with maximum rtd end if
migrate o(s) to n(s) end if
while r.load unbalanced
while r.load unbalanced
Figure 5. Local Adaptation Algorithm
Note that the TDS application design, based on five main object classes (a location manager [lm], client manager [cm], job manager [jm], taxi manager [tm], and user interface [gui]), was done using established Object-Oriented techniques [17]. A brief description of the main scenarios of the Taxi Dispatching System can be found in the Appendix.
Both the local and the random adaptation strategies began with all application objects residing on node 1,
and thus no balance of memory utilisation. Applying the local adaptation algorithm of Figure 5 involved three cases of object migration, resulting in node 1 containing [mui] and [jm], node 2 [tm] and [lm], and node 3 [cm]. The random adaptation was similar, with [mui] and [lm] residing on node 1, [cm] and [tm] on node 2, and [jm] on node 3).
The maximum percentage resource utilisation difference was calculated for both the random and local adaptation strategies. Additionally, response time data was collected for 14 usage scenario with each executed and measured 100 times. The object call graph of the scenarios spanned from 2 to greater than 10 method calls.
The maximum percentage resource utilisation difference between the three nodes in the random distribution was above 50% whereas the difference in the local adaptation version was less than 25%. Of additional note, the average scenario response time for the local adaptation version was 504ms versus 845ms for random adaptation. Therefore not only did the local adaptation algorithm provide better resource utilisation, which was the principal aim of this study, it also provided superior performance and thus greater efficiency as well.
Thus in summary, although the local adaptation algorithm is relatively simple, it illustrates the benefit of applying the metrics and models of this paper to a practical application, thus providing a basis for further large scale studies. Also, note that the performance improvement compared with the baseline random adaptation was achieved in the least favourable situation of identical hardware and similar resource usage, in which there is less flexibility in terms of adaptation, thus again demonstrating a promising outcome.
5.2.
Global Adaptation
Section 4 introduced the concept of a global
adaptation strategy whereby the application is optimised as a whole in terms of object layout. Although a thorough investigation of global adaptation in terms of modelling, implementation, and evaluation compared with local adaptation, is beyond the scope of this paper, this subsection describes a basic graph-based approach for mapping objects into clusters for distribution to nodes.
The first step of the process is to generate a run-time dependency matrix (RDM) from the total object graph of an application (Figure 6). This matrix captures the run-time interaction or coupling across objects. A cell of the matrix represents the degree (or index) of co-locality dependence of a pair of objects,
and at the software level is a function of the code
metrics size of serialised parameters (SSP) and number
of executed instructions (NEI) (equation 3). As an
example, Figure 6 depicts the RDM of a simple application consisting of three objects, which represents, at the service or facade [18] level, a small distributed application based on a model/view/controller (MVC) approach [19].
∑
∈ = jk M m m m jk i NEI SSP (3) where• Mjk is the set of methods of object k invoked by
object j.
• ijk is the index of co-locality for the pair of objects j
and k.
O1 O2 O3
O1 - i12 i13
O2 i21 - -
O3 i31 - -
Figure 6. Object graph of a small OO application, and its corresponding RDM.
Figure 7. Two ways of clustering the same application.
The second step is to apply a clustering technique to partition the matrix so objects that are tightly coupled and thus have a high co-locality dependence (according to equation 3) are grouped together. As an example, although our simple MVC application could be clustered in different ways as shown in Figure 7, there is a high probability that one of the combinations would result in greater efficiency.
The final step is to map the clusters to nodes using a process similar to that described by the local adaptation equations of section 4 and tested in section
5.1, however substituting cluster based variables such as ruCL for object based variables such as ruO.
6.
Summary and Conclusions
Having recognised that distributed applications differ from their traditional fixed counterparts, and that context-aware mobile applications are even more complex, this paper has introduced a suite of metrics for such applications. Specifically, these metrics model the impact of software code attributes upon performance and resource utilisation, in terms of memory, network, and CPU usage in context-aware mobile applications.
Having defined these metrics from a comprehensive and critical analysis of the problem domain, a series of hypotheses were proposed and tested empirically using linear correlation analysis. With the results demonstrating the impact of software code attributes on the efficiency of mobile applications, a more formal model in the form of mathematical equations was proposed, in order to facilitate dynamic runtime placement of mobile objects in a context-aware mobile application framework. Preliminary empirical support for the model was obtained by studying a practical application, using a typical mobile system running on the MobJeX framework. More specifically the test demonstrated that applying the local adaptation strategies resulted in application efficiency, in terms of performance and resource utilisation, clearly exceeding that of a baseline random object distribution.
6.1.
Future Work
Although this paper has made a significant foray into an area that is not yet well understood, there are a number of limitations and opportunities that remain to be explored in the future which include, but are not limited to:
• Integration of the adaptation models into the
MobJeX framework, and the empirical evaluation of their effectiveness.
• Evaluation of the real-time overhead of metrics
collection and its impact on application performance under MobJeX.
• Analysis of additional resources such as
mass-storage and power [20].
• Evaluation of the software code attributes and their
associated metrics against other quality attributes such as reliability.
In closing, the present authors believe this paper to be one of the few reported empirical studies of metrics
O3 O2 O1 O3 O2 O1 O3 O2 O1
for distributed software, and the first involving the specific case of context-aware mobile applications. The results encourage further large-scale studies and it is expected that such a pursuit will suggest modifications and improvements to the metrics suite as additional understanding is achieved.
7.
Appendix
The Taxi Dispatching System (TDS) is intended to help an operator efficiently dispatch a fleet of taxis or limousines in response to calls from corporate customers. The system records details of currently working drivers and their present location, in order to control the allocation of taxis to incoming jobs. Drivers interact with the system via a local device connected by a wireless link, or via mobile phone when such a link is not available. In addition to immediately dispatching taxis in response to a customer call, the system supports a booking operation, where the customer requests that a taxi be made available at some time in the future. In this case, the system should dispatch a taxi automatically (without operator intervention) at the appropriate time. The system calculates the charge for each job and updates the customer account accordingly. Finally, the system maintains a list of customer accounts and manages the periodic generation of invoices.
8.
Acknowledgments
This work is part of the Applications Program of the Australian Telecommunications Cooperative Research Centre: http://www.atcrc.com/
9.
References
[1] W. Emmerich, Engineering Distributed Objects: Wiley, 2000.
[2] C. Ryan and C. Westhorpe, "Application Adaptation through Transparent and Portable Object Mobility in Java", In Proceedings: International Symposium on Distributed Objects and Applications (DOA 2004), Larnaca, Cyprus, 2004.
[3] J. Jing, A. Helal, and A. Elmagarmid, "Client-Server Computing in Mobile Environments," ACM Computing Surveys, vol. 31, pp. 118-157, 1999.
[4] J. McGovern and C. Ryan, "Adaptive Consistency Management Support for Limited Capacity Devices in Ad-hoc Mobile Networks", In Proceedings:
International Symposium on Collaborative Technologies and Systems, San Diego, USA, 2004.
[5] M. Ruhe, R. Jeffery, and I. Wieczorek, "Using Web objects for estimating software development effort for Web applications", In Proceedings: Ninth International Software Metrics Symposium, 2003.
[6] N. Fenton and S. Pfleeger, Software Metrics: A Rigorous and Practical Approach, Second ed. London: International Thompson Computer Press, 1996. [7] S. Morasca, "Measuring attributes of concurrent
software specifications in Petri nets", In Proceedings: Sixth International Software Metrics Symposium, 1999. [8] P. Rossi and G. Fernandez, "Definition and validation
of design metrics for distributed applications", In Proceedings: Ninth International Software Metrics Symposium, Sydney, 2003.
[9] P. Rossi and G. Fernandez, "Design Measures for Distributed Information Systems: an Empirical Evaluation", In Proceedings: International Workshop on Software Audit and Metrics (In conjunction with ICEIS), Porto, 2004.
[10] W. Tsuar and S. Horng, "A New Generalised Software Complexity Metric for Distributed Programs," Information and Software Technology, vol. 40, pp. 259-269, 1998.
[11] ISO/IEC, "Information Technology - Software Product Quality - Part 1: Quality Model." Geneva: International Standards Organisation, 2003.
[12] Sun Microsystems, "Java Remote Method Invocation URL: http://java.sun.com/products/jdk/rmi/," 2004. [13] R. Freund and W. Wilson, Regression Analysis:
Statistical Modeling of a Response Variable: Academic Press, 1998.
[14] I. SPSS, SPSS 8.0: User Guide. Chicago: SPSS Inc., 1998.
[15] L. Briand, S. Morasca, and K. El Emam, "Theoretical and Empirical Validation of Software Product Measures," International Software Engineering Research Network ISERN-95-03, 1995. [16] L. C. Briand, S. Morasca, and V. R. Basili, "An
operational process for goal-driven definition of measures," Software Engineering, IEEE Transactions on, vol. 28, pp. 1106-1125, 2002.
[17] I. Jacobson, G. Booch, and J. Rumbaugh, The Unified Software Development Process. Reading,
Massachusetts: Addison-Wesley, 1999.
[18] E. Gamma, R. Helm, R. Johnson, and J. Vlissides, Design Patterns: elements of reusable object-oriented software. Massachusetts, USA: Addison Wesley Longman, Inc., 1994.
[19] M. Fowler, Patterns of Enterprise Application Architecture: Addison-Wesley, 2002.
[20] G. Chen, B.-T. Kang, M. Kandemir, N. Vijaykrishnan, M. J. Irwin, and R. Chandramouli, "Studying energy trade offs in offloading computation/compilation in Java-enabled mobile devices," Parallel and Distributed Systems, IEEE Transactions on, vol. 15, pp. 795-809, 2004.