Analyzing System Behavior:
How the Operating System Can Help
Alexander Schmidt, Michael Sch¨obel Hasso-Plattner-Institute at University of Potsdam {alexander.schmidt,michael.schoebel}@hpi.uni-potsdam.de
Abstract:Never touch a running system! This proverb is essentially true when
deal-ing with complex mature software systems that have been run for years. When it comes to modifying certain aspects due to performance enhancements or to customer needs, maintainers spend quite significant time to understand the behavior of the whole system. As is practice today, only static documentation is available for such systems which is unsuitable for understanding the behavior.
In this paper, we present the Windows Monitoring Kernel (WMK), a custom-built version of the latest Windows 2003 Server operating system that includes a fine-grained logging infrastructure for arbitrary operating system (OS) kernel events. These events are suitable for monitoring a system’s behavior at runtime. The WMK infras-tructure is complemented by a reporting tool that visualizes these events and displays their dependencies with respect to some aspects. Furthermore, the WMK provides the possibility to use these events for understanding application behavior running in the Windows operating system.
1 Introduction
Since the introduction of the Windows NT operating system in 1993, very few details about the kernel structure and behavior have been known to the research community. While UNIX and Linux sources are freely available for research and analysis, Windows NT has always been aclosed source. In 2006, Microsoft changed its policy for the kernel sources [PP06].
The published kernel sources are known as the Windows Research Kernel1, based on the latest release of Windows 2003 Server Enterprise Edition, and uncover the core part of the kernel. As only limited documentation is available of how things work inside the kernel, we prepared a modified WRK version, called Windows Monitoring Kernel (WMK). This paper presents the details of how WMK works. WMK adds an event logging infrastructure to the Windows kernel that allows logging of any arbitrary function/activity inside the source code. We also provide a reporting tool that allows post-mortem analysis such as diagrams or graphs.
1The WRK is available to academic institutions for research purposes [WRKa, WRKb]. The WRK can be
used to build customized variants of the Windows kernel. It requires a running instance of a Windows Server
The main contributions are as follows: (1) We built a modified version of the Windows NT kernel, (2) we implemented an efficient event logging infrastructure therein, and (3) we implemented a tool that analyzes and visualizes recorded events.
The rest of the paper is organized as follows: We firstly present the architecture of our event logging infrastructure. Secondly, we present two case studies highlighting the need for WMK for analyzing application specific behavior. Then, we will give a brief overview of existing event logging facilities, and finally, we will conclude and give some outlook on our future work.
2 The Windows Monitoring Kernel
The basic idea of the Windows Monitoring Kernel (WMK) approach is to replace an ex-isting Windows kernel (ntoskrnl.exe) with an instrumented one. After a reboot, the behavior of arbitrary applications can be monitored.
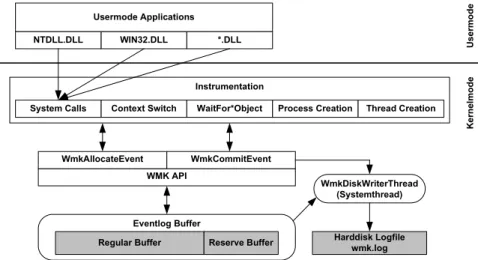
Figure 1 gives an overview of the WMK architecture. With slight modifications of the NT kernel, we provide the WMK event logging API to any NT subsystem; hence it can be used to log arbitrary events. At the moment, the following events are logged:
System service calls System calls are monitored to analyze which functionalities of the OS are required by an application. Time stamps help to identify those kernel services that most of the time is spent in.
Context switches Context switches denote the process of assigning the CPU from one thread to another. Logging this event is helpful to evaluate execution flows of a multi-threaded application.
Wait events are triggered when a thread waits on a particular synchronization event and when a wait can be satisfied. In combination with context switch events, these events are useful to identify potential deadlocks.
Process/thread creation and termination Process creation and termination mark the start and end point of an application’s existence. Threads denote different execution flows through an application and are interpreted as actors of an application.
Each monitored event creates an event log entry which contains a time stamp, a unique type identifier, an event specific, variable-length data set, and the data set length. Event log entries are stored within an event log buffer. This buffer is allocated in non-pageable kernel memory and is created at boot time. To enhance scalability on multiprocessor systems, one buffer is allocated per CPU. The optimal buffer size depends on the amount of events to be logged and is subject to future work2.
2For example, monitoring the Windows boot process requires a buffer size of approximately 16 MiB, leaving
!"#$%&'!#(#)*! +,'!#-*. 0%11'$ 2'.%-($ 0%11'$ 2'"'$,' 0%11'$ 345 67 3&86--*9(#'+,'!# 3&8:*&&)#+,'!# 3&8;)"83$)#'$<=$'(> ?@A"#'&#=$'(>B C($>>)"8 D*.1)-' E&8F-*. @A"#'& :(--" :*!#'G# @E)#9= 3()#H*$IJKL'9# 7$*9'"" :$'(#)*! <=$'(> :$'(#)*!
5 '$ !' -&* >' M "' $&* >' N<;DDF;DD 3 NOPF;DD IF;DD M"'$&*>' 6QQ-)9(#)*!"
Figure 1: WMK components - overview
Events occur potentially in parallel and occur frequently thus requiring a rapid event han-dling mechanism. The allocation of an event log entry must happen under mutual exclu-sion. OS synchronization objects are insufficient for this purpose as they exhibit blocking semantics, i.e., an event handler might block while another event handler is allocating an event log entry. Thus, we implemented a non-blocking allocation algorithm that uses atomic processor instruction to guarantee mutual exclusion. For example, on i386 archi-tectures, we use a compare-and-swap instruction that can atomically execute a comparison and swap operation.
To prevent the buffer from overflowing, we dump the event log to a secondary storage (WmkDiskWriterThread). This happens when the event log buffer exceeds a certain threshold. While flushing the buffer to disk, other events might occur. In order to not miss these events we provide a reserve buffer. When flushing has finished, we continue to use the regular buffer again and flush the reserve buffer to disk.
To log an event, instrumentation code first calls WmkAllocateEvent specifying the type of event that should be logged. Afterwards a pointer to the WMK buffer is returned providing enough space to hold event data. The instrumentation code can then fill in all event specific data to the buffer and finally commits the event (WmkCommitEvent) to indicate that an event has successfully been logged. The commitment is crucial to signal theWmkDiskWriterThreadthat all events in the event log are ready for flushing to disk.
3 Case Studies
First, we describe the Wait-for graph which is helpful for identifying the collaboration of threads via their synchronization connections. Second, a Process-thread graph is described
which can be used to analyze the process-thread hierarchy.
The Thread-priority diagram and Scheduling diagram are not presented in this paper. Other types of diagrams might be useful depending on the data classes acquired from our infras-tructure and are subject to future work.
3.1 Analyzing Synchronization Behavior
A common problem in complex multi-threaded applications is the analysis of their syn-chronization behavior and the analysis whether a potential deadlock may arise. Given only a static documentation or the source code of an application, it is difficult to figure out which thread waits for which synchronization object and which other threads wait for the same synchronization object. This behavior should be monitorable at runtime of a system. Basing on our wait event monitoring, we created a tool that dynamically analyzes and visu-alizes dependencies concerning synchronization objects acquired by different threads. For convenience, we used a simple consumer-producer-application [Dij68]. Figure 2 demon-strates the resulting wait-for dependency graph.
Inside this graph, a rectangle denotes a thread object. A thread object is specified by its thread identifier, the thread’s function name (if available3) and the thread object’s address. A diamond denotes a waitable object, e.g., semaphores, events, or threads. The diamond shape contains the object type as well as the object address. A directed edge between a thread and a waitable object denotes that the thread waited for the object.
Figure 2: Wait-for Graph of a simple producer-consumer example.
Not surprisingly, the producer and the consumer thread both wait for a mutant object, a Windows synchronization primitive for assuring mutual exclusion. Also, the main thread (executing themainfunction of a C program), waits for both child threads to finish their execution. Each thread, consumer and producer, also waits for another semaphore object
not related to solving the producer-consumer-problem. The purpose of this semaphore is beyond the scope of this paper; it is needed for implementing Local Procedure Calls (LPC) [RS05].
The Wait-for Graph can be created by connecting the WMK to the specific application that should be observed. The process handle is given to the logging infrastructure via a system service call. Note that this connection can even be established at runtime when the application has already started.
3.2 Analyzing Windows Boot Activity
We consider the Windows operating system as an example of a mature complex system that has been undocumented until now. The WMK allows to trace the (operating) system behavior.
To monitor the whole system the WMK must be globally enabled. The system service call which connects a specific process handle to the infrastructure is not necessary (and makes no sense). With a globally enabled WMK, even the boot process can be traced. Furthermore, inter-application dependencies can be analyzed.
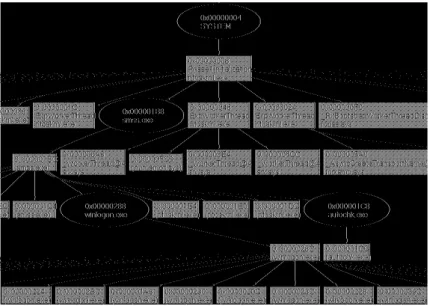
As an example, figure 3 shows a section of the process/thread relation of the windows boot procedure. Processes (ellipses) and threads (yellow boxes) are shown. If possible, the thread function name is extracted from the application debug information (PDB files).
Figure 3: Windows boot process - thread/process relation
The graph edges illustrate the hierarchy dependency. In this way you can analyze which thread or process is started by which thread.
You can see that the Windows system process (at the top of the graph, with the id 0x00000004) starts thePhase1Initializationthread which starts all other system threads and initializes the whole system.
Analyzing the process-thread creation can be useful to get a high-level overview of the components of a monitored system. Such an analysis can be the starting point of further analysis, e.g. considering synchronization behavior.
4 Related Work
Instrumenting applications at operating system level has been well investigated. On Win-dows operating systems, the major comprehensive analysis tool at operating system level is
perfmon[RS05]. Perfmon queries built-in Windows performance counters and generates diagrams that help system administrators to identify bottlenecks in the operating system. Performance counters have to be queried by a Windows API, restricting the frequency of the requests. For example, it is impossible to trace every context switch, because the con-text switch counter might already have changed while the result of a query is transfered to the monitoring thread.
The Linux Trace Toolkit (LTT) [YD00] was created to instrument the Linux operating system at source code level. It also provides an efficient event logging infrastructure but requires a user mode deamon to transfer logged events to the file system. This implies that the buffer containing logged events can be dumped to the file system at a late stage in the boot process which requires a bigger buffer size to guarantee that no events will be lost. Especially on multiprocessor systems this approach does not scale well.
A more flexible approach is taken by DTrace [CSL04] which allows dynamic modification of kernel code in order to instrument it. It instruments the kernel by replacing the opcode at a specified instruction address with a jump instruction to an instrumentation routine. The ability to add events at runtime makes the tool much more flexible than WMK. But DTrace has a major drawback: The locations where instrumentation code can be placed is limited by available providers. As long as there is no provider for an arbitrary code location, DTrace is unable to log events at that location.
5 Conclusion and Outlook
We presented the WMK infrastructure for logging arbitrary OS kernel events. We imple-mented a prototype according to our architectural model and monitored several applica-tions. The results of our monitoring can be used for further analysis by our visualization tool. We showed that the Wait-for graph is suitable for analyzing synchronization behavior of multi-threaded applications. The Process-thread graph can be used to get a high-level overview on the runtime behavior of an application.
We will investigate to what extent the operating system’s execution time is effected by WMK event logging. Also, we will investigate impacts on the OS’s behavior caused by the non-paged memory pool consumptions. We will also focus on more sophisticated analysis scenarios (e.g. detect deadlock occurrence or calculate performance characteristics) and additional instrumentation points (e.g. logging system call parameters or page faults).
6 Acknowledgments
We would like to thank Dave Probert for his engagement in disclosing the Windows NT source code. This paper would not have been possible, if the WRK had not been released in 2006.
References
[CSL04] Bryan Cantrill, Michael W. Shapiro, and Adam H. Leventhal. Dynamic Instrumentation of Production Systems. InUSENIX Annual Technical Conference, General Track, pages 15–28, 2004.
[Dij68] EW Dijkstra. A constructive approach to the problem of program correctness. BIT Nu-merical Mathematics, 8(3):174–186, 1968.
[PP06] Andreas Polze and Dave Probert. Teaching operating systems: the Windows case. In SIGCSE ’06: Proceedings of the 37th SIGCSE technical symposium on Computer science education, pages 298–302, New York, NY, USA, 2006. ACM Press.
[RS05] Mark E. Russinovich and David Solomon.Microsoft Windows Internals. Microsoft Press, 4th edition, 2005.
[WRKa] Windows Research Kernel. http://www.microsoft.com/resources/sharedsource/Licensing/ researchkernel.mspx.
[WRKb] WRK@HPI. http://www.dcl.hpi.uni-potsdam.de/research/WRK/.
[YD00] Karim Yaghmour and Michel R. Dagenais. Measuring and Characterizing System Behav-ior Using Kernel-Level Event Logging. InProceedings of the USENIX Annual Technical Conference, pages 13–26, June 2000.