www.ssoar.info
Corporate governance, capital market discipline
and the returns on investment
Gugler, Klaus; Mueller, Dennis C.; Yurtoglu, B. Burcin
Veröffentlichungsversion / Published Version Arbeitspapier / working paper
Zur Verfügung gestellt in Kooperation mit / provided in cooperation with:
SSG Sozialwissenschaften, USB Köln
Empfohlene Zitierung / Suggested Citation:
Gugler, K., Mueller, D. C., & Yurtoglu, B. B. (2001). Corporate governance, capital market discipline and the returns on investment. (Discussion Papers / Wissenschaftszentrum Berlin für Sozialforschung, Forschungsschwerpunkt Markt und politische Ökonomie, 01-25). Berlin: Wissenschaftszentrum Berlin für Sozialforschung gGmbH. https://nbn-resolving.org/urn:nbn:de:0168-ssoar-115447
Nutzungsbedingungen:
Dieser Text wird unter einer Deposit-Lizenz (Keine Weiterverbreitung - keine Bearbeitung) zur Verfügung gestellt. Gewährt wird ein nicht exklusives, nicht übertragbares, persönliches und beschränktes Recht auf Nutzung dieses Dokuments. Dieses Dokument ist ausschließlich für den persönlichen, nicht-kommerziellen Gebrauch bestimmt. Auf sämtlichen Kopien dieses Dokuments müssen alle Urheberrechtshinweise und sonstigen Hinweise auf gesetzlichen Schutz beibehalten werden. Sie dürfen dieses Dokument nicht in irgendeiner Weise abändern, noch dürfen Sie dieses Dokument für öffentliche oder kommerzielle Zwecke vervielfältigen, öffentlich ausstellen, aufführen, vertreiben oder anderweitig nutzen.
Mit der Verwendung dieses Dokuments erkennen Sie die Nutzungsbedingungen an.
Terms of use:
This document is made available under Deposit Licence (No Redistribution - no modifications). We grant a exclusive, non-transferable, individual and limited right to using this document. This document is solely intended for your personal, non-commercial use. All of the copies of this documents must retain all copyright information and other information regarding legal protection. You are not allowed to alter this document in any way, to copy it for public or commercial purposes, to exhibit the document in public, to perform, distribute or otherwise use the document in public.
By using this particular document, you accept the above-stated conditions of use.
discussion
papers
FS IV 01 – 25
Corporate Governance, Capital Market
Discipline and the Returns on Investment
Klaus Gugler, Dennis C. Mueller
and B. Burcin Yurtoglu
University of Vienna
December 2001
ISSN Nr. 0722 - 6748
Forschungsschwerpunkt
Markt und politische Ökonomie
Research
Area
Zitierweise/Citation:
Klaus Gugler, Dennis C. Mueller and B. Burcin Yurtoglu,
Corporate Governance, Capital Market Discipline and the Returns on Investment,Discussion PaperFS IV 01-25, Wissenschaftszentrum Berlin, 2001.
Wissenschaftszentrum Berlin für Sozialforschung gGmbH, Reichpietschufer 50, 10785 Berlin, Tel. (030) 2 54 91 – 0 Internet: www.wz-berlin.de
ABSTRACT
Corporate Governance, Capital Market Discipline and the Returns on Investment
*by Klaus Gugler, Dennis C. Mueller and B. Burcin Yurtoglu
We analyze the impact of corporate governance institutions, ownership structures and
external capital market constraints on company returns on investment by using a sample
of more than 19,000 companies from 61 countries across the world. We show that (1) of
these three sets of institutions, the origin of a country’s legal system proves to be the
most important. Companies in countries with English-origin legal systems earn returns
on investment that are at least as large as the cost of capital. (2) Differences in
investment performance related to a country’s legal system dominate differences related
to ownership structure. (3) Strong external capital markets improve the investment
performance of companies.
Keywords: Return on Investment, Ownership Structure, Corporate Governance, Capital Market JEL Classification: G32, G34, L21
ZUSAMMENFASSUNG
Corporate Governance, Kapitalmarktdisziplinierung und die Renditen von
Unternehmensinvestitionen
Dieses Papier analysiert den Einfluß von Corporate Governance Institutionen,
Eigentümerstrukturen und externen Kapitalmärkten auf die Renditen von Investitionen
für ein Sample von mehr als 19.000 Unternehmen aus 61 Ländern weltweit. Wir zeigen,
dass von diesen drei Institutionen (1) die Herkunft des Rechtssystems eines Landes der
wichtigste Faktor ist. Unternehmen in Ländern mit Rechtssystemen englischer Herkunft
verdienen Renditen, die die Kapitalkosten im Durchschnitt abdecken. (2) Unterschiede
im Rechtssystem eines Landes dominieren Unterschiede in der Eigentümerstruktur. (3)
Funktionierende externe Kapitalmärkte verbessern die Performance von Investitionen.
*
The research in this article was supported in part by the Austrian National Bank’s Jubiläumsfonds, Project 8090. The article has benefited from comments of Lars-Hendrik Röller, Ajit Singh, Andy Cosh, Alan Hughes, Paul Guest and seminar participants at the CBR, University of Cambridge and WZB, Berlin.
Like all good theories, the neoclassical theory of investment, as first formulated say by Modigliani and Miller (1958), derives strong and refutable predictions from an elegant and simple model. Assuming that managers maximize the wealth of their shareholders, they invest until the point where their cost of capital equals the marginal returns on investment. Since the cost of capital is the same for internally and externally raised funds, investment levels are independent of how they are financed, and for the same reason, the returns on investment are predicted to be the same for all companies, abstracting from differences in corporate risk.
A large empirical literature contradicts each of these predictions. Investment appears to be related to the source of finance suggesting the existence of a hierarchy of finance.1 Funds raised from outside of a firm to finance investment cost more than internal cash flows. Estimates of returns on corporate investment vary widely and are often substantially below company costs of capital.2 A variety of hypotheses have been put forward to explain these empirical findings including the existence of differential transaction costs in using the external capital market to finance investment (Duesenberry, 1958), asymmetric information, which raises the costs of using external capital markets (Stiglitz and Weiss, 1981; Myers and Majluf, 1984), and agency problems that allow managers to select investment levels that do not maximize shareholder wealth (Baumol, 1959; Marris, 1964, 1998; Grabowski and Mueller, 1972).
Much of the theoretical work on investment has consciously or implicitly assumed the existence of an “Anglo-Saxon” institutional environment. Companies are isolated legal entities, which contract with other independent legal entities or individuals when they raise capital externally. Thus arises the possibility that the managers inside of a firm have different information about the returns on investment projects from the information available to potential suppliers of finance outside the firm. Common share ownership is assumed to be widely dispersed, resulting in deficient monitoring of managers and agency problems. Most of the empirical work that has tested these hypotheses about investment has also used datasets drawn from Anglo-Saxon countries like Canada, the UK and the USA.
Hoshi, Kashyap and Scharfstein (1991) were among the first to demonstrate the importance of the institutional environment to these hypotheses. They showed that the kind of asymmetric information problems that can produce a relationship between cash flows and investment in Anglo-Saxon countries do not exist for Japanese companies belonging to groups, which generally include both other companies and a group bank. A group firm’s “external sources of finance” have access to the same information as its managers do, and thus external capital carries no premium with it, and internal cash flows lose their power to explain levels of investment.
In the last decade several additional studies have appeared that confirm the importance of institutional factors in explaining corporate investment with data from non Anglo-Saxon countries. One set of studies has stressed the importance of institutional factors in explaining why and when cash flows are significant determinants of capital investment and R&D.3A second line of research examines how cross-national differences in capital market and corporate governance institutional structures are related to measures of performance like productivity and economic growth.4
Our work also emphasizes the importance of institutional factors in determining a country’s economic performance, but differs from this other research in that we use a measure of performance that is directly tied to the micro-theory of the firm – the ratio of a firm’s returns on investment to its costs of capital. We focus upon three sets of institutions: (1) the corporate governance structure of a country as defined by its legal system, e.g., rules governing takeovers, the composition and election of boards of directors, etc. (2) the ownership structure of a company, and (3) the strength of a country’s external capital market. The first two sets of institutions determine how closely a manager's goals are aligned with those of the owners of a firm, and thus the extent to which a firm’s investment performance may suffer from agency problems. The third set of institutions determines the extent to which a firm’s investment performance is constrained by the capital market regardless of how closely managers’ and owners’ interests coincide. Our paper presents evidence that all three sets of institutions can affect the investment performance of companies in a given country.
We proceed as follows: The main hypotheses tested are developed in the following section. Section II describes the methodology employed to measure returns on investment and test the different hypotheses. The data used in these tests are discussed in section III. The results regarding the effects of corporate governance and ownership structures are presented in section IV, and regarding external capital markets in section V. Conclusions are drawn in the final section.
I. Main Hypotheses
A. Legal Institutions and Returns on Investment
A firm that maximizes shareholder wealth invests up until the point where the marginal
return on investment equals its cost of capital. In our empirical work we measure what effectively amounts to a marginal Tobin’s q, qm, where qm=r i and r is the average rate of return on a firm’s investment, and i is its cost of capital. Since the average return of investment should be equal to or greater than the marginal return, we predict for a firm, which maximizes shareholder
wealth, qm≥1.
We shall define a strong corporate governance system as one, which aligns managerial and shareholder interests and thus leads managers to maximize shareholder wealth. Managerial and shareholder interests are more likely to be aligned in countries in which it is easy for shareholders to monitor managers, and initiate proxy fights or hostile takeovers if they are displeased with their company’s performance. La Porta, Lopez de Silanes, Shleifer and Vishny (1997, 1998, hereafter LLSV) have recently categorized the legal environments of countries according to the protections of this sort that they give to shareholders. We shall employ their categorization as a measure of the strength of a country’s corporate governance system, and use it to test:
Hypothesis 1: For companies located in countries with strong corporate governance systems, 1
m q ≥ .5
Weak corporate governance systems allow managers to pursue their own goals at the shareholders’ expense. Recent research has focused on the conflict between managers and shareholders over dividend payments (LLSV, 2000; Faccio et al., 2001; Gugler and Yurtoglu, 2000). Where corporate governance systems are weak managers pay out less in dividends and retain larger fractions of their cash flows to pursue their own goals. Among these may be the pursuit of size and growth as emphasized in the earlier managerial discretion literature.6 The flip side of paying out too little dividends is investing too much. This reasoning leads us to expect
1 m
q < , in countries with weak corporate governance systems.
Some firms have attractive investment opportunities and limited financial resources, however, and both their managers and their shareholders benefit from their achieving high investment rates and rapid growth. For these companies no conflict between managers and shareholders over dividend and investment policies exists. Indeed, these companies are often young firms in rapidly growing industries – the kinds of companies that can suffer from asymmetric information problems – and thus are likely to under invest, so that qm≥1. This consideration leads us to qualify our prediction for weak corporate governance systems.
Hypothesis 2: For companies with limited investment opportunities that are located in countries with weak corporate governance systems, qm<1.
B. Legal Institutions, Ownership Structures and Returns on Investment
Of necessity a manager’s interests are aligned with those of a shareholder, if the shareholder and manager are one and the same person. Thus, a necessary condition for the existence of a
conflict of interest between managers and shareholders is for there to be a separation of
ownership from control, and all early contributions to the managerial-discretion literature cited Berle and Means (1932) to this effect. This literature implicitly assumed that when ownership was concentrated, either the managers themselves or an outside family held the controlling stake in the firm. In either case it was assumed that the owners wished to have the managers maximize their wealth, and thus that manifestations of managerial discretion, like low returns on investment, would be observed only when share ownership was widely dispersed. This hypothesis will be
tested by comparing the mean qm for companies with widely dispersed ownership with the mean
for other companies in countries with strong corporate governance structures.
Hypothesis 3: In countries with strong corporate governance systems, companies with widely dispersed shareholdings have lower qms than the other companies in their country group.
Joseph Schumpeter (1911, 1934, p. 94) was perhaps the first economist to postulate that managers are empire builders. Schumpeter did not put forth this assumption to explain the actions of Berle/Means managers who own small fractions of shares, however, but as a description of the goals of the owner-entrepreneurs who founded the giant enterprises that appeared in the late 19th
and early 20th centuries, individuals whom he likened to “medieval knights” seeking to found
“dynasties.” The intrinsic rewards from running a giant enterprise may appeal to professional and owner managers alike. Moreover, the persons typically classified as owner managers do not own all of the company’s outstanding shares. Thus, a manager/shareholder conflict still is possible with respect to the interests of minority shareholders. In addition, in countries where takeovers and proxy contests are relatively easy to initiate, a manager’s immunity to such attacks increases with her shareholdings. Thus, a priori it would seem that managers’ incentive to maximize shareholder wealth might increase or decline with their shareholdings. Consistent with this
ambiguity, Morck, Shleifer and Vishny (1988) have observed for the U.S. that Tobin’s q first
rises, then falls and finally rises again as managers’ shareholdings increase. These considerations lead us to conclude that no simple predictions about the values for qm for companies controlled by individuals or families can be made for countries with strong institutional protections of minority shareholders.
countries we do not expect to observe as many companies with dispersed share ownership as in countries with strong protections of minority shareholders. Investors will be unwilling to bid large sums for shares when they know that they can be exploited by the dominant shareholders, and the
owner-founders will therefore not issue many shares.7When one observes a company with widely
dispersed ownership in a country whose legal institutions do not protect minority shareholders, one must assume that the company had sufficiently attractive investment opportunities, or the original dominant owners were somehow able to bond themselves to not exploit minority shareholders, so that they were able to issue many shares. These firms can be expected to earn relatively high returns on investment, and thus we obtain:
Hypothesis 4: In countries with weak corporate governance systems, companies with widely dispersed shareholdings have higher qms than the other companies in their country group.
Although the existing literature leads to the prediction that individually-controlled companies have higher returns on investment than other companies in countries with strong corporate governance systems, no similar prediction can be made for individually-controlled companies in countries with weak corporate governance systems. All companies in our sample have issued common shares, which are traded on organized securities markets. The individual or family who controls a company, which we have categorized as individually-controlled, owns the largest block of the company’s shares, but not all of them. Any funds distributed to all shareholders must thus be shared with other shareholders. Thus if it is possible, the individual or family who controls a company may try to appropriate company funds in ways that do not add value to the company’s shares. Weak corporate governance systems provide greater scope for the exploitation of minority shareholders by the dominant shareholder, and make it impossible to predict whether individually-controlled companies in countries with weak corporate governance systems will exhibit superior investment performance.8
Similar difficulties arise in trying to hypothesize about the relative performance of companies falling into the remaining three ownership categories that we identified: firm-controlled, finance-controlled and state-firm-controlled, where by finance-controlled we mean controlled by a bank, insurance company or some other financial institution. For example, it is reasonable to expect that those in control of any firm A, even if they are empire builders, will want the managers of any firm B that A controls to maximize its profits, as this provides more funds for A to pursue the goals of those who control it, whatever they may be. Thus, we might expect higher returns on investment for firms that are controlled by other companies.
On the other hand, there are several reasons why companies lower down in a pyramid may exhibit poor investment performance: (1) the families standing behind these pyramids are empire builders who are willing to sacrifice profits at all levels of the pyramid in pursuit of their goals, (2) the pyramid’s size makes careful monitoring of lower-level firms difficult, and (3) the performance of lower level firms is sacrificed to benefit the parent firm at the top of the pyramid.9 Given these conflicting possibilities, we do not think that it is possible to make specific predictions regarding the investment performance of companies controlled by other companies. We shall, however, test to see whether this category of ownership is associated with systematic differences in investment performance. We examine the effects of cross-ownership and corporate pyramids separately.
Predicting the effects of financial control on investment performance is equally difficult. Banks and other financial institutions are also susceptible to agency problems between their managers and ultimate owners. Merger activity in the banking sector of the United States and Europe in recent years suggests that some bank managers may also find empire-building to be an attractive pursuit. A bank’s managers may condone and even finance the aggressive expansion programs of firms that it controls so long as they can pay the interest on debt owed to the bank, since the bank’s growth rate is positively linked to that of these firms. Thus, companies controlled by financial institutions might not perform any better than other companies. Germany’s strong economic performance during the first quarter century following World War II has often been attributed to wise advice and careful monitoring of the private sector provided by its major banks and other financial institutions. Many observers now think that the role of banks in Germany has been exaggerated, however.10 Some observers even blame major banks in Asia for making the “crisis” of the late 1990s worse than it would have been11. We shall test for any systematic effects of control by financial institutions on company investment performance, but make no predictions as to what this effect should be.
A double principal-agent problem can be said to exist, in the case of state-controlled firms. Their ultimate owners are the citizens of the state. The same free-rider logic that makes shareholders poor monitors of managers when shares are widely dispersed, makes citizens poor monitors of politicians. Thus, citizens are unlikely to hold politicians accountable for the poor investment performance of a state-owned company, and elected politicians may not exert great effort monitoring these companies in the citizens’ interests leading to poor investment performance. On the other hand, state-controlled firms are often located in key economic sectors and possess dominant market positions. These favorable circumstances might create sufficiently attractive investment opportunities for state-controlled companies to offset the inefficiencies
caused by agency problems. We again leave it to the data to sort out these conflicting tendencies. C. Capital Market Discipline and Returns on Investment
Consider Figure 1. Investment outlays are given along the horizontal axis, and marginal returns on investment (mrr) and the cost of capital, i, along the vertical axis. If the costs of external and internal capital are the same, a firm with marginal returns on investment of mrrH and internal cash flows CF, maximizes shareholder wealth by investing IH and raising (IH - CF) on the external capital market. Its mrr=i, and its average return on investment, r, will be greater than i making qm=r i >1.
If the costs of external capital are greater than for internal capital because of the transaction costs of issuing bonds and equity, or because of asymmetric information problems between managers and the capital market, the shareholder-wealth-maximizing firm invests less than IH and
mrr >i, and qm rises still further above one. Thus for firms that maximize shareholder wealth, their returns on total investment should be greater than their costs of capital, and this relationship should hold regardless of the source of investment funds. We shall use subscripts to designate sources of investment funds:
,
m I
q = the ratio of r to i for total investment,
,
m CF
q = the ratio of r to i for investment out of cash flow,
,
m D
q = the ratio of r to i for investment out of new debt, and
,
m E
q = the ratio of r to i for investment out of new equity.
We then have
Hypothesis 5: For companies with qm I, ≥1, it is also true that qm CF, ≥1, qm D, ≥1, and qm E, ≥1. Now consider a firm with the marginal returns on investment schedule mrrL. It maximizes shareholder wealth by investing IL and paying (CF−IL) in dividends. If its managers wish to grow faster than the rate implied by this investment, they of course invest more than IL. As I increases, mrr falls below i. If the firm were to invest all of its cash flow, its return on
investment would be k, which could also be regarded as the implicit cost of internal capital.
Should it wish to invest still more, it would have to enter the external capital market. Even if it only had to pay i for externally raised funds, these funds would cost considerably more than its
implicit cost of internal capital. Thus, for firms whose managers pursue growth, there is effectively a discontinuity in their cost of capital schedule at the point where they enter the external capital market, even if there are no transaction costs or information asymmetries to raise the cost of external capital above i. Thus, the prediction arises that growth-maximizing managers favor internal cash flows to finance their investments.
The prediction presumes, of course, that the firm must pay at least i when it enters the external capital market. When this is the case, we shall say that there exists strong capital market discipline. We state this definition as a hypothesis
Hypothesis 6: In countries with strong capital market discipline, for companies with qm I, <1, it is also true that qm CF, <1, but qm D, ≥1, and qm E, ≥1.
Our definition of a country with weak capital market discipline is simply one in which firms do not have to pay the full cost of externally raised capital. Soft loans are available from friendly banks, and some investors are willing to buy new debt and equity issues at prices that exceed the risk-adjusted present values of the interest and dividend streams that can be expected from the companies making these issues. Thus, we obtain
Hypothesis 7: In countries with weak capital market discipline, for companies with qm I, <1,
, 1
m CF
q < , and either qm D, <1, or qm E, <1, or both.
Since a bank loan or debt issue constitutes a more specific commitment and carries with it ostensibly greater penalties from breaking this commitment, we expect in general that
, ,
m D m E
q >q , whenever one or both are 1< . This leads to
Hypothesis 8: In countries with weak capital market discipline, for companies with qm I, <1,
, ,
m D m CF
q >q and qm D, >qm E, .
Thus, in countries with weak capital market discipline, we predict a hierarchy in the returns
on investment that differs from that usually assumed to hold for the costs of capital. The weakness of the implicit contract between managers and equity holders compared to the contractual relationship between debt holders and managers produces higher returns for investments out of new debt issues than for those made out of new equity issues and cash flows.
II. Methodology12
Let It be a firm's investment in period t, CFt+j the cash flow this investment generates in
t+ j, and it the firm's discount rate in t.
( )
1 1 t j t j j t C PV i ∞ + = = +∑
(1)We can then take the market’s estimate of PVt and the investment It that created it, and calculate a pseudo-permanent return rt on It t t t t mt t I r q PV I i = = (2)
If the firm had invested the same amount It in a project that produced a permanent return
rt, this project would have yielded the exact some present value as the one actually undertaken. The ratio of rt to it, which we call qmt, is the key statistic in our analysis. If a firm maximizes shareholder wealth, then it undertakes no investment for which qm t<1. That qmt is a marginal q
can be easily seen from (2) by contrasting it with Tobin’s q. Tobin’s q is the market value of the firm divided by its capital stock and is thus an average return. Marginal q is the change in the market value of a firm divided by the change in its capital stock (investment) that caused it. The market value of the firm at the end of period t can be defined as
1 1 t
t t t t t
M =M − +PV −δ M − +µ (3) where δt is the depreciation rate for the firm's total capital as evaluated by the capital market, and
t
µ is the market's error in evaluating Mt. The assumption of capital market efficiency implies that the error term in (3) has an expected value of zero, and thus that equation (3) can be used to estimate both δ and qmt under the assumption that δt and qmt are either constant across firms or over time, or both. Replacing PVt in (3) with qmIt, and rearranging yields
1 1 1 1 t t t t m t t t M M I q M M M µ δ − − − − − = − + + (4)
Equation (4) is favored over other possible rearrangements of (3), because it does not involve a lagged dependent variable, and in cross-section regressions is less likely to be subject to heteroscedasticity owing to the deflation of all error terms byMt−1
13
. Equations (3) and (4) incorporate the assumption that the market value of a firm at the end of year t−1 is the present
discounted value of the expected profit stream from the assets in place at t−1. Changes in market value are due to changes in assets in place as a result of investment and depreciation. The estimated qms are then essentially marginal Tobin's qs defined on all investments made in t.
The intuition behind (4) is straightforward. Abstracting from depreciation, when a firm invests $100 at a return equal to its cost of capital, its market value rises by $100. If its market value rises by more than $100, r>i. The depreciation factor, δt, measures the fall in the market value of the firm that would take place in year t, if it made no investments. It captures not only the decline in the value of a firm’s capital equipment due to wear and tear, technological obsolescence and the like, but also the decline in the value of the firm’s intangible R&D and advertising stocks due to imitation by competitor or the expiration of patents. Since the importance of technological change, R&D, advertising, and the like, varies across industries, we shall estimate separate depreciation rates for each industry. General differences in corporate environments, like the intensity of competition, degree of state regulation, etc., will affect a company's profits and thus its market value. These differences are not likely to vary from year to year, however, and thus should not affect changes in market values nor our estimates of δ .14
To estimate (4) we need data on the market value of each firm and its investments. A firm’s market value at the end of year Mt, is defined as the market value of its outstanding shares at the end of t plus the value of its outstanding debt. Since this number reflects the market's evaluation of the firm's total assets, we wish to use an equally comprehensive measure of investment. Accordingly we define investment as
&
I= After tax profits+Depreciation−Dividends+ ∆ + ∆ +D E R D+ADV. D
∆ and ∆E are funds raised using new debt and equity issues. SinceR&D and advertising expenditures (ADV) are also forms of investment that can produce “intangible capital” which contributes to a company’s market value, we add them to investment to obtain a measure of the firm's additions to its total capital.
II. The Data
The financial data are taken from the 1996-2001 versions of the Global Vantage and 1997 version of the Compustat databases of Standard & Poor's. These data sets contain accounting and stock price data on companies with listed stocks from virtually every country in the world starting in 1985. We exclude banks and financial companies and some service industries (SICs 6000 through 6999 and above 8100), because the nature of capital and investment in these industries is
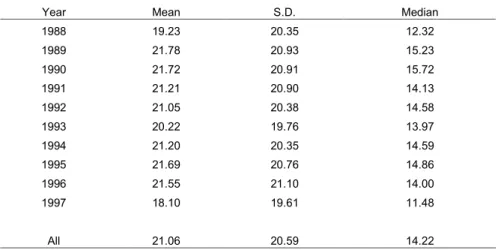
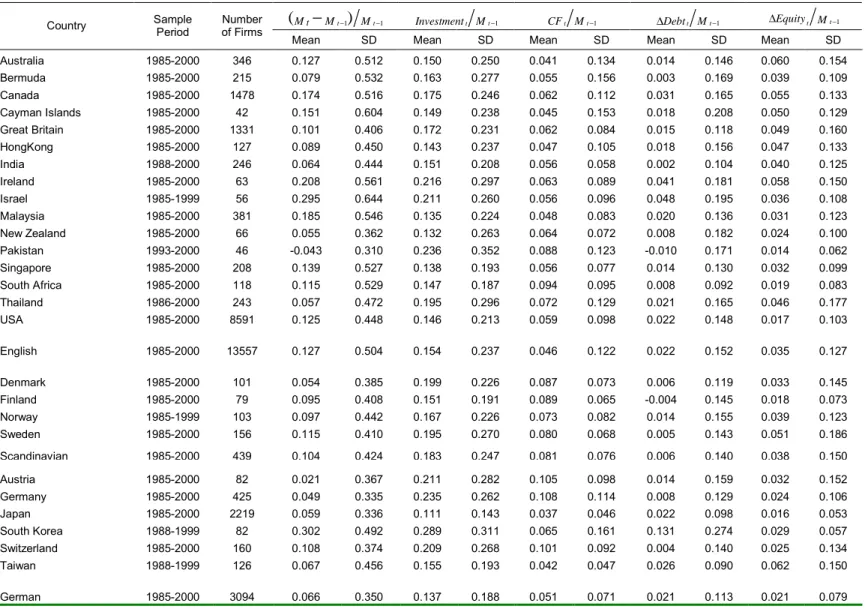
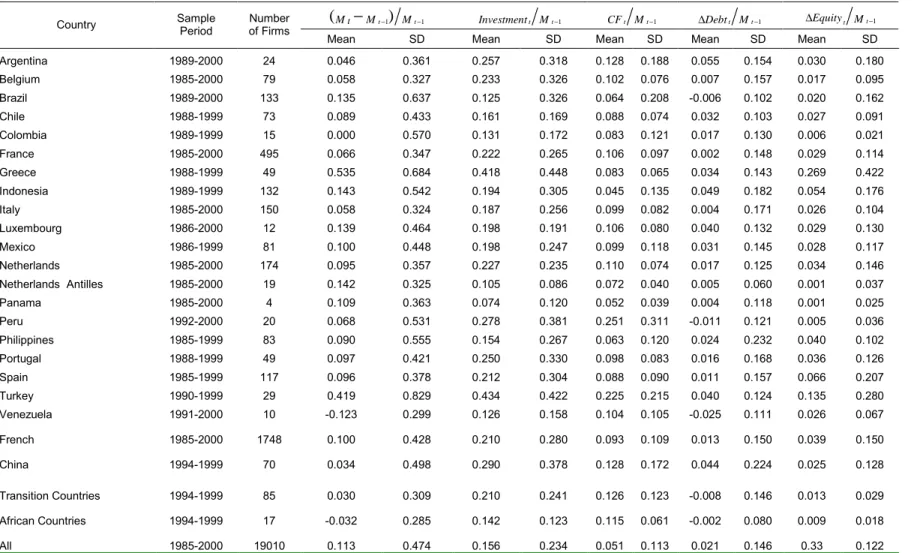
not comparable to those of non-financial firms. To minimize the weight of outliers, we cap our basic variables at both the 1st and 99th percentiles of each country sample. After this procedure we are left with 19,010 companies. In many countries and for many companies data were not available for all 16 years. Table 1 reports the number of firms, time period coverage and total number of observations for each of the 46 countries, which we group according to the LLSV classification, and for China, nine transition countries and five African countries. It also reports the means, standard deviations and medians of the main variables used in our analysis. Appendix A details the construction of the variables.
Our ownership data come mainly from three sources: AMADEUS database for the European companies, Compact Disclosure for the US, and the Asian (Japanese) Company Handbook for Asian companies (Japan). The remaining data sources on ownership structure are listed in Appendix B.
IV. Tests of Hypotheses Regarding Corporate Governance and Ownership Structures A. The Effects of Country Legal Systems
We first employ eq. 4 to test for significant differences in investment performance across countries that are related to the origins of their legal systems (Hypotheses 1 and 2). The intercept in eq. 4 is an estimate of the depreciation rate; the expected fall in a company's market value in any given year, if it makes no investments. Depreciation rates vary across companies depending on the kinds of capital they invest in. To allow for these differences, we assign each company to a two-digit SIC industry, and estimate a separate depreciation rate (intercept) for each industry.
Our model assumes that the stock market makes an unbiased estimate of the true value of a firm’s total assets at the end of t-1, and all changes in the firm’s market value during year t are therefore due to either its investment during this year or the depreciation in the value of its total assets. Stock markets are notoriously volatile, however,15 and it is thus possible that annual changes in company market values are affected by general shifts in market sentiment that change the market’s estimation of the value of assets in place. To correct for these swings in sentiment we use yearly deviations from country sample means for each variable in the regression.
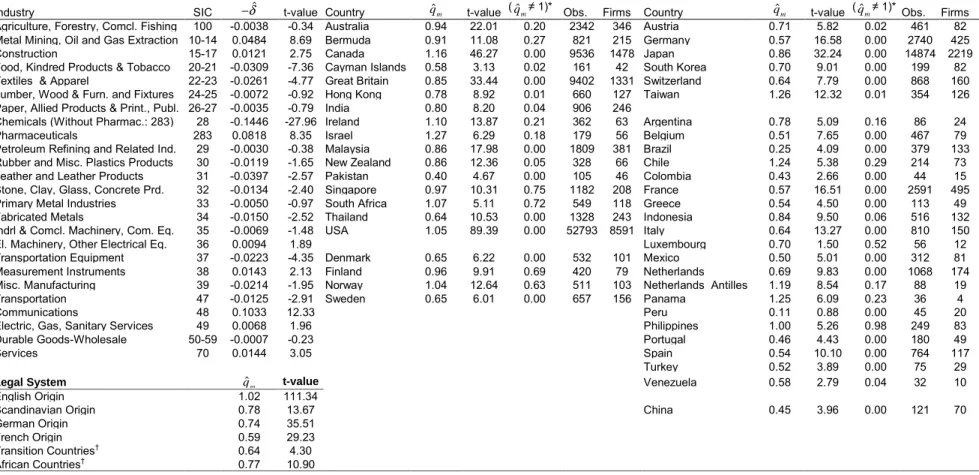
Table 2 presents the results from this estimation using all available data for each country for the period 1985 through 2000. In Panel A estimates of depreciation rates are presented for 24 industries, along with estimates of qm for six country groups. There are a total of 112,590 observations, and the model explains about 25 percent of the variations in company market
values. Turning first to the estimates of depreciation, we see that 16 of the 24 estimates have the predicted negative sign, and all but one of these falls in the plausible interval between zero and ten percent, the exception being the chemicals industry with pharmaceuticals removed (SIC 28), which had an estimated 15.5 percent depreciation rate per annum. Most of the negative depreciation rates (positive intercepts) are close to zero, but in the pharmaceuticals (SIC 283) and communications industries there appears to have been a sustained upward drift in prices over the last 15 years of the 20th century.
LLSV (1997) argue that countries with Anglo-Saxon legal systems have the strongest corporate governance systems followed in order by the Scandinavian, German and French origin countries. Countries with French origin legal systems are claimed to have the weakest corporate governance systems. Our estimates of returns on investment as a fraction of costs of capital, our
ˆm
q s, match this prediction. Countries with Anglo-Saxon legal systems have a ˆqmof 1.02, the highest value of any country group. The average firm in every other country group earned a return on investment significantly less than its cost of capital. Among the country groups classified by LLSV, the best performer was the Scandinavian group of countries with a ˆqm of 0.78, followed by the Germanic group (q ˆm = 0.74). Consistent with LLSV’s arguments, the average firm in a French-origin country had a return on investment of only 59 percent of its cost of capital.
We also report ˆqms for pooled groups of transition and African countries. The estimated returns on investment are 64 percent of company costs of capital for the transition countries. This low figure is consistent with the general impression that corporate governance structures in transition countries do not afford shareholders much protection against the managers of their firms, but also suggests that corporate governance structures in transition countries are no weaker and arguably marginally stronger than in French-origin countries.
Most students of development would also probably not expect that corporate governance structures are particularly strong in Africa. The ˆq m of 0.77 for the African countries, roughly the same as for the Scandinavian countries, is somewhat surprising, therefore. Since most of the African countries in our sample are former British colonies, this result might be interpreted as indicating that the remnants of British legal institutions left from colonization offer shareholders some protection even in an otherwise unfriendly environment for capitalist firms.
In Panel B of Table 2, we present separate estimates of q m for individual countries grouped once again according to the LLSV categorization. We omit the coefficients on the industry dummies in this and all subsequent sets of results to save space. Their magnitudes and
significance are always comparable to that reported in Panel A. Roughly the same picture emerges when we observe the ˆqms for the individual countries, as was seen for the entire groups. The countries with the strongest corporate governance systems– English-origin and the Scandinavian countries – have the lowest fractions of ˆq s m significantly less than 1.0 (8/16 and 2/ 4).16 In contrast five of the six ˆqm for the German-origin, and 14 of 20 for the French-origin countries are significantly less than 1.0.
The effects of the “Asian crisis” can also be seen, when the results in Panel B are compared to earlier estimates of qm by Mueller and Yurtoglu (2000). Using data up through 1996, they estimated ˆqms > 1.0 for Hong Kong, Malaysia, Thailand and Japan, while these countries all pick up ˆq s m < 1.0 in our data. A split between the three Asian countries in the German-origin group and the three European ones was observed in the Mueller/Yurtoglu study and can still be seen in our results, despite the Asian crisis. Taiwan’s ˆq is m significantly greater than 1.0, and Japan’s is much higher than either Switzerland’s or Germany’s ˆqm.
Other than this division within the German-origin group, we have not been able to discern any obvious geographic pattern to our estimates of investment performance besides that related to country legal systems. Many of the countries with low ˆq s m are in Europe, but the differences in
ˆm
q s in Panel B of Table 2 cannot be explained by a simple Europe/non-Europe dichotomy. Within Europe the only three countries with ˆq s m insignificantly different from 1.0 (Ireland, Norway and Finland) are in the two LLSV categories with the strongest corporate governance systems. Great Britain has the fourth highest ˆq m of the European countries. The nine lowest ˆq s m
for Europe belong to countries in the two lowest LLSV categories (Germany, Switzerland, Belgium, France, Greece, Italy, Portugal, Spain and Turkey).
Differences in investment opportunities may also explain why some of the ˆqms in countries with weak corporate governance systems (e.g., Chile and Taiwan) are both greater than 1.0 and much higher than for other countries in these groups. It is perhaps worth pointing out that differences in investment opportunities cannot explain estimates of q m that are significantly less
than 1.0 in members of the Anglo-Saxon group like Great Britain and New Zealand. If companies in these countries have poor investment opportunities, which is of course quite possible, this should lead to low levels of investment, if managers are maximizing shareholder wealth. Poor investment performance ( ˆqm<1) can only come about, if managers invest more than the amount that would maximize shareholder wealth.
At the bottom of Panel B we present the ˆqm for China. It is 0.45. Corporate governance institutions in Communist China do not appear to do a very good job aligning manager and shareholder interests.
B. The Effects of Ownership Structures
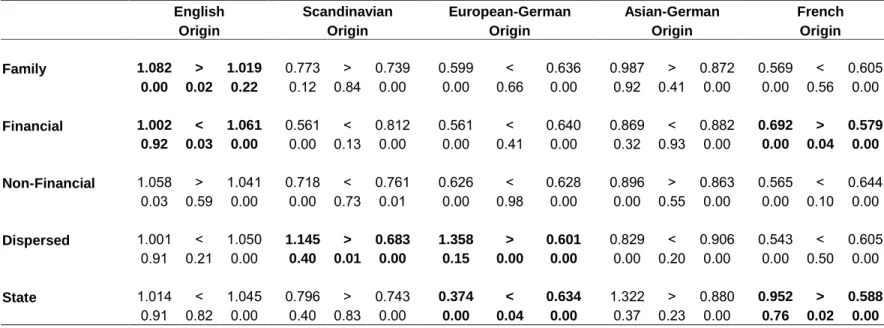
In Section I we put forward several hypotheses that related investment performance to the ownership structure of a firm. These hypotheses are tested by using eq. 4, and allowing q m to take on different values depending on both a company’s country of origin and its ownership structure. Whenever the largest shareholder owns 10% or more of a company’s equity, the company is categorized as owned by this person or institution. Given the differences observed in Table 2 between the ˆqms for the three European countries with Germanic-legal-systems and the three Asian countries in this group, we have divided the German-origin countries into European and Asian subgroups.
Table 3 presents our results from this exercise. Twenty-four separate depreciation rates were again estimated, but are not reported. Under each origin heading there are two entries. The first entry for each ownership category represents the point estimate of ˆqm for that category. Thus, family controlled firms in English-origin countries have a ˆqm of 1.082, which is significantly greater than 1.00 as indicated by the p-value of a two-tailed test below this coefficient. The second entry is the ˆqm for the remaining companies in that country group. Thus, the ˆq m for all English-origin companies that were not family controlled is 1.019. The > separating these two numbers indicates that the first entry is greater than the second, and the number below the inequality is the level of significance of this difference. Entries in boldface indicate differences significant at the 5 percent level, two-tailed test.
The first thing that stands out in Table 3 is that all qˆms > 1.0 for the English-origin countries, as opposed to only three for the remaining 40 entries in the table. The origin of a country’s legal system overwhelms differences in ownership structures in explaining returns on investment.
Hypothesis 3 predicts that companies with dispersed ownership should have lower qms than other companies in countries with strong corporate governance systems. The ˆqm for dispersed-ownership companies is less than for the remaining firms in the Anglo-Saxon countries, but the difference is not statistically significant. Thus, we cannot accept Hypothesis 3. We note again,
however, that q m is an estimate of a company’s average return on investment relative to its cost of capital, since the estimate is made using data on total investment in each year. Shareholder wealth maximization requires equating the marginal returns on investment to the cost of capital. Thus, the estimate of q m of 1.001 for dispersed-ownership firms in Anglo-Saxon countries likely implies a marginal return on investment somewhat under their costs of capital, suggesting some agency problems for these companies.
The significantly higher ˆq m for the companies controlled by individuals (families) might also be interpreted as indirect evidence of agency problems when ownership is dispersed. An alternative interpretation would be that family-controlled companies have trouble raising capital externally due to asymmetric information problems. This interpretation might also explain the significantly smaller ˆq m for companies controlled by financial institutions. These companies presumably do not have trouble raising external capital to finance worthy investment projects.
Hypothesis 4 predicts that companies with dispersed ownership have higher returns on investment than other firms in countries with weak corporate governance systems, since the owners were able to issue many shares in the first place by credibly committing themselves not to exploit small shareholders. This hypothesis finds support in both the Scandinavian and Germanic-European countries. In both cases the estimated qm is above 1.0 and significantly higher than for the other companies in these two country groups. Given that only one other entry in Table 3 for a non-English-origin country is greater than one, these results provide rather strong support for Hypothesis 4 in these countries. Companies with dispersed ownership in Scandinavia and Germanic-Europe are mostly large, multinational firms, and it would appear that they are subject to the same corporate governance constraints as companies in the Anglo-Saxon countries.17 In the three Asian countries with German-origin legal systems and the French-origin countries, no significant differences in the ˆqms for dispersed-ownership companies and the rest of the samples were observed, however.
Neither a priori reasoning nor the existing empirical evidence allowed us to make predictions about the relative performance of companies that are individually-controlled in countries with weak corporate governance systems, or are finance-controlled, or non-financial-controlled or state-non-financial-controlled. Consistent with these ambiguities, we generally find no significant difference between the ˆq m for companies in one of these ownership categories and that for all other firms in its country group. The only significant difference in investment performance for individually-controlled companies to be observed in Table 3 is for the English-origin countries as
predicted by Hypothesis 3.
The ˆq m for companies controlled by financial firms is significantly less than that for other firms in the English-origin group. This ˆq m is greater than one, nevertheless, and also greater than that for each of the other four country groups. It is thus not possible to say that financially-controlled firms in English-origin countries do badly in an absolute sense. The only other difference in ˆqms that is statistically significant occurs for the French-legal-system sample, where the point estimate of 0.692 is significantly greater than that of 0.579 for the rest of the sample. Although financial institutions appear to improve the investment performance of companies that they control in French-legal-system countries, they do not bring about a spectacular improvement. Companies controlled by financial firms are still predicted to have returns on investment that are less than 70 percent of their costs of capital. Their performance looks good only in comparison to other companies in the French-legal-system countries.
In none of the five country groups is there a significant difference between the ˆq m for firms controlled by other, non-financial companies and that of the rest of the sample. Managers of one company are not significantly better at monitoring managers of other companies than are other ownership groups.18As discussed above, this may be because the potential advantages managers have as monitors of other firms are dissipated through the construction of large pyramidal structures. Additional evidence on the performance of companies in corporate pyramids is presented in the following subsection.
The estimate of ˆq m for state-controlled companies in the three Germanic-European countries is 0.374, the smallest estimate in Table 3. Within these three countries, the agency problems associated with state-control of enterprises clearly seem to dominate. In three of the remaining four country groups the ˆq m for state-controlled companies is larger than for other firms, with the ˆqms for state-controlled companies in the three Asian countries with German-origin systems and the countries with French-German-origin systems being both insignificantly different from 1.0. In these two country groups, state firms actually exhibit the best investment performance of any ownership category. One explanation for this superior performance might be that state-controlled companies in these countries are located in industries with particularly attractive investment opportunities. Another possible explanation, of course, is that the state in these countries is an adept monitor of the firms that it controls.19
The results in Table 3 imply that ownership structures are less important determinants of investment performance than legal institutions. In the three Asian countries with German-origin
legal systems none of the ˆqms for any ownership category is significantly different from that for the remaining firms. In the four other country groups, only seven of the 20 ˆqms for particular ownership categories are significantly different from those for the remaining firms. The most consistent differences in ˆqms visible in Table 3 are across country legal systems rather than across ownership categories.
C. The Effects of Insider Ownership Concentration, Pyramiding, Cross-Shareholding and Voting Rights
In this subsection we present some additional tests of the effects of ownership structure for countries where we have a richer data set on ownership structures.
1. The Effects of Insider Ownership in the United States
As noted in section I, when ownership is concentrated in the hands of managers, it can have two, opposing effects on a company’s investment performance. As a manager’s ownership stake rises, the manager may identify more closely with other shareholders, and thus try to increase the market value of the firm. Alternatively, a larger ownership stake reduces the threat of dismissal thus freeing a manager to pursue goals that conflict with the other shareholders’ interests. Thus, a priori rising ownership concentration in the hands of insider managers has an ambiguous impact on firm performance.
We use data on the shareholdings of managers of U.S. corporations to test for the effects of inside ownership concentration on investment performance. We do this by interacting inside ownership variables with the investment term on the right-hand-side of eq. 4. The results are presented in Table 4. The number under qm is the coefficient on investment by itself, under IO is the coefficient on investment multiplied by the fraction of shares owned by insiders. IO2
represents an interaction term with the square of IO, IO3with its cube. The estimated coefficients imply a similar nonlinear relationship between qm and inside ownership concentration as Morck, Shleifer and Vishny (1988) (hereafter MSV) observed for Tobin’s q. The predicted q m rises from 0.95 as inside ownership increases from zero reaching a peak of 1.21 at a shareholding of 22 percent. From there q m falls reaching a low of 0.92 at a shareholding of 68 percent, from there on it rises again. Thus, the entrenchment of management due to their possessing concentrated shareholdings results in a significant deterioration in their companies’ investment performance over the range of ownership concentration levels from 22 to 68 percent. The turning points observed by MSV were at 5 and 25 percent.20 Our sample is much larger than theirs, and contains
many smaller companies, which partly explains whythe first turning point in our data comes at a much higher ownership concentration level. Managers of smallerfirms must hold larger fractions of their companies’ shares before they feel safe enough in their jobs to pursue policies that destroy their shareholders’ wealth. When we restrict our sample to Fortune 500 firms as MSV did, the turning points in our data come at concentration levels of 11.6% and 40.3%. A second possible explanation for the difference in turning points is that our data are from the late 1980s and 1990s, while MSV’s are from 1980. The late 1980s merger wave with its many, highly visible hostile takeovers may have raised the levels of share ownership that managers perceive to be necessary to protect them from hostile takeovers. Our data also imply that the level of ownership concentration at which managers’ and shareholders’ interests become realigned is much higher than that suggested by MSV.
2. The Effects of Pyramiding, Cross-Shareholding and Voting Rights in Europe
Corporate pyramids in which company A owns a controlling interest in company B, B owns a controlling interest in C, and so on, are quite common in Western Europe. As noted in section I, companies in the lower levels of a pyramid can be expected to exhibit poor performance for several reasons: (1) the managers/families at the top of the pyramid are empire builders, (2) the managers at the top of the pyramid transfer resources from lower level companies up to the top, or (3) the distance between the top and a given company in the pyramid becomes too great for the managers at the top to monitor this company effectively. These considerations lead us to predict poorer investment performance for companies at lower levels in corporate pyramids.
Corporate pyramids can lead to a diversion of a dominant owner’s interests and those of minority shareholders by allowing the dominant holder to lever the voting rights in her shares. When this occurs the dominant shareholder’s control rights exceed her cash flow rights, allowing her to exploit minority shareholders. We thus predict poorer investment performance for companies for which the dominant shareholder’s control and cash flow rights are unequal.
Cross-shareholdings in which company A owns shares in companies B and C, B owns shares in A and C, and so on, are also frequently observed in Western Europe. Such interlocking shareholdings can entrench the managers of all of the companies so joined, and thus free them to pursue their personal goals at the expense of outside shareholders.
To test these hypotheses three dummy variables were created: PYRM =1, if a company is two or more levels down in a corporate pyramid, 0 otherwise; VR=1, if the control and cash flow rights of the dominant shareholder are equal, 0 otherwise; and CROSS=1, if a company is part of
a group of firms with cross-shareholdings, 0 otherwise. We again interact these three variables with the investment term on the right-hand-side of eq. 4, and include them along with investment in the equation. The results from this exercise are given in Table 5. All coefficients on the three interaction terms are statistically significant and of the predicted signs. They also imply economically significant impacts on investment performance due to differences in corporate governance structures. A company for which the control and cash flow rights of the dominant shareholder are equal, and it is not part of either a corporate pyramid or a group of companies linked by cross-shareholdings is predicted to have a return on its investment that is 80 percent of its cost of capital (0.68 + 0.12). In contrast, a company for which control rights exceed cash flow rights and is lower down in the pyramid and is linked to other companies by cross-shareholdings is predicted to have a return on its investment that is only 34 percent of its cost of capital (0.68 – 0.09–0.25).
3.The Effects of Cross-Shareholding in Japan
Cross-shareholdings are also common in Japan, where members of the so-called keiretsu
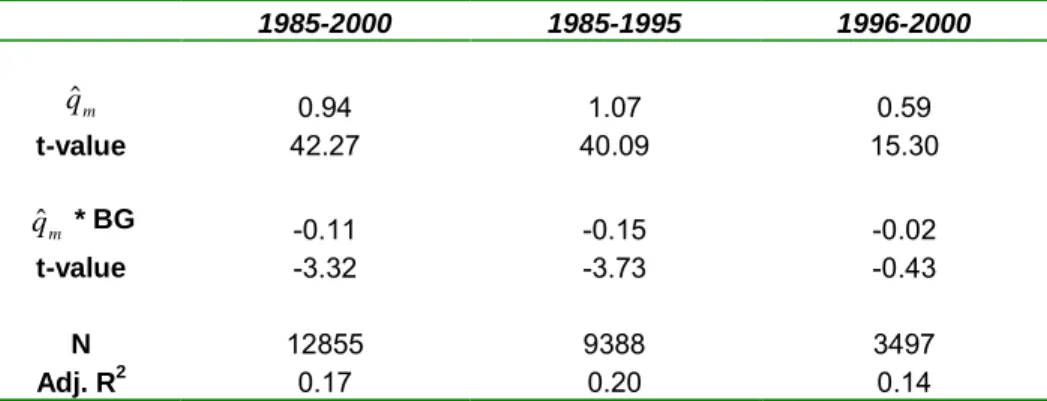
hold shares in each others’ companies. The same entrenchment of managers and negative effects on investment performance can be expected for members of these corporate groups. The first two entries in Table 6 report the ˆq m for independent firms (0.94) and the difference in ˆq m for group firms, both estimated over the entire sample period from 1985 through 2000. Members of corporate groups in Japan21 can be seen to have a predicted qm that is 0.11 lower than that for independent firms (significant at 1 percent level). The effect of cross-shareholdings in Japan is not as large as for European companies, but it goes in the same direction. Group firms in Japan have significantly lower returns on investment relative to their costs of capital than do independent companies.
As in most Asian countries, Japanese companies were hit hard by the “Asian crisis.” Our sample also expands dramatically over the last few years of the sample period through the addition of a large number of independent companies. To gage the effects of these events, we reestimated the equation for the periods 1985-95 and 1996-2000, roughly before and after the crisis. Over the first period, the group firms can still be seen to perform significantly worse than the independent companies. Following the advent of the crisis both the independent and group firms exhibit much poorer investment performance, and the difference between independent and group firms disappears. Our results imply, however, that when economic conditions are normal, cross-holdings of shares among companies in Japan have a similar effect on returns on investment to that observed in Europe, if less deleterious.
V. Tests of Hypotheses Regarding the Effects of Capital Market Constraints on the Returns on Investments from Different Sources of Finance
In this section we test for the effects of capital market constraints on the returns on investment from different sources of finance. We first conduct these tests using our country group categories as proxies for differences in external capital market constraints, and then examine the effects of some alternative measures of capital market discipline.
A. The Effects of Country Legal Systems
The differences in legal institutions that have been used to distinguish among corporate governance systems also have implications with respect to the returns on investment that one expects from different sources of finance. To the extent that strong corporate governance structures protect shareholders’ interests, we can expect the returns on investments out of cash flows and new equity issues to be positively related to the strength of a country’s corporate governance structure. This leads us to predict that the returns on investments out of cash flows and new equity issues correspond to those observed for total investment across the different country legal environments. Since the contractual protections associated with debt are more specific and easier to enforce, a weaker or nonexistent relationship between corporate governance systems and returns on investment out of new debt is expected. For the same reason, we also predict for companies with returns on total investment that are less than their costs of capital, that the returns on debt are the highest of the three sources of funds.
These predictions are tested using eq. 4 by estimating separate coefficients on investment for each source of finance. The results are presented in Panel A of Table 7. Consider first the first four country categories.22 The first row in each country group gives the estimates for the full sample of companies. The returns on investments out of cash flows follow the LLSV rankings of corporate governance systems except that the Scandinavian countries are ahead of the Anglo-Saxon countries. The lowest returns on reinvested cash flows occur for the French-legal-system countries as predicted.
Companies in the Anglo-Saxon countries obtain the highest returns on investments out of new equity issues. The second highest returns are not earned by companies in the Scandinavian countries, however, but in Germanic legal systems. The average returns on new equity issues in both the Scandinavian- and French-legal-system countries are significantly less than one. Consistent with the prediction that debt is a more binding commitment on managers than equity,
the returns on investments financed by new debt issues are seen to nearly equal their costs of capital across all legal systems.
One reason why the returns on reinvested cash flows and new equity issues reported in the first row of each country group do not correspond to differences in the strength of legal systems across the groups is that there may be important differences in investment opportunities across the groups. Companies that issue equity in some Germanic countries, like Japan and Taiwan, may have more attractive investment opportunities than companies in the Scandinavian countries. Accordingly the second and third sets of results in each group present estimates with the sample divided into companies for which ˆqm≥1, and for which ˆqm<1.23
Hypothesis 5 predicts that for companies with qm I, ≥1, qm CF, , qm D, and qm E, are also 1≥ . This hypothesis is supported in each of the four country groups. For companies with attractive investment opportunities, no conflict between managers and shareholders exists over investment policies, regardless of a country’s legal institutions. Indeed, the very high ˆqm estimated for some sources of funds for companies with qˆm I, ≥1, suggests that these companies are cash/equity constrained, and that their shareholders would benefit from even greater amounts of investment.
The same cannot be said for the companies with qˆm I, <1. All 12 ˆqms estimated on the different sources of funds are less than one for these companies. Thus, none of the four sets of legal institutions produces a strong external capital market as defined in Hypothesis 6 — qm D, and
, 1
m E
q > , even when q m and qm CF, <1. If we accept this interpretation of the results in Panel A, then all four sets of results support Hypothesis 7 — (qm<1) ⇒ (qm CF, <1,qm D, <1,qm E, <1), in the presence of weak external capital markets.
Hypothesis 8 asserts that (qm<1)⇒(qm D, >qm CF, and qm D, >qm E, ) when external capital markets are weak. This hypothesis is fully supported in all four country groups. In the Anglo-Saxon and Germanic countries reinvested cash flows earn the lowest returns, while in the Scandinavian and French-origin countries it is new equity issues that have the lowest returns. The bottom three entries in Panel A of Table 7 present separate estimates of qm for the three sources of investment funds for our samples of transition and African countries and China. The weakness of the corporate governance systems in each category is again revealed by the very low returns on investments made out of cash flows. Somewhat surprisingly perhaps, qˆm D, ≥1 at the 5 percent level, in all three cases, and qˆm E, ≥1 for both the transition and African countries. We suspect that
this finding is not due to the fact that these countries have strong domestic external capital markets, but rather that companies in transition and African countries that raise external capital do so abroad or from foreign investors trading in their countries, and thus are effectively subjected to stronger capital market discipline than one might expect. Capital market institutions in China, on the other hand, do not appear to offer much protection to purchasers of new equity issues. Our samples are so small and contain so few companies for which qm≥1, that we have not undertaken any further analysis of these three country groups.
B. The Effects of Accounting Standards
The results presented in Panel A of Table 7 imply that none of the four major categories of different legal institutions generates sufficiently strong external capital markets to force even companies with poor overall investment performance to earn returns on new debt and equity issues equal to their costs of capital. In this and the following subsection we thus present further tests of our hypotheses relating to external capital market discipline using two alternative measures of the strength of this discipline.
Shareholders should be able to protect themselves better against self-serving managers and to make better decisions regarding the purchase of new equity issues, the better the quality of accounting information at their disposal. The Center for International Financial Analysis and Research (Bavishi, 1993) has examined the accounting practices in a large sample of countries and ranked them according to the number of desirable pieces of information each country’s standards require to be published. The scale of this index for the countries in our study runs from a low of 36 for Portugal to a high of 83 for Sweden with a median of 64. We have classified any country with a score of 64 or more as having a strong set of accounting standards, with a score of 63 or less as having weak accounting standards.24Our expectation is that returns on cash flows and new equity are relatively higher in countries with strong accounting standards. It is possible, of course, that an improvement in equity’s performance comes to some extent at the expense of debt holders, and not simply from a reduction of managerial discretion and an improvement in investment performance. We shall also be interested, therefore, in seeing whether strong accounting systems are associated with lower returns on investment financed through new debt issues.
Our estimates of the returns on investments out of the three sources of funds for the two categories of accounting standards are presented in Panel B of Table 7. The number under the coefficient estimates for the weak-accounting-standards countries is the p-value of a test against
one. The number under the coefficient estimates for the strong accounting standards countries is the p-value of a test that the sum of the coefficients of weak and strong accounting standard countries is equal to one, whereas a * indicates that the coefficient estimate is significantly different from zero at the 1% level.
The results for all four country groups are in line with our expectations. Eleven of the twelve qˆm CF, s for countries with strong accounting standards are larger than the qˆm CF, s for countries with weak standards, five of them significantly so. Eleven of the twelve qˆm E, s for countries with strong accounting standards are larger than the qˆm E, s for countries with weak standards, five significantly so. Thus, the existence of strong accounting standards appears to strengthen the hand of shareholders resulting in higher returns on both reinvested cash flows and new equity issues, and this holds more or less regardless of a country’s legal origin.25There is also a suggestion that the improvement in performance for equity holders comes to a degree at the expense of debt holders. Nine of the twelve qˆm D, s for countries with strong accounting standards are smaller than the qˆm D, s for countries with weak standards, one of these differences is significant at the five percent level, two others at the 10 percent level.
We conclude that the existence of strong accounting standards does improve the investment performance of companies as far as shareholders are concerned. At the same time it must be noted that strong accounting standards alone do not suffice to produce a strong external capital market for equity, as defined in Hypothesis 6. When qm I, <1, qm E, <1 in all four country groups, even for countries with strong accounting standards.
C. The Effects of Creditors’ Rights
Countries' legal institutions differ both with respect to the protections that they offer to equity holders, and the protections that they afford debt holders. In the previous subsection, we examined the impact of one legal institution that particularly impacts equity holders, in this subsection we examine the effects of legal protections for debt holders.
LLSV (1998) have examined the rights of creditors in different countries and ranked them on a scale of one to four, with four representing the strongest rights. Using this index we have classified any country with a score of 3 or 4 as having strong creditor rights, with a score of 1 or 2 as having weak creditor rights.26 We anticipate superior performance on investments made out of