W I R T S C H A F T S W I S S E N S C H A F T L I C H E S Z E N T R U M ( W W Z ) D E R U N I V E R S I T Ä T B A S E L
July 2007
Limited Self-Control, Obesity and
the Loss of Happiness
The Author(s):
Prof. Dr. Alois Stutzer
Department of Economics (WWZ), University of Basel Petersgraben 51 CH - 4051 Basel alois.stutzer@unibas.ch
A publication oft the Center of Business and Economics (WWZ), University of Basel.
© WWZ Forum 2007 and the author(s). Reproduction for other purposes than the personal use needs the permission of the author(s).
Contact:
L
IMITED
S
ELF
-C
ONTROL
, O
BESITY AND THE
L
OSS OF
H
APPINESS
Alois Stutzer∗
University of Basel July 6, 2007
Abstract: Obesity has become a major health issue. Research in economics has provided important insights as to how technological progress reduced the relative price of food and contributed to the increase in obesity. However, the increased availability of food might well have overstrained will power and led to suboptimal consumption decisions relative to people’s own standards. We propose the economics of happiness as an approach to study the phenomenon. Based on proxy measures for experienced utility, it is possible to directly address whether certain observed behavior is suboptimal and therefore reduces a person’s well-being. It is found that obesity decreases the well-being of individuals who report limited self-control, but not otherwise.
JEL classifications: D12, D91, I12, I31
Keywords: obesity, revealed preference, self-control problem, subjective well-being
∗ Address: Department of Business and Economics, University of Basel, Petersgraben 51,
CH-4003 Basel, Switzerland. Phone: 0041-(0)61 267 33 61, fax: 0041-(0)61 267 33 40, email: alois.stutzer@unibas.ch.
I am grateful for helpful comments from Christine Benesch, Bruno Frey, Alexander Grob, Simon Lüchinger, Stephan Meier, Susanne Neckermann, Andrew Oswald, Jürg Sommer, Wolfgang Stroebe and participants of the conference on “New Directions in the Study of Happiness” at the University of Notre Dame. The data source for this study is the Bundesamt für Statistik: Schweizerische Gesundheitsbefragung 2002.
I.
Introduction
An outside observer would probably make two comments about food in rich industrialized countries: First, an abundance of food is available, and second, food and drink are within close reach most of the time. What does it mean for people’s well-being that there is access to a large selection of food and drink at home, in the car, at the gas station, in the post office, at the entrance and exit of toy shops, etc.? There are two possible views. On the one hand, the new situation can be seen as a benefit of economic progress and organizational innovations, allowing people to satisfy their food preferences at lower (transaction) costs than in the past. On the other hand, the omnipresent possibilities for immediately gratifying appetites and desires can be seen as a hindrance to pursuing long-term plans about a healthy diet.
There is an obvious link to obesity and related health problems.1 The question is whether
weight gain and any health consequences are the result of an optimally chosen lifestyle, whereby the health insurances and taxpayers finance a large amount of the monetary costs of obesity, or whether people consume too much according to their own standards.
The identification of causes, and specifically the role of bounded rationality in the obesity phenomenon, poses a major challenge to social science research and, in particular, to economics. In the revealed preference approach of standard micro-economic analysis, consumer choice is considered to be the result of rational utility maximization. Individuals are assumed to be perfectly informed about what brings how much utility, and to be perfectly capable of maximizing it. Right from the beginning, these assumptions exclude any systematic mistakes in consumption choice due, for example, to limited self-control.
In this paper, (i) the possibility of systematic errors in consumption is taken seriously and (ii) an empirical strategy is proposed to directly study the utility consequences of consumption decisions. This is made possible by a recent development in economics: data on reported subjective well-being is analyzed to approximate individual utility (see, e.g., Kahneman et al. 1999; Frey and Stutzer 2002a,b; 2005). People’s behavior is assessed depending on their ex post evaluation of experienced utility. In principle, discrimination can then be made between competing theories that share the same predictions concerning individual behavior, but differ
1 An immense recent literature deals with obesity as a societal phenomenon rather than purely a health
in what they put forward as individual utility levels (for applications, see Gruber and Mullainathan 2005; Benesch et al. 2006).
Here, the relationship between people’s body mass index and their reported subjective well-being is studied. It is hypothesized that the well-well-being of people with limited self-control is reduced when they are obese, while the well-being of people with strong will power is not affected. The empirical analysis is based on a unique data set combining information on people’s weight, height, perceived control over their life and eating behavior, as well as a multi-item measure of subjective well-being. It is found that people who report a lack of will power as an obstacle to a healthy diet (i) are more likely to be obese and (ii) have reduced subjective well-being when they are obese, ceteris paribus. These results are complemented by an analysis of the covariates and determinants of obesity, taking into account socio-demographic factors, as well as ignorance about health, and a wide range of obstacles to a healthy diet.
In the next section, the obesity phenomenon and its causes and consequences are briefly introduced, focusing on the issue of limited self-control. Section III presents strategies for testing and identifying limited self-control in observed body mass. The emphasis is on ex post evaluations based on experienced utility. The empirical analysis is brought in Section IV. Section V offers concluding remarks.
II.
The Economics of Obesity and Self-Control
Obesity is on the rise in many Western countries and, with it, illnesses such as diabetes and heart disease. Observers call it an “obesity pandemic”, comparable to big threats such as global warming and bird flu, or talk of it as the epidemiological landslide of the last two decades.2 Overweight and obesity is defined relative to people’s weight to height ratio in
metric units, as captured in the body mass index (BMI): BMI=kg/m2. Adults with a BMI≥30 kg/m2 are classified as obese and those with a BMI≥25 kg/m2 as overweight. In many European countries, the prevalence of obesity has risen three-fold or more since the 1980s (Sanz-de-Galdeano 2005; WHO Europe 2005). In Europe, adults today have an average BMI of almost 26.5. Worldwide, the percentage of obese adults varies greatly: around 3 percent in South Korea and Japan, 8 percent in Switzerland, over 22 percent in the United Kingdom, and
2 See, e.g., the reporting of the Associated Press from the International Congress on Obesity in Sydney
more than 30 percent in the United States (see figure 1). In the United States, adult obesity rates have more than doubled since the 1980s. In the year 2000, three in ten adults were classified as obese (Flegal et al. 2002).
[Figure 1 about here]
Overweight accounts for 10-13 percent of deaths and 8-15 percent of healthy days lost due to disability and premature mortality (DALY) in the European Region (World Health Organization 2002).
A debate has started about the economic causes of this phenomenon, as well as its consequences (see, e.g., Cutler et al. 2003; Finkelstein et al. 2005; Rashad 2006). Increased obesity has been explained as the relationship between energy expenditure and energy intake. Energy expenditure is lower nowadays because manual labor has been replaced by more sedentary work due to technological changes (Lakdawalla and Philipson 2002). However, this trend started long before the obesity endemic took off. The increase in calories consumed fit the obesity pattern better and is of sufficient magnitude to account for its increased prevalence (Putnum and Allshouse 1999). In particular, higher snack calories are responsible for higher energy intake for men, and for even higher energy intake for women (Cutler et al. 2003). What is the economic rationale behind the shifting energy household? Looking at relative prices suggests that, since the early 1980s, there has been a decrease in price for calorie-dense foods and drinks compared to fruit and vegetables, which are less energy-dense (Finkelstein et al. 2005). These price reductions were made possible by new technologies in food production, in particular for prepackaged and/or prepared food. People have reacted by eating more frequently (snacking), eating bigger portions and spending less time on preparing meals. The question arises how these increases in body weight, causing considerable harm to people’s health, are to be evaluated. Do people eat too much? What is the standard for “too much” if people can choose when and how much they want to eat? Traditional economics advises us to resort to consumer sovereignty under such conditions. “Even with full information about the benefits of physical activity, the nutrient content of food, and the health consequences of obesity, some fraction of the population will optimally choose to engage in a lifestyle that leads to weight gain because the costs (in terms of time, money, and opportunity costs) of not doing so are just too high” (Finkelstein et al. 2005, 252). This might apply even more because health insurances and taxpayers finance a large amount of the monetary costs of obesity. Moreover, obesity can be rationalized, assuming a high discount rate for future
outcomes. The argument for variation in individual discount rates as an explanation for increased obesity is put forward, e.g., by Komlos et al. (2004).3
However, the possibility of individuals consuming “too much” food is excluded by assumption in the revealed preference approach. Yet, in order to justify this view, one would have to reconcile the prevalence of obesity with other behavioral regularities, like people spending large sums of money on diets and health clubs, or people’s weight yo-yoing as they go from one diet to the next.4
An alternative approach accepts that people might face self-control problems when exposed to the temptation of immediate gratification from food when they are hungry or have a craving for something sweet, fatty or salty (see, e.g., Offer 2001). There is a rich literature on the control of eating, emphasizing physiological mechanisms (Blundell and Gillett 2001; Smith 2006). In particular, humans are endowed with a system of weight regulation that favors weight gain over weight loss to reduce any future risk of starvation. While this ability was evolutionary advantageous, it is a challenge to conscious control of food intake today. People consume more food and calories and eat more frequently than what they consider good for themselves when they think about and plan their diet. People are aware of this phenomenon, but more so in others than themselves (Taylor et al. 2006). They judge their own and other people’s consumption behavior as irrational in the sense that they think that they would be better off if they would consume less and care more about their future well-being. Such self-control problems involve two aspects: myopia and procrastination. In both cases, the present is emphasized at the expense of long-term. When affected by myopia, people focus on consuming in the present and lack discernment or long-range perspective in their thinking and planning, thus undermining their well-being over time. In this respect, goods offering instantaneous benefits at negligible immediate marginal costs are generally tempting. Procrastination focuses on putting off or delaying an onerous activity (like exercising) more than a person would have liked when evaluating the activity beforehand. In economics, this inconsistent time preference is most prominently formulated in models of hyperbolic
3 In an empirical analysis for the Netherlands, Borghans and Golsteyn (2006) conclude, however, that
it is unlikely that BMI increased because of an increase in the time discount rate.
4 This argumentation on the revealed preference approach does not exclude that observed behavior can
give clear indications of a problem with the control of body mass, e.g., when people inflict costs on themselves in order to make eating chocolate less attractive. However, the revealed preference approach gives no reason to search for such contradictory patterns in consumption behavior. On the contrary, it urges the researcher to look for rationalizations.
discounting (see, e.g., Laibson 1997). A low discount factor (i.e. a discount factor decreased by β, β∈ (0,1)) is applied between the present time and some point of time in the near future, and a constant discount factor δ thereafter. An excellent account of the recent extensive empirical and theoretical literature on time inconsistent preferences is provided in Frederick et al. (2002).
With regard to obesity, the self-control issue is explicitly addressed in Cutler et al. (2003), whereby its relevance in the assessment of consumers’ welfare is discounted because it would require only some exercise on the part of overweight people to balance their energy household. Observed inactivity thus seems to indicate that overweight people do not suffer from their body mass. However, the trade-off is calculated, assuming that people have self-control problems with eating, but not with taking physical exercise. This asymmetry does not fit our casual observations.
When thinking about policy proposals, it is important to know whether and to what extent people face a self-control problem when tempted by the abundance of food. Is obesity rational and reflecting an appetite for food so that it can be reduced to an issue of externalities in a publicly regulated and funded health system? Or does it reflect ignorance and a lack of imagination of its consequences, requiring some sort of information policy? Or must obesity be treated like smoking, where some people lack will power to control their behavior? The challenge for research is to disentangle the various behavioral reasons for obesity.
III. Testing Strategy and Previous Evidence
Based on observed behavior, it is difficult to discriminate between the view of consumers as rational actors and consumers facing self-control problems. Independent of whether people have a strong preference for fatty food, are ignorant of or unable to imagine the health consequences, or simply lack will power, a higher likelihood of overweight and obesity is predicted in today’s environment of food affluence.
We see three approaches that shed light on the possible behavioral forces behind the obesity phenomenon. The first two approaches look for patterns of behavior that cannot easily be reconciled with standard utility maximization. The third approach is based on the idea of separating the consumption decision from the utility thereby produced. This creates the necessary degree of freedom so that revealed behavior can systematically diverge from utility maximization.
A. Previous approaches to identify problems of self-control
Prediction of behavior with indicators of limited self-control. This approach starts out with a
standard model of individual behavior. It is studied whether the explanatory power of the (empirical) model is increased when the variation in people’s level of self-control is taken into account. Empirically, limited self-control is captured (i) by using behavioral markers, like not having a bank account or having had many hangovers from alcohol consumption in the recent past (see, e.g., DellaVigna and Paserman 2005), (ii) by letting people in experiments choose between immediate payoffs and higher delayed payoffs (Thaler 1981), or (iii) by measures of self-report. There is a rich literature in psychology on developing and applying survey measures of self-control (e.g. Tangney et al. 2004) or related psychological measures like conscientiousness (for an application in economics, see Ameriks et al. 2007) and mastery. “Conscientiousness describes socially prescribed impulse control that facilitates task- and goal-directed behaviors, such as thinking before acting, delaying gratification, following norms and rules, and planning, organizing, and prioritizing tasks” (John and Srivastava 1999, p. 121). “Mastery refers to the extent to which people see themselves as being in control of the forces that importantly affect their lives” (Pearlin et al. 1981, p. 340). In addition, there are more specific survey measures relying on scenarios (Ameriks et al. 2007) or direct reporting of self-control problems in some specific aspect of consumption. In our empirical analysis, measures of reported mastery and domain specific reported will power are applied.
Self-infliction of costs. A problem of self-control is diagnosed if people are observed spending
a lot of time or money on changing their behavior. In the context of obesity, this ‘smoking gun’ approach looks for evidence like, e.g., spending a lot of money on staying at a clinic where mainly sugarless tea is served. More generally, self-binding mechanisms are voluntarily chosen to reduce the utility of some activity or to make short-term revisions of consumption plans less attractive.
B. Proposal for a testing strategy based on experienced utility
Ex post evaluation in terms of experienced utility. The third approach proposes two
extensions to the traditional emphasis on ex ante evaluation and observed decision. The first extension involves the standard economic concept of decision utility, which is complemented by the concept of experienced utility (Kahneman et al. 1997). The latter concept refers to an individual’s evaluation of actual experiences in terms of positive and negative affects or satisfaction. Separating the concepts makes it possible that the ordering of experiences
systematically diverges from the ordering of options derived from observed behavior. The second extension is closely related to the first, and emphasizes ex post evaluations as a valuable source of information about the possibility of bounded rationality in people’s decision-making. How do people fare after they have made decisions? Or, is some consumption pattern related to higher or lower subjective well-being, ceteris paribus? This approach is promising as it puts forward a proxy for individual welfare to evaluate choice behavior. However, the approach is subject to the same econometric difficulties faced by studies that examine the determinants of behavior, i.e. the possibility of omitted variable bias and endogeneity bias.
Two recent studies develop and apply strategies to deal with the issue of endogeneity. In a test for self-control problems with smoking, Gruber and Mullainathan (2005) study the effect of an increase in tobacco taxes on the reported happiness of people who are predicted to be smokers. Contrary to the standard prediction, they find that these people are better off as a result. Benesch et al. (2006) study the reaction to a difference in the opportunity set rather than a price change. It is tested whether the life satisfaction of heavy TV viewers is increased or reduced if they can choose from a large number of TV channels rather than a small number of channels. The standard economic prediction would be that a larger opportunity set does not make people worse off. With a self-control problem, more choice can make time inconsistent behavior worse. In fact, the empirical findings support the hypothesis that limited self-control is partly responsible for the large amount of time devoted to TV viewing.
Reported will power, behavioral patterns and experienced utility. In this paper, another
variant of the identification strategy, based on experienced utility, is applied. It is studied whether the ex post evaluation of some behavior systematically varies between groups of people who have differing amounts of will power. For the phenomenon of obesity, it is hypothesized that obesity makes people worse off in terms of experienced utility if the increased body mass is due to a self-control problem. However, if people are not lacking will power, a BMI above 30 does not enter negatively into the evaluation of people’s subjective well-being. Any correlation between the level of will power and subjective well-being as such is statistically captured in the constant term.
Four comments serve to clarify the underlying assumptions, strengths and weaknesses of the approach:
1. It is no problem for the approach if – in terms of the current application – fat people are jollier. The approach does not rely on a specific benchmark correlation between the phenomenon under study and subjective well-being. A strong preference for food (and thus a higher BMI) can be positively or negatively correlated with reported well-being. It is predicted that obese people judge their overall well-being less favorably than people of normal weight when they indicate limited will power rather than when they do not.
2. The approach explicitly tests for effects on individual welfare. It is important to repeat this seemingly obvious aspect, because the individual is free to judge how to evaluate a certain life-path. In the language of multiple selves, the question is which self counts more – the self at that moment, or the Puritan self with a detached long-term view. In a sense, the approach can also be seen as a validity check of the applied indicator of limited will power acting as an obstacle to pursuing individual welfare.
3. The testing strategy formulated above relies on two qualities of the self-control problem under study. First, individuals are aware of their limited will power (as self-reports are used). Second, self-control behavior is generalized across different consumption decisions. This means that limited will power affects behavior across-the-board.
Depending on the application, this latter assumption might be questionable. In our case, it means that a high BMI need not be positively correlated with the exertion of will power in other areas. There is, however, the possible scenario that people prefer to be weak-willed and fat rather than to be weak-willed and a chain smoker. Weak-willed people who are obese would then not necessarily judge their well-being less favorably than those who are not obese, and the testing strategy fails to identify limited will power reducing individual welfare.
The assumption that self-control behavior generalizes across activities, however, can be relaxed in the concrete application. Consumption activities that are close substitutes for people with limited will power can be simultaneously taken into account in the empirical analysis. We include smoking when studying the robustness of our results (see sub-Section IV.C).
4. As the approach is not based on an experimental design offering causal effects, issues of omitted variable bias and reversed causality need special attention. In our analysis, we control for a wide range of individual characteristics. Moreover, in the robustness
analysis, we address issues of causality. In particular, we take into account whether people turn to eating when they feel depressed.
In sum, the proposed strategy combines the idea of exploiting supplementary information on the variation in a person’s level of will power and the idea of an ex post evaluation based on experienced utility. This is seen as the main conceptual point of the paper. In the concrete empirical application presented in Section III, ‘old’ and ‘new’ approaches to study self-control problems are applied in a complementary way.
C. Previous evidence on obesity and subjective well-being
Reported subjective well-being provides information about people’s evaluation of their situation after they have decided about their food and beverage consumption. Two predictions summarize the conflicting views on the role of limited will power in obesity. If technical “progress” in producing fatty food is indeed a major driving force behind obesity, the standard economic model predicts that individuals will become heavier and happier. However, if individuals have self-control problems, we would expect them to become heavier and less happy.
There is a growing literature on empirical research, studying whether obese people are less satisfied. According to an empirical investigation for roughly 8,000 young women, obesity is related to lower satisfaction with work, family relationships, partner relationship and social activities (but not satisfaction with friendships) (Ball et al. 2004). Other studies report correlations between obesity and symptoms of depression, whereby the risk of depression is higher for obese women than obese men (e.g. McElroy et al. 2004; Needham and Crosnoe 2005). These findings, however, provide only limited insights, as the correlations can be due to third variables affecting both eating behavior and subjective well-being, or because low life satisfaction and stress can lead to obesity. The latter has been studied in a longitudinal analysis for 5,867 pairs of twins (Korkeila et al. 1998). It is found that a high level of stress, as well as a low level of life satisfaction, are both predictors of weight gain over six years and for certain groups of people over 15 years of age. Another panel study addresses the reverse relationship. Taking baseline mental health into account, it analyzes the long term consequences of obesity, finding an increased risk for depression (Roberts et al. 2002). These results are valuable to assess the relevance of the phenomenon, but they have to be supplemented with further evidence to identify the contribution of self-control problems to the link between obesity and subjective well-being.
Alternatively, it is possible to characterize conditions where attempts to recapture self-control are encouraged. It is to be expected that those people who stand to lose a lot from being obese, or who have access to resources, are more successful in controlling their behavior. For example, obese women seem to suffer a salary and promotion penalty even more than obese men (see, e.g., Baum and Ford 2004, Finkelstein et al. 2005). They have strong incentives to control their body weight and might suffer more when their lack of will power leads to failure. Consistent with this point of view, people in the top income quintile, or in professions with a low prevalence of obesity, report the largest well-being costs of obesity (Felton and Graham 2005). People with a higher education or income level are more likely to view themselves as overweight, keeping the level of the BMI constant (Oswald and Powdthavee 2007).
IV.Empirical Analysis
A. Data
The empirical analysis is based on data from the Swiss Health Survey 2002 compiled by the Swiss Federal Statistical Office. The specific data set for Switzerland is chosen for two reasons. First, it offers the unique combination of information about people’s body mass, subjective well-being and self-control. Second, it includes a representative sample of a Western country experiencing increased availability of food. However, there is the drawback that Switzerland is not representative with regard to the prevalence of obesity (see figure 1). As there is a lower fraction of obese people in Switzerland than in most other Western countries, the emphasis will be on the quality of results rather than on the quantification of effects.
The Swiss Health Survey combines responses from a telephone survey and a questionnaire mailing going to the same people. The sampling population was the resident population aged 15 and over. 19,706 individuals were interviewed and 16,141 of them responded to a supplementary written questionnaire. For 19,471, respondents there is complete information about their body mass. Figure 2 shows the weighted distribution of the BMI index, differentiating between four categories: underweight, normal weight, overweight and obese. The percentage of obese people in the adult population amounted to 7.7% in 2002, an increase of 2.3 percentage points since 1992. 29.4% are overweight and 49.9% normal weight. There is also a substantial fraction of 13.0% having a BMI below 20 and thus beingunderweight.
[Figure 2 about here]
People’s subjective well-being is assessed using eight questions from the Bern Questionnaire of Subjective Well-Being (Grob et al. 1991). The questions are reported in the appendix. The main analysis is for the compound measure based on the eight items. In addition, responses to the statement “I enjoy my life” are evaluated separately. The latter item gets closest to the single item questions usually studied in economics and happiness.
Variation in self-control between people is assessed using a general measure of reported mastery and a specific measure of reported will power in pursuing a healthy diet. The mastery scale is from Pearlin et al. (1981), whereby 4 out of 7 questions were included in the survey (see appendix). In our sample, 24.1% of the subjects report that they feel in control of their life, i.e. all questions of limited mastery are completely denied. Domain specific will power is derived from the following survey item: “Many people – maybe you too – attach importance to a healthy diet. Do you see obstacles for somebody who pursues a healthy diet? Please tick all reasons that apply! … ‘lack of will power, lack of belief in success’.” Limited will power with regard to a healthy diet is reported by 25.5% of people in the sample. The full list of possible obstacles to a healthy diet will be taken into account in the empirical analysis. They are also reported in the appendix.
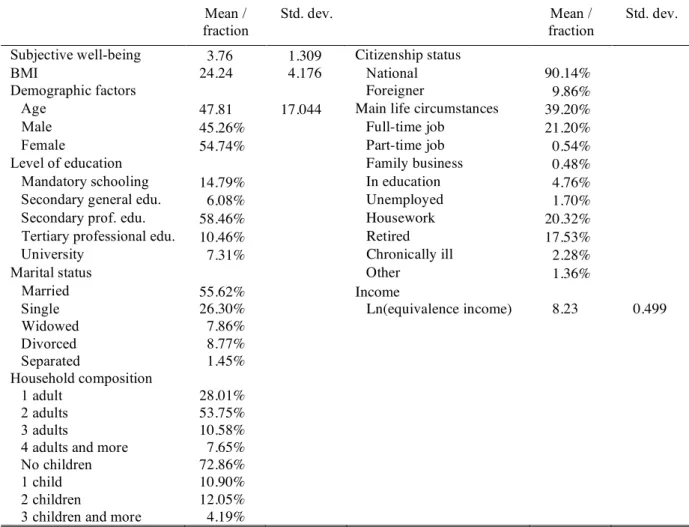
The Swiss Health Survey includes information about a wide range of other individual characteristics. They are taken into account in the empirical analysis. Descriptive statistics are presented in Table A.1 in the appendix.
B. Results
Two sets of results are presented. First, the covariates of body mass are studied. The baseline estimation includes standard demographic and socio-economic factors. Then the empirical model is extended to include indicators of ignorance and limited will power. Next, people’s body mass is compared to their subjective well-being. We test whether there are differential effects for people with full and limited will power as hypothesized above.
Limited will power and obesity
According to standard categorization, people’s body mass falls in one of four categories; underweight, normal weight, overweight and obesity. Even though these categories follow the metric of the BMI, they are not inherently ordered. Underweight and obesity are related but separate phenomena, i.e. obesity is not just more underweight and underweight is not just less
obesity. Therefore, in order to empirically study the covariates of low and high BMI, a multinomial regression approach is applied. Table 1 shows relative risk ratios from a multinomial logit regression, whereby the base outcome is normal weight. Relative risk ratios compare the probability of some outcome in two categories in the case of dummy variables, or the change in the probability of some outcome for an increase of the independent variable by one unit in the case of continuous variables. If the relative risk ratio equals 1, the outcome is equally likely in both categories. Z-values reflect whether the estimated relative risk ratios are statistically different from one. While we have to take all possible outcomes of BMI jointly into account in the statistical analysis, we focus on obesity when discussing the results.
[Table 1 about here] For the Swiss sample, the covariates of obesity are as follows:
- The probability of being obese increases up to the age of 55-59 and then declines again. A person in the age category 55-59 has a 2.68 greater probability of being obese than a person in the age category 35-39.
- The probability of a woman being obese is 0.64 compared to a man.
- People with a higher level of education than mandatory schooling have a statistically significantly smaller probability of being obese.
- Widowed people are slightly more likely to be obese than married people.
- Foreigners are more likely to be overweight than nationals and about equally likely to be obese.
- Relative to full-time workers, part-time workers are less likely to be obese and housekeepers or the chronically ill are more likely to be obese.
- The probability of an individual being obese decreases with increased income.
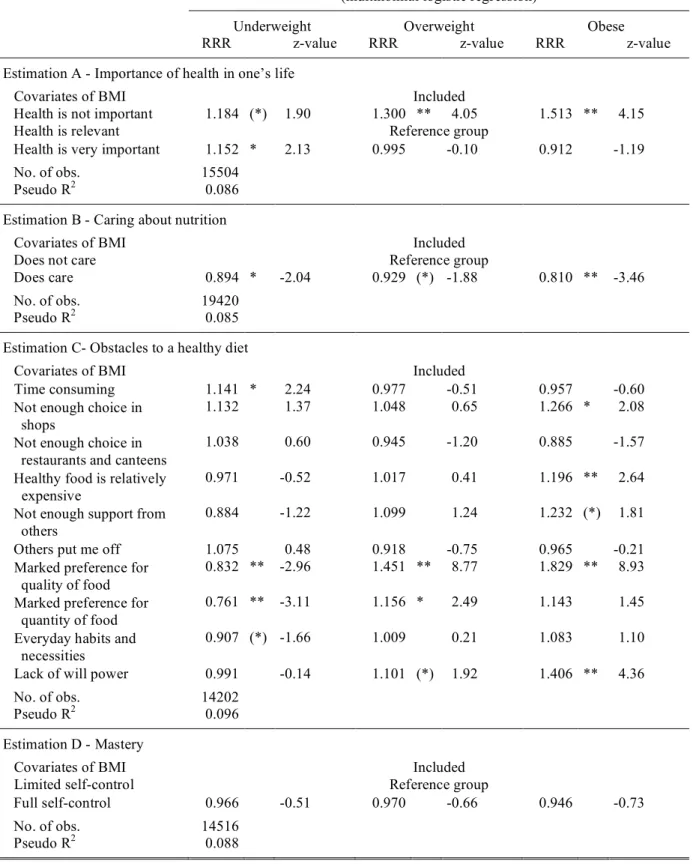
The results so far do not address the issue of limited will power and obesity. Rather, the correlations with demographic and socio-economic variables reflect many factors associated with body mass and serve as a baseline to study additional factors. Table 2 presents the results for two of them: ignorance and will power. Estimations A and B each include an indicator for ignorance concerning future health outcomes. This can be interpreted as a high discount rate in the traditional economic sense. We find that people who report that health is not a relevant issue for them are statistically significantly more likely to be obese than people who report that health is either relevant or very important for them. The relative risk ratio indicates a 1.51
greater probability. Consistent with this, people who care about their diet are less likely to be obese, with a risk ratio of 0.81 relative to people who do not care.
[Table 2 about here]
Estimation C presents correlations between reported obstacles to a healthy diet and body mass. The relative risk ratios thereby need to be interpreted with caution. Social desirability and self-justification might well distort some of people’s self reports and thus measured correlations. However, in estimation C, all the survey items are jointly included and not all items are equally attractive in justifying overweight or obesity. Five obstacles to a healthy diet are found to be statistically significantly related to a respondent being obese: not enough choice in shops, the relative cost of healthy food, not enough support from others, strong preference for good food, and lack of will power. While the high relative risk ratio of 1.83 for obesity in the case of a strong preference for good food can well capture taste, it can also reflect a cheap excuse for being overweight or obese. Such an alternative interpretation is much less plausible for the correlation with lack of will power. It is difficult to think of a reason for obesity, which makes it attractive for people to falsely report a lack of will power. Rather, it seems that, when it comes to a healthy diet, a lack of will power in fact increases the probability of being obese, the relative risk ratio being 1.41.
Estimation D studies the differential obesity risk for a general indicator of perceived control. No statistically different probability is found in the group with full and limited self-control. In our analysis predicting behavioral outcomes, the relative risk ratio with domain specific reports of will power thus indicates some bounded rationality in food consumption while the relative risk ratio with the general indicator does not.
Obesity and subjective well-being
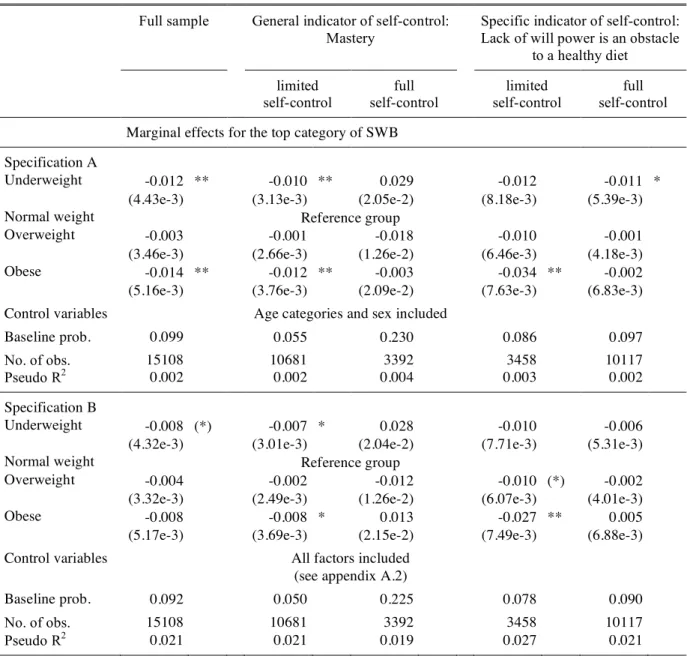
People’s judgments of their subjective well-being allow a further evaluation of certain behavioral outcomes. According to the basic hypothesis, obesity is expected to negatively affect the subjective well-being of those with limited will power. For them, obesity is not meant to be the outcome of rational food consumption but rather of time inconsistent behavior. The dependent variable “reported subjective well-being” is now an ordinal measure. We estimate ordered probit regressions and calculate marginal effects for the top category of subjective well-being. For dummy variables, the marginal effects indicate a change in the probability of reporting high subjective well-being. In Table 3, results for two different specifications are presented. Specification A includes people’s body mass, dividing it into
four categories, as well as categorizations of their age and sex. This specification assures that no other choice variables pick up any potential negative consequence of obesity on well-being. Specification B includes a large set of covariates of subjective well-well-being. The Swiss Health Survey provides sufficient information about individual characteristics to specify a micro econometric well-being function, that is similar to the ones usually applied when testing economic issues. Table A.2 in the appendix presents the results for such a specification, including all the control variables and covering the full sample. They confirm previous findings in the literature on the correlates of happiness. The findings for the BMI are also shown in the lower half of the first column in Table 3.
[Table 3 about here]
In both equations with the full sample, obesity is negatively correlated with subjective well-being. However, the partial correlation is not statistically significant in specification B. Moreover, the partial correlations are not yet a test of the theoretical prediction. A very high BMI is hypothesized to negatively affect well-being if it is the result of limited self-control, but not otherwise. Therefore, the partial correlation between obesity and subjective well-being are estimated separately for people with full and limited control. Both indicators of self-control are applied: mastery and domain specific will power. Table A.3 in the appendix shows the number of observations for each combination of body mass and self-control. In the least populated cell (full mastery x obesity), there are still 276 observations. The distribution of characteristics thus allows an implementation of the proposed empirical test.
With two specifications each, results from eight estimations are summarized in Table 3. Consistent with the basic hypothesis, obesity is related with lower subjective well-being when people have limited self-control but no statistically significant effect is found for the sample of people classified as having full self-control. The marginal effect is largest with specification A for the sample of people who report a lack of will power as being an obstacle to a healthy diet. The probability of reporting high subjective well-being is 3.4 percentage points lower for people who are obese rather than normal weight, whereby the baseline probability for people in the reference group is 8.6 percent.5
5 We also studied the differential effect of obesity on subjective well-being, estimating an interaction
term in the full sample. The size of effects is similar to those in Table 3 for both indicators and both specifications. However, for the general indicator of self-control, the general effect of obesity on subjective well-being is imprecisely measured and reduces the statistical significance of the interaction
For specification B, the marginal effects of obesity are also studied, only using responses to the single statement “I enjoy my life”. This statement is closest to people’s judgment of their satisfaction with life that is often applied in the economic study of happiness. We find results very similar to the ones in Table 3 for the compound measure. For the full sample, there is no difference in the reported enjoyment of life between obese people and people with normal weight (marginal effect=-1.4 percentage points, z=-1.11). However, the marginal effects for being obese rather than normal weight are statistically significantly negative if calculated for people with limited mastery 2.36, z=-1.66) and with limited domain specific will power (-6.28, z=-2.64). In contrast, the marginal effects for obesity are close to zero in the sample of people scoring high on mastery (-0.32, z=-0.11) and will power (1.51, z=0.93).6
The results for enjoyment of life are thus comparable to the results for subjective well-being in general, and in line with the basic hypothesis.
Together, the pieces of evidence from the two approaches indicate that the phenomenon of obesity can only be understood when going beyond revealed preference and the assumption of unlimited consumer sovereignty, but taking limited will power into account.
C. Robustness analysis and discussion
Three related issued remain open concerning the approaches used: the generalization of self-control behavior, reverse causality, and the distinction between outcome and process as possible reasons for reduced well-being when somebody is obese. As far as possible, we address these issues empirically. conducting robustness tests for the results in Table 3.
The first issue has to do with the nature of limited self-control. People are exposed to many opportunities, with low immediate marginal costs, but high marginal benefits. The question arises whether people with a self-control problem make myopic decisions when faced with all, or most, of these opportunities, or whether they are able to control some challenges to self-control, but find it too difficult to control all of them. The latter view fits in with the idea that there is a limited capacity for self-regulation. Resisting one temptation may result in poorer regulation of a concurrent desire for immediate gratification, or vice versa (Muraven et al. 1998).
the interaction term with obesity is highly statistically significant (z=-3.59 in specification B). All results are available from the author on request.
For the identification of limited will power in our approach, it has to be assumed that either self-control behavior generalizes across-the-board or tempting activities that are close substitutes have to be taken into account statistically.7
The idea that self-control resembles a muscle might be particularly relevant in understanding the interplay between obesity and smoking (Gruber and Frakes 2006). People who work at controlling their eating habits might give up on resisting smoking and vice versa.8
Therefore, when testing for the negative effect of obesity, we also include information about whether somebody is a smoker or non-smoker. For the main specification B, with the specific indicator of self-control, we find almost identical marginal effects as before. For people with limited self-control, the marginal effect of obesity is -0.026 (-0.027 before). For people with full self-control, the marginal effect of obesity is 0.005 (0.005 before). The main result is thus robust to the inclusion of the closest substitute to yielding to the temptation to overconsume.
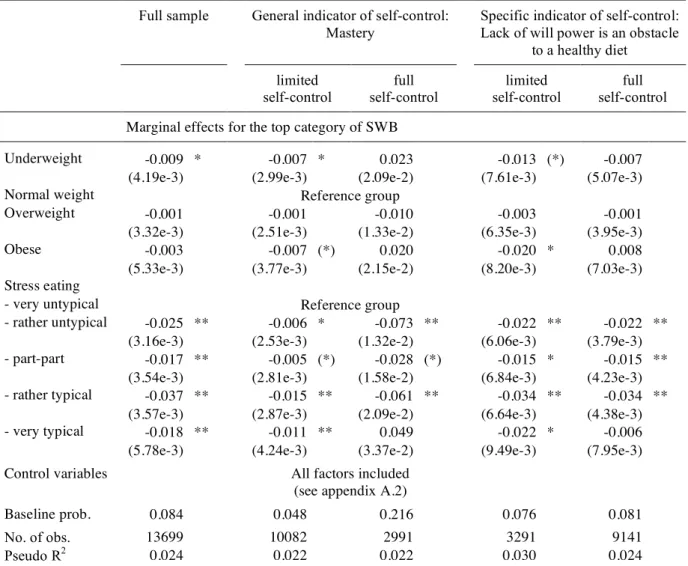
The second issue concerns causality. To what extent do the consequences of obesity due to limited will power reduce subjective well-being and to what extent does the experience of reduced well-being lead to stress/frustration eating and obesity? This is a valid concern, even though we do not interpret the correlation between obesity and subjective well-being as such, but rather the differential effect for people with full and limited self-control. The data set at hand captures whether somebody turns to eating when stressed. The written questionnaire includes this item: “In the following, a description is given how people can react to various difficult, stressful and annoying situations. Please tick what you typically do when you are stressed. … ‘I eat something.’ … very untypical, rather untypical, part-part, rather typical, very typical.” We include the responses to this item as additional control variables in the equation explaining subjective well-being (see specification B in Table 3). The test is now whether obesity still reduces subjective well-being more in the case of limited will power than in the case of full will power, taking into account whether somebody turns to eating when stressed. Table 4 shows the results.
[Table 4 about here]
7 This condition can also explain why a domain specific indicator of will power is a better predictor of
obesity and reduced well-being of obese people than a general indicator of perceived control.
8 People’s ability to self-regulate in a certain domain may not only depend on the effort they invest in
other domains, but also on effort invested in the successful performance of tasks in daily work and family life (if they involve self-regulatory exertion of effort). This line of argument might be pursued to explore the relation between increased demands on women at home and on the job on the one hand and female obesity on the other hand.
Stress eating is negatively correlated with subjective well-being in the full sample, keeping body mass constant. Moreover, the marginal effects are sizeable. While the baseline probability of people reporting subjective well-being in the top category is 8.4 percent, this probability is reduced by between 1.7 and 3.7 percentage points if stress eating is not ‘very untypical’ but is either ‘rather untypical’ or ‘very typical’. However, the differential effect of obesity on subjective well-being between people with limited and full self-control is not explained by stress eating. For the general indicator of self-control, the difference in the marginal effects of obesity on individual well-being is slightly larger when comparing people with limited and full control. For the specifications applying the specific indicator of self-control, the difference in marginal effects is slightly reduced. However, people who lack the will power to stick to a healthy diet still report a significantly lower subjective well-being when they are obese (marginal effect = -2.0 percentage points), while there is no such negative effect for people who report full self-control. A direct test for reverse causation thus cannot explain the reduced well-being of obese people in the case of limited will power. The third question is whether reduced will power as such, rather than its consequences, is responsible for lower well-being. Limited will power might well repeatedly lead to experiencing frustration because plans regarding one’s diet are not realized. People who experience self-control problems then suffer reduced self-esteem, and thus lower subjective well-being. Related empirical evidence is found in a community sample of 2,000 adults (Greeno et al. 1998). In addition to a higher BMI, the lack of perceived eating control was associated with lower satisfaction with life. For men, it was only the lack of eating control that was correlated with reported subjective well-being. This line of reasoning is important in order to understand the relationship between appearance norms, body image and eating disorders (Derenne and Beresin 2006). In our analysis, this aspect is not studied directly. However, the effect of limited will power on the level of people’s well-being is statistically taken into account when estimating separate equations as it enters into the constant term.
V.
Concluding Remarks
Obesity has become a major health issue in most Western countries. There is now a big debate about whether people should be “free to choose obesity” and about the role government should play in people’s food consumption. Policy proposals range from doing nothing to extending nutrition labels, restricting the advertising of fast-food restaurants on television and limiting the availability of junk food in schools (for empirical analyses, see,
e.g., Anderson and Butcher 2005; Chou et al. 2005; Variyam and Cawley 2006). Key to a fruitful discourse is some understanding of the causes of obesity. This has spurred tremendous research in many different sciences. Research in economics has provided a large number of insights on how technological progress, and therewith a reduction of the relative price of food, contributed to the increase in obesity. However, any analysis solely based on the revealed preference approach is not well equipped to study whether certain behavior in fact reflects people’s long-term plans. The increased availability of food might well have overstrained people’s will power and led to suboptimal consumption decisions relative to their own standards.
In this paper, we propose empirical strategies to explore the role of limited will power in obesity and present the respective evidence. We emphasize the potential insights from directly studying people’s ex post evaluation of their consumption choice in terms of reported subjective well-being. In a large representative sample for Swiss adults, it is found that people with limited will power in pursuing a healthy diet suffer reduced subjective well-being when they are obese. In contrast, no such reduction in well-being is estimated for people who are in control of their diet. These findings support the view that increased availability of food and drink makes life harder for people who are prone to revise their consumption plans when tempted.
Of course, some people actively protect themselves against temptation, e.g., by not going shopping on an empty stomach or by not having food next to them on the front seat of their car. But even so, more and more evidence suggests that this is not enough and that there is a need for institutional innovations that help people with self-control problems to protect themselves without incurring high costs on people who do not struggle with food consumption and without undermining self-control any further.
Appendix
Subjective well-being (translated from Grob et al. 1991) To what extent do the following statements apply to you?
- My future looks bright.
- I enjoy life more than most people.
- I am satisfied with how my life plans materialize.
- I deal well with those things in my life that cannot be changed.
- Whatever happens, I make the best out of it.
- I enjoy my life.
- My life is meaningful to me.
- My life is on the right track.
Possible answers: 1=completely wrong, 2=very wrong, 3=rather wrong, 4=rather accurate, 5=very accurate, 6=completely accurate.
The responses are added together (SWB_tot) and summarized on a six point scale according to the following criteria:
SWB_tot>=44 & SWB_tot<=48 SWB=6
SWB_tot>=40 & SWB_tot<44 SWB=5
SWB_tot>=36 & SWB_tot<40 SWB=4
SWB_tot>=32 & SWB_tot<36 SWB=3
SWB_tot>=28 & SWB_tot<32 SWB=2
SWB_tot>=8 & SWB_tot<28 SWB=1
Mastery (based on 4 out of 7 questions from Pearlin et al. 1981)
When you think about your life, how strongly do you agree or disagree with these statements about yourself?
- There is really no way I can solve some of the problems I have.
- Sometimes I feel that I’m being pushed around in life.
- I have little control over the things that happen to me.
- I often feel helpless in dealing with the problems of life.
Possible responses: completely agree, rather agree, rather disagree, completely disagree.
Obstacles to a healthy diet
Many people – maybe you too – attach importance to a healthy diet. Do you see any obstacles for someone pursuing a healthy diet? Please tick all the reasons that apply!
- Too much time spent on shopping and preparing food
- Not enough choice in shops
- Not enough choice in restaurants and canteens
- Healthy food is relatively expensive
- Not enough support from others
- Others put me off
- Strong preference for quality of food
- Strong preference for quantity of food
- Habits and necessities of everyday life
Figure 1. Obesity across countries
Note: Percentage of population aged 15 and over, with a BMI greater than 30 (2003 or latest available year).
Source: OECD Factbook 2005.
Figure 2. Distribution of BMI in the adult population of Switzerland, 2002
Note: Weighted estimation based on a sample of 19,471 observations.
Source: Swiss Health Survey 2002.
0% 5% 10% 15% 20% 25% 30% 35% KoreaJapan Switzerland
NorwayItalyAustriaFrance Denmark
Netherlands
SwedenPolandBelgiumIcelandSpainFinlandPortugalGermanyIreland Czech Republic Canada New Zealand Hungary Luxembourg Australia Slovak RepublicUnited Kingdom
Mexico United States
Table 1. Covariates of Low and High BMI in Switzerland, 2002
Estimated relative risk ratios, base outcome is ‘normal weight’ (multinomial logistic regression)
Underweight Overweight Obese
RRR z-value RRR z-value RRR z-value
Demographic factors
Age 15-19 2.137 ** 5.21 0.284 ** -7.08 0.124 ** -5.10
Age 20-24 1.494 ** 3.21 0.619 ** -3.72 0.745 -1.36
Age 25-29 1.222 (*) 1.89 0.874 -1.39 0.912 -0.53
Age 30-34 0.988 -0.13 0.956 -0.58 0.817 -1.35
Age 35-39 Reference group
Age 40-44 0.898 -1.10 1.190 * 2.30 1.450 ** 2.80 Age 45-49 0.901 -0.99 1.331 ** 3.61 2.138 ** 5.82 Age 50-54 0.655 ** -3.70 1.684 ** 6.60 2.272 ** 6.20 Age 55-59 0.527 ** -5.39 1.739 ** 7.15 2.680 ** 7.81 Age 60-64 0.470 ** -5.65 1.832 ** 7.50 1.875 ** 4.56 Age 65-69 0.360 ** -4.93 2.158 ** 6.90 2.358 ** 4.86 Age 70-74 0.375 ** -4.35 2.044 ** 5.91 2.351 ** 4.56 Age 75-79 0.523 ** -2.85 2.142 ** 5.95 2.066 ** 3.64
Age 80 and older 0.644 (*) -1.95 1.326 * 2.08 1.130 0.56
Female 4.443 ** 22.85 0.528 ** -15.01 0.644 ** -6.54
Level of education
Mandatory schooling Reference group
Secondary general edu. 1.302 * 2.43 0.539 ** -6.65 0.429 ** -5.53 Secondary prof. education 1.180 * 2.12 0.783 ** -4.64 0.648 ** -5.65 Tertiary professional edu. 1.195 1.47 0.787 ** -3.21 0.488 ** -5.75
University 1.816 ** 5.31 0.435 ** -9.39 0.299 ** -7.70
Marital status
Married Reference group
Single 1.380 ** 4.59 0.744 ** -5.74 1.052 0.62 Widowed 1.121 1.00 0.975 -0.37 1.201 (*) 1.83 Divorced 1.321 ** 3.03 0.910 -1.49 1.021 0.21 Separated 1.384 (*) 1.69 0.783 (*) -1.66 1.365 1.53 Citizenship status Foreigner 0.886 -1.55 1.229 ** 3.81 1.109 1.18
Main life circumstances
Full-time job Reference group
Part-time job 1.243 ** 3.70 0.754 ** -5.41 0.742 ** -3.50 Family business 1.580 1.49 0.897 -0.43 1.142 0.34 In education 1.330 * 2.46 0.732 * -2.02 0.692 -1.22 Unemployed 1.522 * 2.50 0.945 -0.42 1.181 0.82 Housework 1.248 ** 3.20 0. 880 * -2.25 1.194 * 2.00 Retired 1.500 * 2.17 0.945 -0.56 1.171 1.04 Chronically ill 1.473 * 2.13 0.903 -0.85 2.043 ** 4.69 Income Ln(equivalence income) 0.993 -0.12 0.851 ** -4.08 0.766 ** -4.62 No. of obs. 19435 Pseudo R2 0.084
Notes: Multinomial logit regression. Further control variables not shown are ‘education not defined’, ‘other paid activity’, ‘other life circumstances’, ‘income not available’. Significance levels: (*) .05<p<.1, * .01<p<.05, ** p<.01.
Table 2. Effects of Reported Ignorance and Will Power Towards Health and Nutrition on BMI
Estimated relative risk ratios, base outcome is ‘normal weight’ (multinomial logistic regression)
Underweight Overweight Obese
RRR z-value RRR z-value RRR z-value
Estimation A - Importance of health in one’s life
Covariates of BMI Included
Health is not important 1.184 (*) 1.90 1.300 ** 4.05 1.513 ** 4.15
Health is relevant Reference group
Health is very important 1.152 * 2.13 0.995 -0.10 0.912 -1.19
No. of obs. 15504
Pseudo R2 0.086
Estimation B - Caring about nutrition
Covariates of BMI Included
Does not care Reference group
Does care 0.894 * -2.04 0.929 (*) -1.88 0.810 ** -3.46
No. of obs. 19420
Pseudo R2 0.085
Estimation C- Obstacles to a healthy diet
Covariates of BMI Included
Time consuming 1.141 * 2.24 0.977 -0.51 0.957 -0.60
Not enough choice in shops
1.132 1.37 1.048 0.65 1.266 * 2.08
Not enough choice in restaurants and canteens
1.038 0.60 0.945 -1.20 0.885 -1.57
Healthy food is relatively expensive
0.971 -0.52 1.017 0.41 1.196 ** 2.64
Not enough support from others
0.884 -1.22 1.099 1.24 1.232 (*) 1.81
Others put me off 1.075 0.48 0.918 -0.75 0.965 -0.21
Marked preference for quality of food
0.832 ** -2.96 1.451 ** 8.77 1.829 ** 8.93 Marked preference for
quantity of food
0.761 ** -3.11 1.156 * 2.49 1.143 1.45
Everyday habits and necessities
0.907 (*) -1.66 1.009 0.21 1.083 1.10
Lack of will power 0.991 -0.14 1.101 (*) 1.92 1.406 ** 4.36
No. of obs. 14202
Pseudo R2 0.096
Estimation D - Mastery
Covariates of BMI Included
Limited self-control Reference group
Full self-control 0.966 -0.51 0.970 -0.66 0.946 -0.73
No. of obs. 14516
Pseudo R2 0.088
Notes: Multinomial logit regression. Same control variables included as in Table 1. Significance levels: (*) .05<p<.1, * .01<p<.05, ** p<.01.
Table 3. BMI and Reported Subjective Well-Being
Full sample General indicator of self-control: Mastery
Specific indicator of self-control: Lack of will power is an obstacle
to a healthy diet
limited full limited full
self-control self-control self-control self-control
Marginal effects for the top category of SWB
Specification A
Underweight -0.012 ** -0.010 ** 0.029 -0.012 -0.011 *
(4.43e-3) (3.13e-3) (2.05e-2) (8.18e-3) (5.39e-3)
Normal weight Reference group
Overweight -0.003 -0.001 -0.018 -0.010 -0.001
(3.46e-3) (2.66e-3) (1.26e-2) (6.46e-3) (4.18e-3)
Obese -0.014 ** -0.012 ** -0.003 -0.034 ** -0.002
(5.16e-3) (3.76e-3) (2.09e-2) (7.63e-3) (6.83e-3)
Control variables Age categories and sex included
Baseline prob. 0.099 0.055 0.230 0.086 0.097
No. of obs. 15108 10681 3392 3458 10117
Pseudo R2 0.002 0.002 0.004 0.003 0.002
Specification B
Underweight -0.008 (*) -0.007 * 0.028 -0.010 -0.006
(4.32e-3) (3.01e-3) (2.04e-2) (7.71e-3) (5.31e-3)
Normal weight Reference group
Overweight -0.004 -0.002 -0.012 -0.010 (*) -0.002
(3.32e-3) (2.49e-3) (1.26e-2) (6.07e-3) (4.01e-3)
Obese -0.008 -0.008 * 0.013 -0.027 ** 0.005
(5.17e-3) (3.69e-3) (2.15e-2) (7.49e-3) (6.88e-3)
Control variables All factors included
(see appendix A.2)
Baseline prob. 0.092 0.050 0.225 0.078 0.090
No. of obs. 15108 10681 3392 3458 10117
Pseudo R2 0.021 0.021 0.019 0.027 0.021
Notes: Marginal effects based on ordered probit regression. Standard errors in parentheses. Significance levels: (*) .05<p<.1, * .01<p<.05, ** p<.01.
Table 4. Reverse Causality: Stress Eating
Full sample General indicator of self-control: Mastery
Specific indicator of self-control: Lack of will power is an obstacle
to a healthy diet
limited full limited full
self-control self-control self-control self-control
Marginal effects for the top category of SWB
Underweight -0.009 * -0.007 * 0.023 -0.013 (*) -0.007
(4.19e-3) (2.99e-3) (2.09e-2) (7.61e-3) (5.07e-3)
Normal weight Reference group
Overweight -0.001 -0.001 -0.010 -0.003 -0.001
(3.32e-3) (2.51e-3) (1.33e-2) (6.35e-3) (3.95e-3)
Obese -0.003 -0.007 (*) 0.020 -0.020 * 0.008
(5.33e-3) (3.77e-3) (2.15e-2) (8.20e-3) (7.03e-3)
Stress eating
- very untypical Reference group
- rather untypical -0.025 ** -0.006 * -0.073 ** -0.022 ** -0.022 **
(3.16e-3) (2.53e-3) (1.32e-2) (6.06e-3) (3.79e-3)
- part-part -0.017 ** -0.005 (*) -0.028 (*) -0.015 * -0.015 **
(3.54e-3) (2.81e-3) (1.58e-2) (6.84e-3) (4.23e-3)
- rather typical -0.037 ** -0.015 ** -0.061 ** -0.034 ** -0.034 **
(3.57e-3) (2.87e-3) (2.09e-2) (6.64e-3) (4.38e-3)
- very typical -0.018 ** -0.011 ** 0.049 -0.022 * -0.006
(5.78e-3) (4.24e-3) (3.37e-2) (9.49e-3) (7.95e-3)
Control variables All factors included
(see appendix A.2)
Baseline prob. 0.084 0.048 0.216 0.076 0.081
No. of obs. 13699 10082 2991 3291 9141
Pseudo R2 0.024 0.022 0.022 0.030 0.024
Notes: Marginal effects based on ordered probit regression. Standard errors in parentheses. Significance levels: (*) .05<p<.1, * .01<p<.05, ** p<.01.
Table A.1. Descriptive Statistics Mean / fraction Std. dev. Mean / fraction Std. dev. Subjective well-being 3.76 1.309 Citizenship status
BMI 24.24 4.176 National 90.14%
Demographic factors Foreigner 9.86%
Age 47.81 17.044 Main life circumstances 39.20%
Male 45.26% Full-time job 21.20%
Female 54.74% Part-time job 0.54%
Level of education Family business 0.48%
Mandatory schooling 14.79% In education 4.76%
Secondary general edu. 6.08% Unemployed 1.70%
Secondary prof. edu. 58.46% Housework 20.32%
Tertiary professional edu. 10.46% Retired 17.53%
University 7.31% Chronically ill 2.28%
Marital status Other 1.36%
Married 55.62% Income
Single 26.30% Ln(equivalence income) 8.23 0.499
Widowed 7.86% Divorced 8.77% Separated 1.45% Household composition 1 adult 28.01% 2 adults 53.75% 3 adults 10.58%
4 adults and more 7.65%
No children 72.86%
1 child 10.90%
2 children 12.05%
3 children and more 4.19%
Notes: Descriptive statistics are for the sample underlying the estimation in Table A.2 based on 15,108 observations. Mean income is calculated based on 14,160 observations.
Table A.2. Covariates of Subjective Well-Being in Switzerland, 2002
Ordered probit regression Coefficient z-value Marginal effect for
a score of 6
z-value
BMI
Underweight -0.053 (*) -1.91 -0.008 (*) -1.96
Normal weight Reference group
Overweight -0.022 -1.08 -0.004 -1.09 Obese -0.047 -1.42 -0.008 -1.46 Demographic factors Age 15-19 0.125 (*) 1.74 0.022 1.62 Age 20-24 0.293 ** 5.04 0.058 ** 4.33 Age 25-29 0.195 ** 4.39 0.036 ** 3.96 Age 30-34 0.120 ** 3.35 0.021 ** 3.15
Age 35-39 Reference group
Age 40-44 -0.064 (*) -1.78 -0.010 (*) -1.84 Age 45-49 -0.040 -1.01 -0.006 -1.03 Age 50-54 -0.037 -0.88 -0.006 -0.90 Age 55-59 0.034 0.83 0.006 0.82 Age 60-64 0.135 ** 3.04 0.024 ** 2.83 Age 65-69 0.353 ** 5.86 0.071 ** 4.96 Age 70-74 0.357 ** 5.39 0.072 ** 4.53 Age 75-79 0.405 ** 5.74 0.084 ** 4.73
Age 80 and older 0.525 ** 6.68 0.117 ** 5.27
Female 0.086 ** 4.11 0.014 ** 4.12
Level of education
Mandatory schooling Reference group
Secondary general edu. -0.047 -1.09 -0.008 -1.12
Secondary prof. education 0.030 1.07 0.005 1.07
Tertiary professional edu. 0.104 ** 2.71 0.018 * 2.57
University 0.021 0.50 0.004 0.49
Marital status
Married Reference group
Single -0.214 ** -6.37 -0.033 ** -6.78
Widowed -0.077 (*) -1.76 -0.012 (*) -1.84
Divorced -0.113 ** -3.02 -0.018 ** -3.22
Separated -0.238 ** -3.18 -0.034 ** -3.78
Household composition
1 adult Reference group
2 adults 0.098 ** 3.28 0.016 ** 3.29
3 adults 0.095 * 2.40 0.016 * 2.28
4 adults and more 0.182 ** 3.97 0.033 ** 3.61
No children Reference group
1 child 0.049 1.55 0.008 1.51
2 children 0.063 (*) 1.83 0.011 (*) 1.78
3 children and more 0.123 * 2.53 0.022 * 2.36
Citizenship status
Foreigner -0.119 ** -4.06 -0.018 ** -4.33
Main life circumstances
Full-time job Reference group
Part-time job -0.059 * -2.56 -0.010 ** -2.62 Family business 0.121 1.04 0.022 0.97 In education -0.004 -0.08 -0.001 -0.08 Unemployed -0.367 ** -5.46 -0.048 ** -7.20 Housework -0.027 -1.02 -0.004 -1.03 Retired -0.182 ** -3.46 -0.028 ** -3.75 Chronically ill -0.578 ** -9.23 -0.065 ** -14.40
Income
Ln(equivalence income) 1.415 ** 8.43 0.422 ** 6.56
No. of obs. 15108
Pseudo R2 0.021
Notes: Ordered probit regression. Further control variables not shown are ‘education not defined’, ‘other paid activity’, ‘other life circumstances’, ‘income not available’, ‘interview in French’, ‘interview in Italian’. Significance levels: (*) .05<p<.1, * .01<p<.05, ** p<.01.
Data source: Swiss Health Survey 2002.
Table A.3. Distribution of Observations
Underweight Normal
weight
Overweight Obese Total
Mastery Limited self-control 1,451 5,461 2,977 792 10,681 (10.31%) (38.80%) (21.15%) (5.63%) (75.90%) Full self-control 352 1,692 1,072 276 3,392 (2.50%) (12.02%) (7.62%) (1.96%) (24.10%) Total 1,803 7,153 4,049 1,068 14,073 (12.81%) (50.83%) (28.77%) (7.59%) (100.00%)
Will power in sticking to a healthy diet
Limited self-control 458 1,710 975 315 3,458 (3.37%) (12.60%) (7.18%) (2.32%) (25.47%) Full self-control 1,247 5,098 3,000 772 10,117 (9.19%) (37.55%) (22.10%) (5.69%) (74.53%) Total 1,705 6,808 3,975 1,087 13,575 (12.56%) (50.15%) (29.28%) (8.01%) (100.00%)