Committee on Agricultural Economics, Hungarian Academy of Sciences
STUDIES IN
AGRICULTURAL ECONOMICS
No. 110.
Budapest 2009A K I
Studies in Agricultural Economics No. 110.
HU ISSN 1418 2106
The Studies in Agricultural Economics is a scientifi c journal published by the Hungarian Academy of Sciences and the Research Institute of Agricultural Economics, Budapest. Papers of agricultural economics interpreted in a broad sense covering all fi elds of the subject includ-ing econometric, policy, marketinclud-ing, fi nancial, social, rural development and environmental as-pects as well are published, subsequent to peer review and approval by the Editorial Board.
Editorial Board Popp, József (Chairman) Szabó, Gábor (Editor-in-chief) Barnafi , László (Technical Editor) Lehota, József
Bojnec, Štefan (Slovenia) Magda, Sándor
Cruse, Richard M. (USA) Mészáros, Sándor
Csáki, Csaba Mihók, Zsolt (Associate Editor)
Fekete-Farkas, Mária Nábrádi, András
Fehér, Alajos Nagy, Frigyes
Fieldsend, Andrew Szakály, Zoltán
Forgács, Csaba Szűcs, István
Gorton, Matthew (United Kingdom) Tóth, József Heijman, W. J. M. (The Netherlands) Udovecz, Gábor
Kapronczai, István Urfi , Péter
Kiss, Judit Vizdák, Károly
Lakner, Zoltán
Manuscripts should be sent via e-mail to the Editor-in-chief (aki@aki.gov.hu). Instructions for the authors can be found on the website of the Research Institute of Agricultural Economics: http://www.aki.gov.hu
© Research Institute of Agricultural Economics 1463 Budapest, POB. 944. Hungary
Consumption patterns in the market of pork and pork products
Szakály, Zoltán1 Horváth–Kovács, Bernadett¹ Polereczki, Zsolt¹ Nábrádi, András2 AbstractPork is a source of nutrients essential for the human body but still it is regarded by consumers as a non-healthy product. The main objective of the study was to analyse consumption patterns concerning pork products and to defi ne alternative target markets in bigger Hungarian towns. In the course of the research, 494 people, representative of the base population, were questioned. According to the results obtained, the consumers’ opinion and the already formed image are less favourable regarding pork than poultry in almost all respects. Respondents regarded pork as an out-of-date, slightly boring and aging product. The applied cluster analysis identifi ed fi ve different consumer segments. Among them, rational young consumers represent the primary target group, which can be reached by effi cient communication. The most important task of a collective marketing strategy is to alter the unfavourable image of pork.
Keywords
pork, consumption patterns, segmentation, re-positioning
Introduction
Pork plays an important role in the nutrition of the EU population. It provides exactly 50 per cent of the total meat consumption of the EU (Popp and Potori, 2009), while this share is somewhat lower in Hungary (42.3%). Despite the difference in the percentages, the level of the Hungarian pork consumption is similar to the average level of pork consumption in the EU, 28 kg per year per capita. From the aspect of the Hungarian meat industry, it can also be considered as a favourable trend that pork consumption increased by 8% from 2004 to 2006 (HCSO, 2008).
Pork ensures essential nutrients for the human body; its nutrient content is signifi cantly higher than its energy content. Pork is especially rich in certain vitamins, minerals and protein. According to Szakály, Fülöp and Nábrádi (2008), 100 g of pork leg contains 17-80 per cent of vita-mins B and 40 per cent of protein in terms of the recommended daily intake and in the case of miner-als it contains 14% of magnesium, 18% of zinc and 21% of phosphorus of the RDI. On the basis of the above mentioned, as well as based on Hungarian (Holló, 2004; Honikel and Arneth, 1997) and international references (Bech-Larsen, Grunert, and Poulsen, 2001; Cheeke, 1993; Moran, 1986) it can be stated that pork is a health promoting, so-called functional food with positive nutritional benefi ts.
Pork is often criticized because of its high fat and cholesterol content (Várhegyi, J.-né and Várhegyi, J. 2007). Despite these attacks pork does not have a higher fat content than the meat of other animal breeds, within the same breed the differences among the different meat parts are much bigger than among the breeds. According to Honikel and Arneth (1997), pork and beef have about 58 mg cholesterol content, while chicken and turkey have 100 mg per 100 g. It means that 1 University of Kaposvár, Faculty of Economic Sciences, 7400 Kaposvár, Guba S. u. 40.,
szakaly.zoltan@ke.hu, polereczki.zsolt@ke.hu, kovacs.bernadett@ke.hu
2 University of Debrecen, Center for Agricultural and Technical Sciences, Faculty of Applied Economics and Rural Devel-opment, 4032 Debrecen, Böszörményi u. 138., nabradi@agr.unideb.hu
pork does not have a higher cholesterol content than other meats, including different types of fi sh. Investigations also showed that food derived cholesterol has a low impact on blood cholesterol level (Brisson, 1986; Cheeke, 1993).
Despite these obvious facts, pork is mostly regarded as an “unhealthy” food by consum-ers, while poultry is described as a food with positive, health protective properties. Therefore, the consumption of poultry exceeds that of pork in terms of both its amount and proportion (HCSO, 2008).
In cooperation with the Faculty of Agricultural Economics and Rural Development of the University of Debrecen and the Market and Fact Market Research and Consulting Institute, the University of Kaposvár started a survey in order to analyse consumer preferences and attitudes concerning meat products and the image of various meats. The objectives of the survey set by the participating organisations were to collect information about the consumers’ opinion on various meat products, with special regard to pork, and to defi ne consumer segments in bigger Hungarian towns.
The results obtained in the survey are useful for the meat industry: they can build the infor-mation regarding the consumption patterns and image of red meats (mainly pork) into their product development, and can launch more effi cient marketing communication. On the basis of the consum-ers’ judgements, the professional organisations of the meat industry can develop such collective marketing strategies (Juhász, 2002; Éder, 2007) that ensure the desired market position in the future (Nábrádi, 2007). The defi nition of consumer segments and clusters may signifi cantly contribute to the knowledge on the motives of consumer behaviour concerning meat products, which will result in a more effi cient future strategy building (Polereczki, Huszka and Szakály, 2008; Polereczki and Szakály, 2008).
Materials and methods
The most important principle of the survey was to select test settlements instead of the whole country. Among the settlements there were many county towns and Budapest. The size of the sample was also subordinated to this objective: altogether 494 people were selected and they were repre-sentative of the population of the settlements by age and gender. In practice it meant that in each selected settlement 100 people were questioned in a proportion that coincided with the composi-tion of the settlement’s populacomposi-tion aged 18 or over. The composicomposi-tion of the sample was determined according to the census of the Hungarian Central Statistical Offi ce (HCSO) in 2001. The settlements involved in the survey were: Budapest, Kaposvár, Szeged, Szombathely and Debrecen.
The fi rst question of the questionnaire was a so-called fi ltering question that was used to fi lter out those respondents who leave meat out of their diet. According to the results all the respondents consume meat products. The questionnaire covered the following areas: meat preferences, con-sumption frequency, image profi le of pork and poultry products and level of agreement with claims regarding the image of pork and questions about lifestyle in order to defi ne consumer segments.
Face-to-face interviews were used to collect data at the respondents’ places (Malhotra, 2008). The fi eldwork was carried out by trained interviewers. During the interview the respondents were asked their personal details with the help of which some 15% of the interviews were controlled by telephone.
In the course of the data processing and evaluation, besides the descriptive statistical meth-ods, signifi cance and factor analyses were used to characterise the differences between the segments (Grafen and Hails, 2002). The Tables show the frequency distributions of the samples, and where necessary, the means and statistical data are also outlined. Only those background variable groups are analysed among which signifi cant differences were found.
Results and discussion
Preferences for various meat types
In the fi rst step, various meats were listed and the respondents were asked to make an order of preference for them (Table 1).
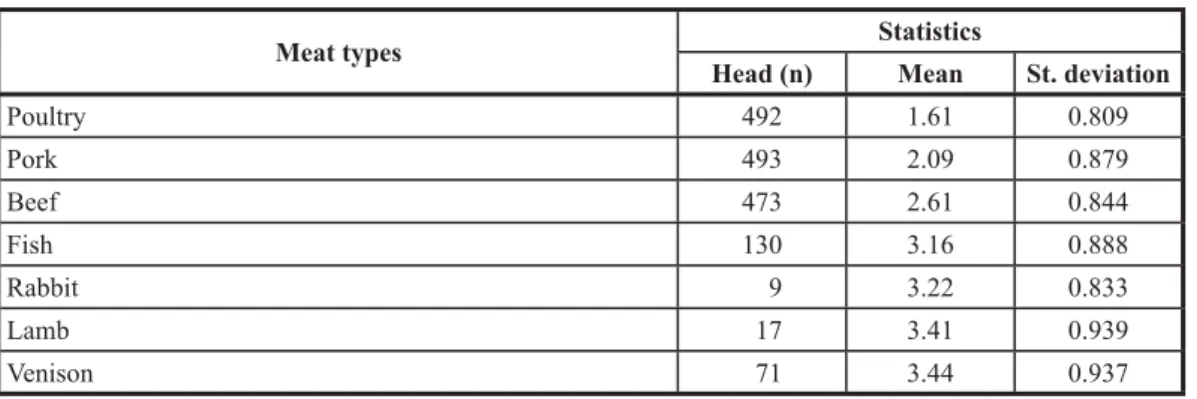
Table 1 Consumer preferences on various meat types
Meat types Statistics
Head (n) Mean St. deviation
Poultry 492 1.61 0.809 Pork 493 2.09 0.879 Beef 473 2.61 0.844 Fish 130 3.16 0.888 Rabbit 9 3.22 0.833 Lamb 17 3.41 0.939 Venison 71 3.44 0.937
Source: own data
In Table 1 the calculated means of the rank numbers assigned to the types of meat are shown, where number 1 indicates the most preferred meat type and 2, 3, 4, etc. the less preferred ones. Thus, the closer the mean value to number 1 is, the more favourable it is regarded. Based on the results an extremely high preference for poultry is revealed, which is followed by pork and then by beef. The means of the last four types of meat are much closer to each other which, besides their higher standard deviation values indicate the consumers’ different judgement on them.
In the case of poultry, a signifi cant difference was found between female and male consum-ers. Men’s preference for poultry was 0.2 lower than the mean, while that of women was 0.2 higher. The preference for pork shows a signifi cant connection according to age groups and education. Pork is mostly preferred by consumers between 50 and 59 years of age (1.98), while it is the least preferred by the younger (18-29 years old) consumers (2.34). The higher the education level of the consumers is, the less they prefer pork. Beef is more preferred by men (2.47) than women (2.75).
Consumption and preferences of product groups made of pork
The next group of questions covered consumption patterns and preferences concerning exclusively pork products. The consumption frequency of nine different product groups made of pork was analysed in the fi rst question. In order to make the consumption frequency data of differ-ent product categories comparable, the frequency categories were assigned with values from 1 to 6, indicating the increasing intensity of consumption (less than monthly: 1; 1-2 times a month: 2;
1-2 times a week: 3; … several times a day: 6); the means of these values indicate the rank order of the product groups. In this case only the opinions of those that consume the product groups were considered, and those of the non-consumers were not. The higher the value of the mean is, the more favourable the mean values presented in Table 2 are.
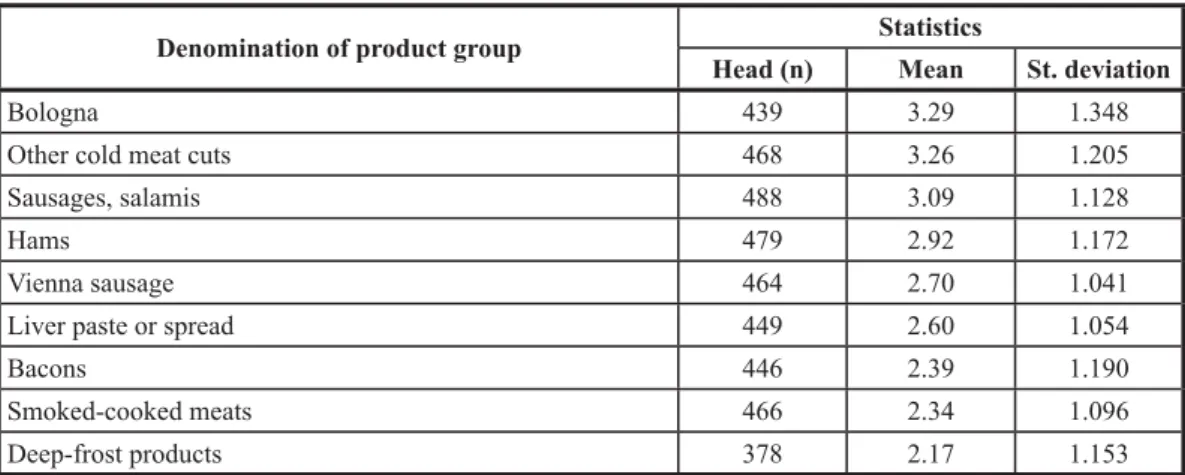
Table 2 Consumption frequency of various pork product groups according to the respondents
Denomination of product group Statistics
Head (n) Mean St. deviation
Bologna 439 3.29 1.348
Other cold meat cuts 468 3.26 1.205
Sausages, salamis 488 3.09 1.128
Hams 479 2.92 1.172
Vienna sausage 464 2.70 1.041
Liver paste or spread 449 2.60 1.054
Bacons 446 2.39 1.190
Smoked-cooked meats 466 2.34 1.096
Deep-frost products 378 2.17 1.153
Source: own data
Various types of Bologna and other cold meats are the fi rst in the order of preference with an average consumption frequency of 2-4 times a week. They are followed by sausages and salamis and then hams with an average consumption frequency of 1-2 times a week. The consumption frequen-cies of Vienna sausages and liver pastes are very similar; the last places in the order are shared by different bacons, smoked-cooked meats and deep-frozen products.
In the following step, the preferences for the studied product groups were measured on a 5 step scale, where value 1 indicated the category “do not really like to consume” and value 5 indicated the category “likes to consume very much” (Table 3).
Table 3 Preference of the respondents for various pork product groups
Denomination of product group Statistics
Head (n) Mean St. deviation
Hams 490 4.05 1.019
Sausages, salamis 492 3.79 1.084
Smoked-cooked meats 492 3.47 1.210
Vienna sausage 492 3.34 1.148
Liver pastes and spreads 492 3.31 1.270
Other cold meat cuts 490 3.16 1.060
Bacons 491 3.16 1.353
Bologna 491 3.00 1.307
Deep-frost products 489 2.42 1.261
The preference results show a different order of the product categories from consumption frequency. The fi rst two places in the order are taken by hams, and sausages and salamis; they are followed by smoked-cooked meats, Vienna sausage and liver products. Other cold meats and bacons are given the same preference values; while Bologna and deep-frost products are listed last.
The comparison of the two Tables indicates that the preference of most of the product groups differs from their consumption frequency. There is a remarkable difference in the case of hams and salamis. The difference found can be explained by the higher price of these products. However, in the case of Bologna and other meat cuts, the position of the consumption frequency is much better than that of their preference probably due to their lower price.
Image profi le of fresh pork and poultry
A seven-step semantic differential scale was used in the analysis of the image profi le of fresh pork and poultry applying 15 opposite attribute pairs. The middle value of the scale (4) is regarded as the neutral value (zero) in Figure 1, while the higher or lower values represent the ori-entation to one or the other end points of the scale.
Figure 1: Image profi le of fresh pork and poultry Source: own data
The consumers’ image on fresh pork can be summarized as follows: the level of its notoriety is suffi cient, and neither its availability, nor the ways of preparation are objected by the consumers. It has a basically good taste; it can be described as a conventional product with an obvious manly image. Its high cholesterol level is regarded as a remarkable negative feature, which is linked to the
1 0 -1 2 3 -2 -3 Unhealthy Cheap Distasteful Boring Womanly Unknown Conventional Old fashioned Young Lean Easy availability Unreliable quality Low cholesterol content Time saving preparation Varied ways of preparation
Healthy Expensive Tasty Exciting Manly Known Special Modern Old Fatty Difficult Reliable High Time demanding Non varied pork poultry
quality “fatty” by the consumers. Therefore, the product is not regarded as healthy, in this respect it is lagging far behind poultry. This image is even supported by the respondents’ beliefs that pork is a rather out-of-date, boring and “aging” product. They think that it demands more time to prepare than poultry. From the food safety aspect, pork is at least as safe as poultry. The consumers break with the trends concerning prices: according to them pork is available at lower prices than its competitor. Fresh poultry has a more favourable image that fi ts the modern nutritional trends much better. It is an easily available, basically safe, healthy and well-known product according to the consumers, and poultry has an image of a low cholesterol and lean type of meat. It is unfavourable for the pig sector that according to the consumers poultry has a better taste than pork (it indicates changes com-pared to previous surveys), which can fi t modern human nutrition better. It presents an obviously younger, rather womanly image for the consumers; while traditional or conventional attributes are less linked to it. Its preparation is more varied and time saving, which is another important advan-tage when the target group is considered. The only drawback of the product compared to its competi-tor is its price as, according to the consumers, poultry is more expensive than pork.
Factors infl uencing the consumers’ judgement on fresh pork
In the following block of questions the degree of the consumers’ agreement with various statements on fresh pork was measured. The degree of agreement was indicated on a fi ve-step scale, where value 1 meant the category “do not agree at all” and value 5 the category “completely agree with the statement”. The statements covered fi ve different areas: healthiness, price-quality rela-tion, taste-freshness, brand personalityand food safety.
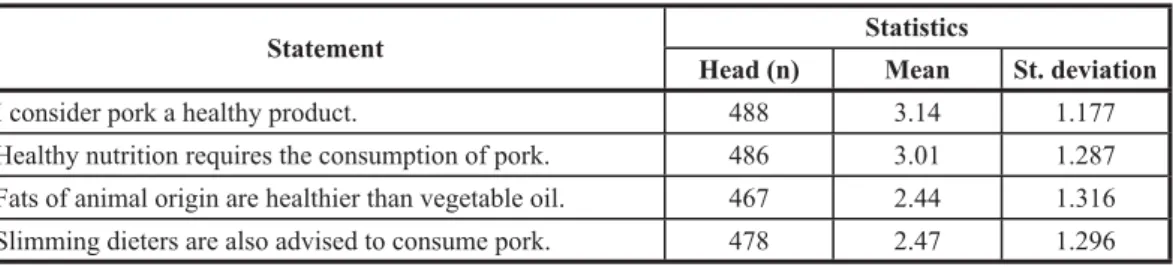
Table 4 represents the means and main statistics of the replies on the healthiness of the product. Table 4 Degree of agreement with statements on the healthiness of pork
Statement Statistics
Head (n) Mean St. deviation
I consider pork a healthy product. 488 3.14 1.177
Healthy nutrition requires the consumption of pork. 486 3.01 1.287 Fats of animal origin are healthier than vegetable oil. 467 2.44 1.316 Slimming dieters are also advised to consume pork. 478 2.47 1.296 Source: own data
The respondents agree that pork is healthy only to a moderate degree; only some of them think it is part of healthy nutrition. This fact supports the earlier information on the consumers’ opinion. If the other two statements are considered as well, then an image of such a product can be drawn up that is signifi cantly uncompetitive with poultry. Respondents agree less with the statement that animal fat is healthier than vegetable oil. Pork is regarded as a basically fatty product by them, which weakens its position further. This is the reason why people who are on a slimming diet also reject the consumption of pork.
Men (3.34) consider pork much healthier than women (2.96); they have similar views about the role of pork in healthy dieting (men: 3.16; women 2.88). A similar tendency can be seen con-cerning whether it can be part of slimming diets or not (men: 2.63; women: 2.33). Mid-aged people (30-39 years: 2.93; 40-49 years: 2.98) think that pork is less healthy than the other age groups (18-29 years: 3.09; 50-59 years: 3.19; above 60 years: 3.22).
The following group of questions covered the price-quality relationship (Table 5).
Table 5 Degree of agreement with statement on the price-quality relationship of pork
Statement Statistics
Head (n) Mean St. deviation
The price of pork is affordable. 485 3.36 0.979
I get value for money in case of Hungarian pork. 485 3.51 0.978 The purchased fresh pork is always of high quality. 488 3.18 0.966 I prefer pork of Hungarian origin to foreign pork. 488 4.22 1.128 Source: own data
According to the respondents, the price of pork is payable to a moderate degree; they think the same of its quality. The consumers’ judgement on Hungarian pork is more favourable, they think that if they purchase a Hungarian product, they get value for money. It is obvious that the degree of agreement is high in case of the preferences for Hungarian products. However, the question may arise: what does preference mean? Does it mean that the consumer prefers the Hungarian product when prices are the same or that he is willing to pay more for it as well? If so, how much more is he/she willing to pay?
More men (3.28) think that the pork they buy is of high quality than do women (3.09). An outstanding proportion of the oldest age group thinks that (3.49) pork is always of high quality (18-29 years: 3.07; 30-39 years: 3.05; 40-49 years: 3.07; 50-59 years: 3.14). The older the people are, the higher the proportion which prefers Hungarian products to foreign ones (18-29 years: 3.93; 30-39 years: 4.22; 40-49 years: 4.24; 50-59 years: 4.45) and the only exception is the eldest age group (4.36).
The next group of statements investigates the taste and freshness of pork (Table 6).
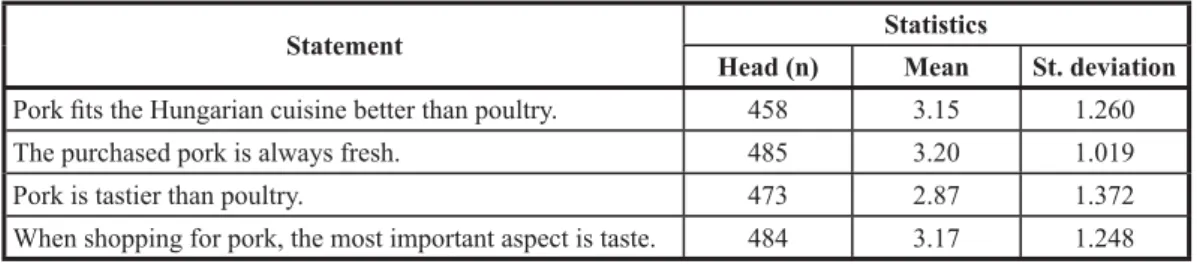
Table 6 Degree of agreement with statements on the taste and freshness of pork
Statement Statistics
Head (n) Mean St. deviation Pork fi ts the Hungarian cuisine better than poultry. 458 3.15 1.260
The purchased pork is always fresh. 485 3.20 1.019
Pork is tastier than poultry. 473 2.87 1.372
When shopping for pork, the most important aspect is taste. 484 3.17 1.248 Source: own data
The statements on taste and freshness are agreed on to a moderate degree by the respondents. The opinions about the connection between pork and Hungarian cuisine were different. Although the degree of agreement is higher than the average, the high standard deviation refl ects rather different opinions. The comparison of the tastiness of pork and poultry is even more debated. The standard deviation is high with much lower level of agreement. The highest level of agreement can be seen in case of freshness, with the lowest standard deviation of this group. The role of taste, as the most important factor infl uencing shopping decisions, is also a debated issue.
Men (3.35) consider pork to be a product fi tting the Hungarian cuisine much better than do women (2.96). This is the group where a higher proportion of the consumers think that pork is tasty as well (3.14; 2.62; respectively). Thus, the opinion of the sexes is also different about the role of taste in shopping decisions (men: 3.35; women: 3.00). The higher the education level is, the lower the level of the consumers’ agreement is. A similar, although less obvious trend can be seen in the comparison of the taste of pork and poultry. The survey reveals that respondents with lower level of education (maximum 8 elementary school years: 3.19; skilled workers: 3.25) fi nd pork much tastier than those with higher qualifi cations (secondary school qualifi cations: 2.82; higher education qualifi cations: 2.51).
The analysis of the brand personality (Table 7) strengthens the picture obtained during the image profi le examination.
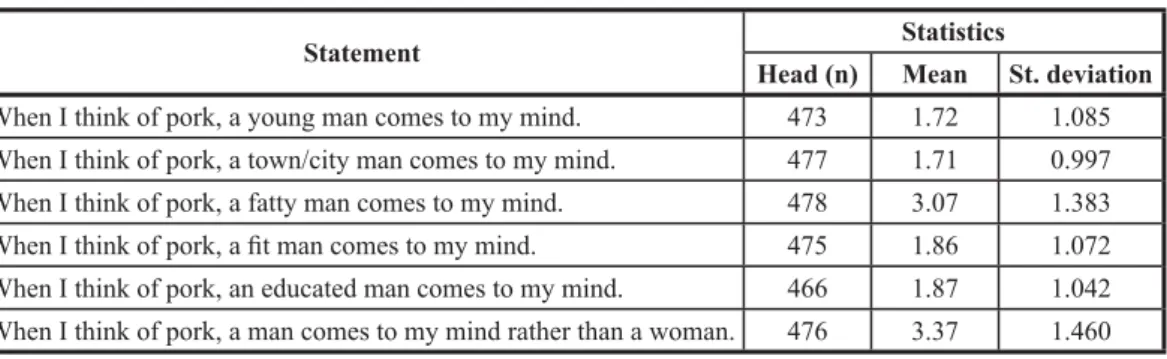
Table 7 Degree of agreement with the statements on “brand personality” of pork
Statement Statistics
Head (n) Mean St. deviation When I think of pork, a young man comes to my mind. 473 1.72 1.085 When I think of pork, a town/city man comes to my mind. 477 1.71 0.997 When I think of pork, a fatty man comes to my mind. 478 3.07 1.383 When I think of pork, a fi t man comes to my mind. 475 1.86 1.072 When I think of pork, an educated man comes to my mind. 466 1.87 1.042 When I think of pork, a man comes to my mind rather than a woman. 476 3.37 1.460 Source: own data
It is typical that pork calls an older, fatty man with lower education level into the people’s mind who lives in a rural area and avoids sports. It is obvious that this image is not what a modern foodstuff fi tting the current nutritional trends should represent. The question arises: what is the rea-son for the development of such abrand personality, and how can it be modifi ed? In order to answer these questions, it is necessary to analyse those value components of pork that are important and valuable according to the consumers.
The image of a fatty man is more typical of women (3.23) than men (2.89). A higher propor-tion of the older respondents (50-59 years: 2.03; above 60 years: 2.05) associates pork with a fi t man than younger consumers (18-29 years: 1.76; 30-39 years: 1.61; 40-49 years: 1.81). People with the lowest income associate pork less with a fatty man (2.58). A higher number of those with average (3.73) or higher income (3.58) associate it with a man than those with lowest incomes (2.84).
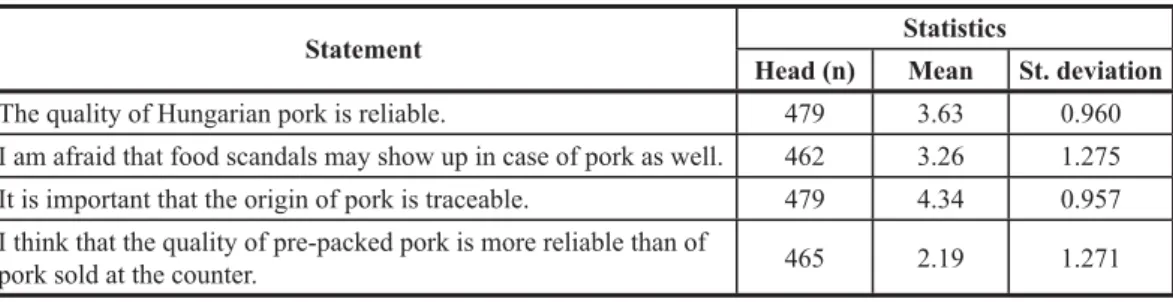
The last component of the question block targeted food safety statements (Table 8).
Respondents agreed on the importance of the traceability of pork. Although they think that the current available quality is appropriate, they are moderately afraid that food scandals will show up in case of pork as well. Typically, the respondents disagreed with the statement that the quality of pre-packed pork is more reliable than of pork sold at the counter.
Table 8 Degree of agreement with statements concerning food safety issues of pork consumption
Statement Statistics
Head (n) Mean St. deviation
The quality of Hungarian pork is reliable. 479 3.63 0.960
I am afraid that food scandals may show up in case of pork as well. 462 3.26 1.275 It is important that the origin of pork is traceable. 479 4.34 0.957 I think that the quality of pre-packed pork is more reliable than of
pork sold at the counter. 465 2.19 1.271
Source: own data
Male consumers trust (3.73) the reliability of Hungarian pork better than do women (3.53). The eldest group believes more (3.84), while the younger ones less (3.46) in the reliability of Hun-garian products. Over 40 years of age, the older the people are, the more they are afraid of a food scandal, while those between 30-39 years of age are the least afraid of one (2.70).
Segmentation of consumers on the basis of lifestyle variables
Lifestyle analysis is a suitable method to reveal and describe those segments easily that can be the primary target group of the meat industry regarding the topics of the research. The authors’ hypothesis was that lifestyle has a signifi cant impact on various attitudes concerning meat prod-ucts. To prove this hypothesis, factor and cluster analyses were used.
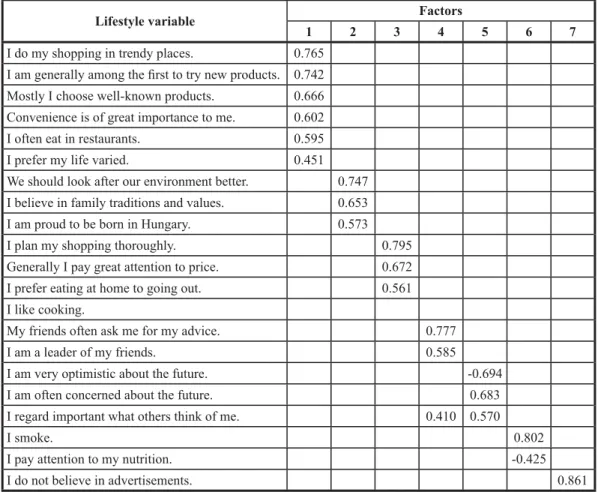
Seven well differentiated factors were defi ned with the factor analysis of 21 lifestyle vari-ables (after varimax rotation). The indicator Kaiser-Meier-Olkin (KMO) is higher than 0.5 (0.750), thus the set of variables is suitable for factor analysis (Komáromi, 1997). The signifi cance of the Bartlett test was 0.000, indicating the independence of the variable pairs. Segmentation gives an answer to the question, that which are those main factors that basically infl uence the consumers’ way of thinking. The results are summarised in Table 9.
Factor number one can be regarded as an ‘innovator type’. Important components of this way of thinking are searching for variety and trying the new products immediately. Consumers belonging here like shopping in famous, trendy places. Besides the functional properties of products bought by these people, reputation and high prestige of the products also have an effect on these consumers. They prefer high quality service, convenience is important for them, which can be seen in their eating habits as well (they frequently go to restaurants). The second factor is the ‘ecologi-cally conscious traditionalist’. In their case, environment protection and family traditions are paid attention to. This manifests in their preference for eco/bio products; if a product meets these expec-tations, they will be much likely to buy it. They are defi nitely proud of being Hungarian and accept advertisements emphasising the Hungarian character of products of domestic origin. Factor three refl ects the way of thinking of the ‘introverted traditionalist’. This type of people avoids social enter-tainment. They prefer to stay at home. They thoroughly plan their shopping, for them price is the most important directing principle. During shopping they try to avoid impulsive decisions, they plan their shopping and choose the cheaper good from the same product category. Factor four includes the ‘opinion-leaders’. These people shape their friends’ opinion; they are often asked for advice and are leaders of the group. This social role is of great importance for them, they are highly concerned about what others think of them. Factor fi ve is the “pessimist”. They have negative views on their future and are usually frustrated. Factor six is the ‘uninvolved’. It is important for them to keep
the conventional nutritional habits, they usually smoke and their behaviour is characterised by risk-taking factors. These people cannot be infl uenced by a ‘healthy food’ message; the main value for them is enjoyment. They are not willing to make any compromise in this issue; they prefer delicious products to healthy ones. Factor seven is the ‘disappointed’. They refuse all types of advertisements and do not believe in them.
Table 9 Rotated factor-matrix of lifestyle variables
Lifestyle variable Factors
1 2 3 4 5 6 7
I do my shopping in trendy places. 0.765 I am generally among the fi rst to try new products. 0.742 Mostly I choose well-known products. 0.666 Convenience is of great importance to me. 0.602
I often eat in restaurants. 0.595
I prefer my life varied. 0.451
We should look after our environment better. 0.747 I believe in family traditions and values. 0.653 I am proud to be born in Hungary. 0.573
I plan my shopping thoroughly. 0.795
Generally I pay great attention to price. 0.672
I prefer eating at home to going out. 0.561
I like cooking.
My friends often ask me for my advice. 0.777
I am a leader of my friends. 0.585
I am very optimistic about the future. -0.694
I am often concerned about the future. 0.683
I regard important what others think of me. 0.410 0.570
I smoke. 0.802
I pay attention to my nutrition. -0.425
I do not believe in advertisements. 0.861
Source: own data
The above defi ned factors may contribute to the defi nition of the direction of marketing strat-egy. For this, however, we also need to know the profi le of the most important lifestyle segments (Grafen and Hails, 2002). Therefore, cluster analysis was carried out in the next step by using the defi ned factors (K-Means Cluster). According to the results of the analysis, fi ve clusters can be iden-tifi ed. They cover 81.4% of the sample. The description of the clusters is as follows.
Aging, introverted consumers (Cluster 1)
Within the whole sample, they represent 17.8%; this is the second biggest cluster. They are typically elderly people with secondary or lower education. They have the lowest income among the
On the basis of their answers given to the lifestyle questions, they pay attention to the envi-ronment and are defi nitely conscious about being Hungarian. Due to their age, they prefer staying at home to going out. Family and family values, as well as relationships, are important for them. They are well organised in shopping; they buy only those products that are on their shopping lists. Price is the most important for them when they choose among alternative products. They like cook-ing which, together with the previous description of this group, suggests that they prefer buycook-ing the ingredients of their food to buying processed meals. They prepare their meals themselves.
For the consumers of this segment the price of pork is rather high which is explained by the disadvantageous income position of the group. This, however, is true not only for pork; these consumers are price and promotion-sensitive in all food categories. They regard pork as a tasty and traditional product, which can be prepared in various ways. The excellent enjoyment value, though, does not always compare to healthiness; according to their opinion pork is an unhealthy product due to its high cholesterol level. On the basis of the characteristics of this group, they are not an attractive target group for the meat industry, although these people can be consumers of low-price products.
Young people with conventional values (Cluster 2)
It is the biggest cluster, with 21.3% within the sample. On the basis of the background vari-ables it is typically a group of young people with at least secondary education. Their fi nancial situa-tion is about the average, although there are people with higher income in the group as well.
Similarly to the fi rst cluster, they are concerned about environment and are proud of being Hungarian. For them family values are very important and they believe in well-working family relations. They like convenience, which manifests in preferring highly processed, ready-to-cook or semi-ready products in the course of their shopping. They pay attention to variability, which indi-cates a lower level of brand loyalty. They prefer famous brands, the image and the social status of the product are the most important for them.
According to this cluster pork has unhealthy properties opposed to the other segments, which infl uences their shopping decisions as well. Agreeing with the previous group, they think that pork has high cholesterol content and fi nd it a basically fatty product. As the members of this cluster rarely cook for themselves (opposed to the previous group), they have no idea about how long pork takes to be prepared and about the different ways of preparation. They can be targeted by the meat industry only if it provides a wide selection of health promoting pork products for them.
Uninvolved, controversial consumers (Cluster 3)
These consumers form the smallest cluster with 9.3% within the whole sample. By their age, they represent both the youngest and the oldest groups of people. They have secondary or lower education; the share of those with elementary education is relatively high. Their fi nancial situation is about average.
On the basis of their answers given to lifestyle questions, this group represents average peo-ple in all terms, giving no defi nite answers to any statements. Their way of looking is neutral, they have no opinions and they are often phlegmatic. They are not proud of being Hungarian. Although variety and price are paid attention to by them, these refl ect discrepancy. Striving for variety assumes risk-taking behaviour, in the background of which there are usually a stable personality, existence and wider knowledge than average. As none of these characteristic features are typical of this group, it can be assumed that looking for variety remains only a plan for them.
The judgement of the group on pork consumption is controversial and basically neutral. These are indicated by the mean values and the standard deviation calculated in the image profi le analysis of pork, just like their unfounded opinion compared to the other clusters’ opinion, which assumes lack of information. This is the group of people which can judge the healthiness, tradition or modernity of pork the least. Due to the inconsistency and low knowledge of these people, it is very diffi cult to develop a strategy to convince them.
Uninvolved consumers (Cluster 4)
This cluster represents 16.0% of the whole sample, taking the last but one place. It is a typi-cal middle-aged group which has secondary school or lower education. Their fi nancial situation is slightly worse than the average.
Their lifestyle refers to environment consciousness, they are proud of being Hungarian. They smoke regularly; their nutrition is instinctive (risk-taking). Health consciousness as a motivating factor is not typical of these people at all. Family traditions are important for them although, com-pared to the other clusters, only moderately.
This cluster considers the price of pork the highest; at the same time they think they are famil-iar with the characteristics of pork. They associate a relatively young image with pork and think it is less unhealthy than the other clusters do. The characteristic features of this segment are similar to the previous one, but with more favourable general opinion on pork. They are a potential target market of the classic, fat-rich (and lower-price) products of the meat industry.
Rational young (Cluster 5)
This cluster represents 17.0% of the whole sample, with the third largest number of people. Predominantly, it comprises young people with at least secondary school education. Their fi nancial situation is around or above the average. This is the group where the proportion of incomes above the average is the highest.
They are more environmental conscious. They like variety, but convenience is also important for them. Typically they buy well-known products, their decision is rational, that is they control their spending and they expect high quality, professional service, and products of high prestige for their money.
Their preferences concerning pork are the most favourable among all of the clusters. They defi ne it as a relatively healthy and reliable product; they prefer its traditional character, as well. Pork is characterised with relatively modern attributes; and its price is acceptable for these people. From among the above introduced clusters, this is obviously the primary target group for the meat industry; effective positioning and communication may certainly lead to success in targeting them.
Conclusions
On the basis of the results obtained it can be stated clearly that the previous leading meat types are still the most preferred and most frequently bought products (poultry, pork, beef). At the same time, though, an obvious shift in consumption can be seen towards white meats, primarily poultry.
It is a general opinion that red meats (especially pork) do not belong to the modern diet, pri-marily due to their high cholesterol and fat content. It seems that poultry gradually gains ground in meat consumption, which basically cannot be compensated by the pig sector. All this has happened
despite the poultry sector globally suffering from avian infl uenza, but this could not undermine the increasing trust of the Hungarian consumers. Thus, the question arises: what factors make the con-sumers have a more favourable judgement on poultry than red meats?
During past years, poultry sector has carried out a very effi cient collective marketing activity. The message of the communication focused on the safety (traceability) and excellent qual-ity of Hungarian poultry, as well as on the slogan ‘Hungarian poultry, Hungarian jobs’. Besides this, the devotees of healthy nutrition started an attack against red meats saying they have to be left out of our diet.
The consumers’ view and image of pork are worse than those of poultry in almost all aspects. Therefore, future marketing research needs to reveal the factors that result in such an unfavourable image of pork that cannot have an impact on the consumption of pork and on the preferences of the consumers. A substantive re-positioning of pork products may not be necessary or only slightly, but rather a psychological re-positioning of the pork products becomes due.
References
1. Bech-Larsen, T., Grunert, K. G. and Poulsen, J. B. (2001): The acceptance of functional foods in Denmark, Finland and the United States. MAPP Working Paper No. 73. The Aarhus School of Business.
2. Brisson, G. J. (1986): Recent advances in animal nutrition. London: London Butterworth. 3. Cheeke, P. R. (1993): Impacts of livestock production on society, diet/health and the
environ-ment. Danville: Interstate Publishers Inc.
4. Éder, T. (2007): Közösségi marketing lehetőségek (és kényszerek) a hústermékek piacán. (Collective marketing possibilities (and pressures) on the market of food products) I. Közösségi Marketing Konferencia. (I. Collective Marketing Conference) Kaposvári Egyetem. (University of Kaposvár) Kaposvár, 2007. október 12.
5. Grafen, A. and Hails, R. (ed.) (2002): Modern statistics for the life sciences. USA: Oxford University Press.
6. HCSO (2008): Az élelmiszer-fogyasztás alakulása 2006-ban. (The trends of food consumption in 2006) Statisztikai Tükör, 2(86): 1-4.
7. Holló, G. (2004): Hagyományos állatfajták húsának zsírsavösszetétele és humán-élettani értékelése (The fatty acid composition of meat from historical animal breeds and its evaluation from human nutritional point of view). Élelmiszer, Táplálkozás és Marketing, 1(1-2): 1-15. 8. Honikel, K. O. and Arneth, W. (1997): A hús és a tojás koleszterintartalma (Cholesterol level
of meat and eggs). A hús, 3.
9. Juhász, P. (2002): Egy hazai húsipari társaság fejlődése és továbblépési lehetőségei az Európai Uniós csatlakozást követően (Development and improvement possibilities of a Hungarian meat company after the EU accession). Biológia alapok az állattenyésztésben (Biological basis in animal husbandry). Budapest, 2002. december 3.
10. Komáromi, N. (1997): A magyar élelmiszerfogyasztók szegmentációja (Segmentation of Hun-garian food consumers). Marketing és Menedzsment, 31(2): 71-73.
11. Malhotra, N. K. (ed.) (2008): Marketingkutatás (Marketing research). Budapest: Akadémiai Könyvkiadó.
12. Moran, E. T. J. R. (1986): Recent advances in animal nutrition. London: London Butterworth. 13. Nábrádi, A. (2007): A minőség szerepe a sertéshúsvertikumban (Role of quality in pork
sec-tor). In: Bittner, B. and Kovács, K. (eds.) (2007): A sertéságazat helyzete, kilátásai és fejlesz-tési lehetőségei – Ágazatspecifi kus innováción alapuló projektek generálása a sertéságazatban (Situation, prospects and advancement possibilities of pork industry – Advancement of projects based on branch specifi c innovation in pork industry). Debrecen: Debreceni Egyetem. (Uni-versity of Debrecen) Agrár- és Műszaki Tudományok Centruma (Center for Agricultural and Technical Sciences).
14. Polereczki, Zs., Huszka, P. and Szakály, Z. (2008): A marketingszemlélet helye a hazai tej- és húsipari kis- és középvállalkozások körében (Place of marketing orientation among Hungar-ian dairy and meat small and medium size companies). 50. Georgikon Napok. (50. Georgikon Days) Keszthely.
15. Polereczki, Zs. and Szakály, Z. (2008): A hazai élelmiszeriparban működő kis- és középvál-lalkozások marketingstratégiáját meghatározó tényezők alakulása napjainkban (Formation of factors defi ning the marketing strategy of small and medium size enterprises in the Hungarian food industry today). Acta Oeconomica Kaposváriensis, 2(1): 1-23.
16. Popp, J. and Potori, N. (eds.) (2009): A főbb állattenyésztési ágazatok helyzete. (Situation of main branches of animal husbandry) Agrárgazdasági Tanulmányok. AKI. Budapest.
17. Szakály, Z., Fülöp, N. and Nábrádi, A. (2008): Fogyasztói attitűdök elemzése a sertéshús és -húskészítmények piacán. (Analysis of consumer attitudes on the market of pork and meat products) In: Bartha, A. and Balogh, V. (eds.) (2008): A sertéságazat versenyképességének javítása (Improvement of the competitiveness of pork industry). Debrecen: Debreceni Egyetem (University of Debrecen). Agrár- és Műszaki Tudományok Centruma (Center for Agricultural and Technical Sciences).
18. Várhegyi, J.-né and Várhegyi, J. (2007): A marhahús megítélése humán egészségügyi szem-pontból. Irodalmi összefoglaló (Judgement of beef from human health view. Review). A hús, 4.