MASTER SCHEDULING OVERVIEW
Manufacturing enterprises — companies that make things — have lots of opportunities to improve and excel. Today, unlike 30 years ago, a wide array of tools and techniques exists to help companies run better: Total Quality, Lean Manufacturing, Supply Chain Management, Enterprise Resource Planning, and so on. There are lots of opportunities for improvement, but it can be confusing trying to sort them out.
Tools for Effectiveness
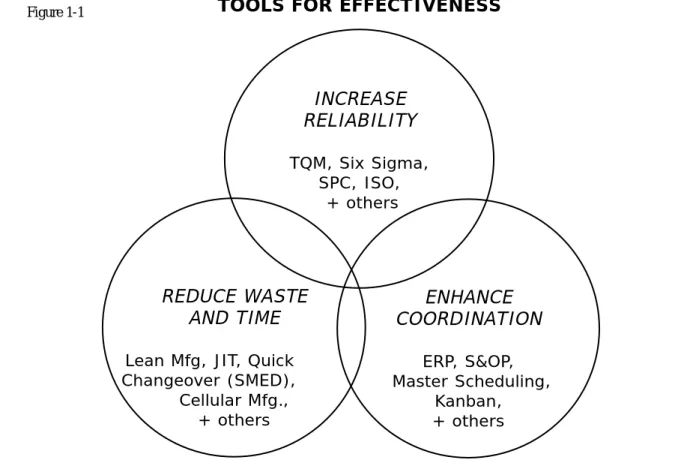
A good way of looking at it is to sort out these processes into three broad categories: tools for increasing reliability, tools for reducing waste, and tools to enhance the coordination of processes and functions, both inside and outside of the company. Then we can identify which specific tools and techniques apply to which category:
Tools to increase reliability: Total Quality Management Six Sigma
Statistical Process Control ISO
and others.
Tools to reduce waste and time: Lean Manufacturing Just-in-Time
Quick Changeover (SMED) Cellular Manufacturing and others.
Tools to enhance coordination: Enterprise Resource Planning Sales & Operations Planning Master Scheduling
Kanban and others.
Now obviously there’s some overlap between categories. For example, better quality processes not only increase reliability but also reduce waste. Lean Manufacturing techniques help to increase reliability along with their job of reducing waste and time.
Effective Master Scheduling processes certainly enhance coordination, as we’ll see. However, they can also reduce waste by helping people make the right products at the right time, thereby avoiding unneeded inventory and obsolescence.
Figure 1-1 displays these concepts graphically.
This view says that Master Scheduling1 is primarily a tool for enhancing coordination. Okay, you
might be thinking, coordinating what? The answer: two things that most of us learned about in Economics 101 — demand and supply.
_______________________________
1Throughout this book, we’ll use the term “Master Schedule” (and “Master Scheduling”). A synonym seen in much of the literature is “Master Production Schedule,” the use of which we will restrict to refer to the row on the Master Schedule grid that contains the future scheduled production.
INCREASE RELIABILITY TQM, Six Sigma, SPC, ISO, + others ENHANCE COORDINATION ERP, S&OP, Master Scheduling, Kanban, + others REDUCE WASTE AND TIME
Lean Mfg, JIT, Quick Changeover (SMED), Cellular Mfg.,
+ others
The Four Fundamentals
One of the most important things a manufacturing enterprise can do is to get demand and supply in balance, and keep them in balance. Balancing demand and supply is essential to running a business well, and this balancing must occur at both the aggregate, volumelevel and at the detailed, mixlevel. We’ve just identified four fundamentals: demand and supply, volume and mix. Let’s look at the first pair.
Demand and Supply
Demand refers to the products that the organization is being asked to provide, expressed in customer orders, sales forecasts, distribution center replenishment, interplant transfers, and so on. Supply refers to the resources available to meet that demand: materials, manpower, machinery, other production capacity, suppliers and their capacity, testing, storage space, and money.
Is it a good thing to have demand and supply in balance? You bet. That’s a happy, harmonious situation. How about when demand and supply are not in balance? Well, that can cause lots of problems. If demand greatly exceeds supply, bad things happen:
•
Customer service suffers. The company can’t ship product to its customers when they want it.•
Customer lead times stretch out as the order backlog builds. Business is lost as customers go elsewhere.•
Costs increase. Unplanned overtime goes up. Premium freight rises as incoming materials and outbound products are expedited. Purchase price variances become unfavorable, as the company pays more to get the materials it needs.•
Quality often “gets lost in the shuffle” as the company strives mightily to get product shipped. Specifications get compromised or waived. Temporary subcontracting yields a less robust product. Material from alternate suppliers often doesn’t process as well.Definitely bad news. Owing to demand exceeding supply, performance deteriorates on three fundamental attributes: cost, quality, and delivery. Business is lost, costs go up, and thus the bottom line takes a hit.
•
Profit margins get squeezed as prices are cut and discounting increases.•
Deals and promotions become more frequent.•
Inventories increase, carrying costs rise, and cash flow can become a problem.•
Production rates are cut. Volume variances become unfavorable.•
Layoffs are a possibility and morale suffers. People in the plant slow down and efficiency numbers start to drop.Well, that’s not good either. Supply exceeds demand and the company is stuck with lower margins, higher costs, a cash crunch, and the possibility of layoffs.
Now, is it always bad if demand and supply aren’t in balance? No, sometimes it can be a good thing. It all depends on where the imbalance lies. For example, if projected future demand exceeds current supply, and if the company can economically add more capacity by the time it’s needed, that’s fine. Demand is growing; business is good. On the other hand, when changes in demand are not anticipated soon enough, that’s when problems arise. Therefore, a process that can predict future imbalances soon enough to rectify them is very important. An sign of success is when an organization is focusing on problems of imbalance some months into the future — and not being consumed with day-to-day crises.
The name of the game is to get demand and supply in balanceand to keep them there. It’s that simple. Balance demand and supply. Have processes in place to do it. Have early warning capabilities to alert people that they’re getting out of sync. Make the corrections early, surgically, so that they can be small — as opposed to making large, radical corrections later with a meat cleaver.
Volume and Mix
The other two fundamentals are volume and mix. The differences between the two can be summed up as follows:
•
Volume refers to groupings, such as product families, production resources, and the like. Mix refers to specific products, items, or customer orders.•
Volume deals with aggregate rates — of sales, production, and so on. Mix is about sequence and timing.•
Volume is the big picture; mix is the details.Now let’s bring together these four elements: demand and supply, volume and mix.
Demand and supply must be balanced at both the volume and the mix levels — or the results will be unhappy customers, layoffs, too much inventory, and on and on. Shipping product to customers with world-class reliability and speed requires that all four of these elements be well managed and controlled.
The Resource Planning Model
Figure 1-2 shows a schematic of what we call Resource Planning. If you’re thinking Enterprise Resource Planning (ERP) or Manufacturing Resource Planning (MRP II) as you read those words, fine. What this represents are tools — business processes — that help people to deal with the four fundamentals: demand and supply, volume and mix. What do the people do with these tools? They make decisions. About what? Keeping demand and supply in balance.
On the diagram, we can see these four fundamentals shown with the specific business process that address each one. For example, the tool to balance demand and supply at the volumelevel is Sales & Operations Planning (S&OP), while Master Scheduling is the process used to balance demand and supply at the mixlevel. We can see that, on the demand side, Forecasting and Demand Management is a primary feeder into both S&OP and Master Scheduling, as is Capacity Planning for supply.
DEMAND
MIX
SUPPLY VOLUME
STRATEGIC PLANNING
BUSINESS PLANNING
VOLUME
SALES & OPERATIONS PLANNING F O R E C A S T I N G & D E M A N D M G M T C A P A C I T Y P L A N N I N G
MIX
MASTER SCHEDULINGPLANT & SUPPLIER SCHEDULING
MATERIAL REQUIREMENTS
PLANNING
E X E C U T I O N
THE RESOURCE PLANNING MODEL
(Manufacturing Resource Planning, Enterprise Resource Planning)
D
E
M
A
N
D
S
U
P
P
L
Y
SalesPlan Production Plan
Important attributes of this Resource Planning approach include the following.
•
It consists of a series of business functions, all linked together.•
It is a “closed-loop” process. Note that the arrows go in both directions. This means that it has two-way communication: There is feedback from the execution step and the more specific planning functions back into the more general.•
It operates in both units and dollars: units for the operational aspects of running the business, dollars for the financial side. The important thing here is that the basic numbersare the same2.This leads people to call this a “single-number system” or “running the business with one set of numbers.”
•
It can be used as a simulator. It’s possible to pose “what-if” questions to this set of tools and to receive understandable answers, in both units and dollars. For example, what if sales were to increase by 20 percent in the Western Region? Could the California plant handle the increased volumes (units) and what would it cost to do so (dollars)? Alternatively, do the plants in both Texas and Indiana have enough capacity to run this volume and what are the cost implications of producing it there and shipping it out west?The dotted line above S&OP is intended to show that Business Planning and Strategic Planning are not components of Resource Planning, but rather are primary drivers into it. Notice, however, that the line connecting Business Planning with Sales & Operations Planning has arrows going in both directions. Sometimes the future visibility provided by S&OP may lead to a decision to modify the Business Plan and perhaps the Strategic Plan.
Professor Dan Marrone of Farmingdale State University (NY) has an good way of describing ERP. Dan says that as one moves down the Resource Planning diagram, “several characteristics emerge:
1. The planning horizon (planning time frame) narrows.
2. The scope of the plans pertaining to organizational functions narrows. 3. Generalized plans are replaced by increasingly detailed, time-sensitive plans.
4. Higher level planning is typically established by higher level managers and lower level, more detailed planning is established andimplemented by managers lower in the management hierarchy.” ______________________________
2Typically this data is kept in units and “translated” into dollars. For example, it’s very practical to “dollarize” the inventory balances and sum them up to get the total valuation of the inventory. You can’t go the other way; you can’t derive the individual item balances from the aggregate dollars.
Please keep in mind: The elements contained within ERP are business processes, not software. There are software packages available to support ERP, and these are correctly referred to not as ERP but rather as Enterprise Software3(ES).
The Role and Structure of Master Scheduling
Master Scheduling is a business process designed to balance demand and supply at the detailed, mix level. Master Scheduling is primarily a decision-making process, performed by an individual called the Master Scheduler. As such, it is people-centered; the computer’s role is to support the people in their decision-making activities.
The output from this process is the Master Production Schedule, which is the anticipated build schedule for specific products (or parts of products) and customer orders. The Master Schedule is:
•
time-phased,•
extends for a number of weeks into the future, and•
is typically expressed in weekly time increments or smaller.Referring back to Figure 1-2, we can see that Master Scheduling is driven mainly by three functions: Sales & Operations Planning, Forecasting/Demand Management, and Capacity Planning — and that it feeds Material Requirements Planning, Supplier Scheduling, and Plant Scheduling4. Let’s look at
each one.
Input: Sales & Operations Planning
As we saw earlier, the mission of Sales & Operations Planning (S&OP) is to balance demand and supply at the aggregate, volume level. It’s a monthly process, operating in both units and dollars, and it involves both executive management and middle management people. S&OP has been called “top management’s handle on the business” because it enables the executive group to determine, ahead of _______________________________
3See Thomas F. Wallace and Michael H. Kremzar, ERP: Making It Happen, 2001, New York: John Wiley & Sons, and Thomas H. Davenport, Mission Critical,2000, Boston MA: Harvard Business School Press.
4The arrows in Figure 1-2 go in both directions, indicating an interplay between the functions. However, the primary flow for Master Scheduling is that its inputs come from Sales & Operations Planning, Forecasting and Demand Management, and Capacity Planning — and its outputs go into the downstream processes.
time, the desired rates of sales and production and the target levels of inventories and order backlogs — and then to manage the business proactively to hit those plans. (For more on Sales & Operations Planning, please see Appendix A.)
S&OP forms a linkage between the Business Plan (the annual financial plan, the budget) and the downstream processes of Master Scheduling, MRP, Supplier Scheduling, and Plant Scheduling. This linkage is vital. When it’s absent, there is a disconnect between the Business Plan (authorized by top management and representing their commitment to the board of directors or the corporate office) and the Master Schedule, which drives activities day-to-day and week-to-week on the shipping dock, the plant floor, and the receiving dock (please see Figure 1-3).
One of the primary outputs from Sales & Operations Planning is the Production Plan or Operations Plan. This represents the levels of production — both internally and outsourced — authorized by top management and designed to meet the forecast, inventory targets, and so on. This Production Plan, therefore, represents the “marching orders” for the Master Scheduler. S/he must insure that the sum of the individual items in the Master Schedule equals the Production Plan, within a few percentage points, plus or minus. To do so closes the loop between the Business Plan and the company’s daily and weekly activities. To do otherwise results in the disconnect, with all of the potential for problems that it implies.
This brings us to our first Master Scheduling principle5:
Principle #1: The Master Schedule must be managed to closely match the volumes in the Production Plan authorized by top management in the Sales & Operations Planning process.
Before we leave this topic, let’s pose a question: What if your company is not doing Sales & Operations Planning, and there are no prospects for that happening soon? What should you do? Well, even though the company isn’t doing S&OP, it does develop a Production Plan. It has to, at least once per year, in the annual budgeting cycle. Start with that. Update it as you go through the year. So, when we mention Sales & Operations Planning throughout the book, recognize that you don’t have that yet, but you’re doing the best you can.
_______________________________
STRATEGIC PLANNING BUSINESS PLANNING
DISCONNECT ! ! !
F O R E C A S T I N G & D E M A N D M G M T C A P A C I T Y P L A N N I N G MASTER SCHEDULINGPLANT & SUPPLIER SCHEDULING
MATERIAL REQUIREMENTS
PLANNING
Input: Forecasting and Demand Management
Demand, of course, is a primary input to Master Scheduling, and it’s expressed in a variety of forms: Customer orders Customer schedules Customer commitments Quotes to customers Sales forecasts Promotions
Distribution center replenishment Samples
Intra-company demand: plant-to-plant, family-to-family, division-to-division,
and so forth.
In order for Master Scheduling to do its job well, it must have visibility into all of these types of demands. A Master Schedule with less than 100 percent of all demands will miss something, and that means that some items will probably not be built on time. This will often create a difficult situation, with scrambling, expediting, disruptions to production and/or purchasing, and disappointed customers — either external customers, or internal, or both.
Here’s our next principle:
Principle #2: The Master Schedule must have visibility into all known demands, from both the external customers and also the internal customers.
Demand Management is the function that insures that all of these demands are in the formal business system and visible to the Master Scheduler. In many companies, the position of Demand Manager has been created to address this and other related issues. For more on this, please see Appendix C. There’s a bit of a paradox here: While it’s true that these demands are vital inputs to Master Scheduling, it’s also the case that Master Scheduling has a key role in the Demand Management function. For example, the promising of customer orders should happen in the Master Schedule — although normally not by the Master Scheduler but rather by the people in Customer Order Entry. The techniques known as Available-to-Promise and Capable-to-Promise have proven to be powerful tools in promising customer orders with high degrees of validity. More on these in Chapter 5.
Input: Capacity Planning — Validating the MPS
The objective of Master Scheduling is to balance demand and supply at the mix level, and it’s Capacity Planning that addresses the supply side of the picture. It entails “translating” schedules for products and components into workload in order to identify future problems. There’s an old maxim: You can’t put ten pounds of potatoes in a five pound bag, and that’s the reason why Capacity Planning exists. It serves as a check to determine whether the schedule is “producible” — whether there’s enough capacity to do it in the time available.
Typically the Master Schedule is expressed in units, pounds, gallons, and so forth — as in “400 units of Product 13579 in Week 4” — and the capacity plans are stated in hours by producing resource. An example might be “2,000 standard hours of workload in Department B in Week 4.” This would include the workload for Product 13579 plus all of the other products that are processed in Department B.
Let’s say that Department B has the capacity to produce 1,000 standard hours of workload per week. But, in our example, the Master Schedule is generating a workload of 2,000 hours — and that qualifies as ten pounds in a five pound bag. Thus the Master Schedule, as it now stands, cannot be produced unless some changes are made. Possibilities include:
•
Increase the capacity in Department B to 2000 standard hours of workload per week.•
Assign some of the work in Week 4 to another resource, say Department D or possibly an outside processor.•
Change the Master Schedule so that some of the production scheduled for Week 4 is made in a different week.•
All, or several, of the above.Master Scheduling without Capacity Planning is like trying to fly a plane with only one wing: It’ll crash. When the Capacity Planning process is not done, then the Master Schedule quickly loses validity and believability. The people in the plant quickly learn that the schedules really can’t be made, and thus they’re meaningless. In cases like this, frequently the plant will make whatever it can, without a clear view of what the customers are really asking for. The result is frustration, finger pointing, massive expediting, inefficiencies, and — last, but certainly not least –— late shipments and unhappy customers.
With a good Capacity Planning process — and the discipline not to change the MPS for trivial reasons — the Master Schedule can be kept valid; it represents a plan that is producible, that the plants can buy into, and that helps to get the product to the customers when they’re asking for it. Don’t leave home without it.
We’ll look at Capacity Planning in much more detail in Chapter 6.
Outputs from Master Scheduling
Master Scheduling impacts a number of functions. Let’s look briefly at each one, and while we’re doing that, you may want to refer back to Figure 1-2, the Resource Planning Model, on page 6.
•
Demand Management. The Master Schedule is the source of customer order promising and thus there’s a strong connection between it and the Demand Management function. The inventory levels, future production, and existing commitments to customers contained in the Master Schedule show the people in Customer Order Entry the feasibility of promising incoming orders for specific products, quantities, and ship dates.•
Material Requirements Planning. The start dates for producing products, as specified in the Master Schedule, become “need dates” for the components and raw materials required to make the products. MRP calculates when more of these items will be needed, and how much — and then alerts the appropriate people.•
Plant Scheduling. The Master Schedule is typically expressed in daily or weekly time periods, and specifies when products need to be started and completed. In most plants, more detail is needed: what time of day — or what shift — to start various jobs, what to run in what sequence, when to take changeovers, what jobs to run on which machines, and so forth. This is known by several interchangeable terms — Plant Schedule, the Finishing Schedule, or the Final Assembly Schedule — and it shows a greater level of detail than the Master Schedule.•
Supplier Scheduling. The Supplier Scheduling process represents a departure from the traditional approach of preparing purchase requisitions, purchase orders, change orders, and so on. It involves providing the suppliers with time-phased schedules of what will be needed and when.6•
Financial Planning. Master Scheduling uses data in units — each, thousands, gallons, liters, pounds, whatever. As we’ll see, it needs lots of data: forecasts, customer orders, inventory balances, inventory projections, production schedules, and more. Remember, as we saw earlier, it’s possible to translate these operational numbers into financial terms, to be used for financial planning. This can yield very solid dollarized projections of future shipments, finished goods inventory levels, production volumes, and much more.We’ll have a lot more to say on each of these topics in later chapters.
Supply Chain Management and the Master Schedule
The question arises: What is the role of Master Scheduling in Supply Chain Management? Is it major, minor, or non-existent? Answer: major. Master Scheduling helps to blur the boundaries between customers and suppliers; it enhances the cross-boundary collaboration inherent in Supply Chain Management.
The Master Schedule sits at the heartof the Supply Chain. As shown in Figure 1- 4, it reaches upward and touches the customers; it reaches downward and touches the suppliers. Master Scheduling is not an “inside-only” activity, coordinating the plants and not much else. Rather, it is central to communicating across company boundaries.
We’ll be touching the Supply Chain base frequently as we move through the book. _______________________________
6For purchased components and materials, the direct input into Supplier Scheduling is MRP (thus only indirectly from the Master Schedule). However, for purchased finished products, Supplier Scheduling gets its input directly from the Master Schedule, in much the same way as the Plant Scheduling function.
STRATEGIC PLANNING
BUSINESS PLANNING
VOLUME
SALES & OPERATIONS PLANNING C A P A C I T Y P L A N N I N G F O R E C A S T I N G & D E M A N D M G M T
MIX
MASTER SCHEDULING MATERIAL REQUIREMENTS PLANNINGENTERPRISE RESOURCE PLANNING
& THE SUPPLY CHAIN
D
E
M
A
N
D
S
U
P
P
L
Y
Figure 1-4UP THE SUPPLY CHAIN TO: END CONSUMERS CUSTOMERS
DISTRIBUTION CTRS SISTER PLANTS
DOWN THE SUPPLY CHAIN TO: PLANTS
SISTER PLANTS
CONTRACT MANUFACTURERS SUPPLIERS
Lean Manufacturing and the Master Schedule
Managing the Supply Chain is getting simpler. Isn’t that good news!? And doesn’t it sound contradictory? The world seems to be getting more complicated, what with speedy communications, very high technology, and the rest. How can it be that this part of the world is going in the opposite direction? To get at the answer, we’ll need to look back into history.
The process of managing the Supply Chain has evolved steadily over the last quarter century. This is because both the purchasing/manufacturing/logistics environment and the tools to manage that environment have changed significantly.
These changes have been brought about in large measure by developments in the competitive environment. Until the mid-1960s, our economy was largely based on a supply driven mindset: Produce as much as you can, as fast as you can, and worry about selling it later. Not much attention was given to reliable manufacturing processes, high quality, or short lead times. The manufacturing climate — with its emphasis on mass production — involved long production runs, infrequent changeovers, and frenzied activity at the end of each month to hit the monthly shipping target. Thankfully, most companies don’t do it that way anymore, due mostly to the wonderful methodology called Lean Manufacturing (and its predecessor, Just-in-Time). Lean Manufacturing says:
•
simplify the environment,•
eliminate non-value-adding activities,•
create flow7,•
make just what you need, and•
reduce lead times.These approaches, coupled with today’s very effective quality enhancement tools, have resulted in not just an evolution but a revolution in the manufacturing world.
However, there’s a problem here: Master Scheduling was developed prior to the onset of Just-in-Time, Lean Manufacturing, and Total Quality. Therefore, it had to deal with the inherent complexity _______________________________
in the old style manufacturing world. Some parts of Master Scheduling simply aren’t necessary in the lean, simplified operations that exist in many companies today.
In Figure 1-5, we trace this evolution. In the old days — the “Dark Ages” of the 1960s and earlier — there was a gap: we had complex environments but no good tools with which to coordinate them. (It’s a wonder anything ever got shipped.)
The second stage in this evolution shows the development of the coordination tools, including Master
Scheduling, with a substantial improvement in results. Next, the third stage was the simplification of the operating environment in many companies, but,most of them did not change how they did Master Scheduling. This is the second gap: Master Scheduling often was more complex and full-blown than the environment required.
As Master Scheduling became more streamlined to mirror the operating environment, the gaps went away. Very good things began to happen. Today most companies don’t experience the first gap: complex environment and poor tools. But many companies do experience the second gap — the complex tools they have are more than what’s needed in the simplified environment they’ve created.
Figure 1-5
SIMPLIFICATION OF THE OPERATING ENVIRONMENT AND COORDINATION TOOLS
Operating Master Scheduling and Other
Time Environment Coordination Tools Results 1960s Complex • Informal — launch & expedite • Mediocre
Complex • Effective but necessarily complex • Good Simplified • Effective but unnecessarily complex • Very Good Simplified • Simplified • Excellent Today/Future Agile/High Response • Very simplified • Outstanding
How does this come about? Several factors play a part in it:
•
Software suppliers are under substantial pressure to include in their products very high degrees of functionality. All the bells and whistles, so to speak, are in most of the packages — and many of them are overkill.•
Companies develop a kind of “technological imperative” mindset when installing the software: “These features are in the software; therefore we must use them.” Thus they select features in the software that they don’t need. Tom Heldt, who is in Industrial Marketing with Dow Chemical, says it succinctly: “Complex software can screw up a simple concept like Master Scheduling.” This second gap can put a company at a competitive disadvantage, much as did the first gap. This evolution is shown in Figure 1-6. A company may be at any point along the continuum, and maintain a highly competitive posture. It depends on where the competition is. All companies should be moving to the right, though, in both environment and in appropriate tools. A serious problem occurs when there is a gap of either type, tools that are either functionally incomplete or overly complex.Tools vs. Environment
SimpleTime
Past Future Old Gap New Gap Tools Environment Figure 1-6 ComplexWe’ve written this book with the above mentioned circumstances in mind. We’ll first discuss the basics and fundamentals that must be present, regardless of how they’re applied. At times we’ll focus on the adaption of these tools to a complex environment, and at other times to their use in a simple environment.
Our intent here is to help you recognize whether you have a gap and if so, which kind it is. Once you eliminate that gap, you’ll get better and better at running your business. All of which leads us to:
Principle #3: As the operational environment becomes leaner and simpler, the way in which Master Scheduling is used should become simpler also.
Coming up in the next chapter is a discussion of the most important people in the Master Scheduling arena — the customers.