WP # 0098ACC-427-2009
Date June 29, 2009
THE UNIVERSITY OF TEXAS AT SAN ANTONIO, COLLEGE OF BUSINESS
Working Paper
SERIES
ONE UTSA CIRCLE
SAN ANTONIO, TEXAS 78249-0631
210 458-4317 | BUSINESS.UTSA.EDU
Copyright © 2009, by the author(s). Please do not quote, cite, or reproduce without permission from the author(s).
Jeff P. Boone
Department of Accounting
College of Business
University of Texas at San Antonio
Inder K. Khurana
School of Accountancy
University of Missouri-Columbia
K. K. Raman
Department of Accounting
University of North Texas
Jeff P. Boone Department of Accounting College of Business Administration University of Texas at San Antonio
[email protected] Inder K. Khurana School of Accountancy University of Missouri-Columbia Columbia, MO 65211 573/882-3474 [email protected] K. K. Raman*** Department of Accounting College of Business Administration
University of North Texas P. O. Box 305219 Denton, TX 76203
940/565-3089
***Authors’ names are listed alphabetically. Partial funding provided by The University of Texas at San Antonio College of Business.
IS AUDIT QUALITY DIFFERENT FOR BIG 4 AND MID-TIER AUDITORS?
Abstract
Prior research suggests that Big 4 auditors provide higher quality audits by virtue of their large size. Still, the recent reforms mandated by the Sarbanes Oxley Act– by increasing client and auditor incentives for accurate reporting – may have narrowed audit quality differences across auditor groups. In this paper, we examine audit quality for Big 4 and Mid-tier auditors during 2003-06 and include clients of other smaller audit firms for comparison purposes. We examine actual audit quality (as proxied by earnings
management metrics) as well as perceived audit quality (as proxied by the client- and year-specific
e-loading and ex ante equity risk premium metrics).
We include in our analysis only those Big 4 clients for whom the Mid-tier firms are potentially viable as auditors. Relative to other smaller audit firm clients, we find Big 4 and Mid-tier audit clients to have (1) lower levels of accrual management, (2) higher levels of real earnings management, and (3) higher levels of investor-perceived accruals quality. In each case, we were unable to reject the null that
Big 4 and Mid-tier audits are similar. However, we find Big 4 audit clients to have a lower client-specific
ex ante equity risk premium relative to both Mid-tier and other smaller audit firm clients. Collectively, our findings indicate that in situations where a Mid-tier auditor is potentially viable, Big 4 clients could utilize a Mid-tier firm without adversely affecting audit quality. Still, the results suggest that Big 4 clients have a lower ex ante cost of equity capital which is likely related to the insurance considerations (“deep pockets”) – rather than the audit quality -- associated with having a Big 4 auditor.
1. INTRODUCTION
In this paper, we investigate audit quality differentials across different auditor categories during 2003-06.1 Specifically, we address two research questions. First, we examine whether “accrual-based” earnings management (as measured by the absolute value of asset-deflated performance-adjusted abnormal accruals) and “real activity-based” earnings management (as measured by a composite metric based on asset-deflated abnormal operating cash flows, abnormal production costs, and abnormal discretionary expenses) for Big 4 audit clients is different from that of Mid-tier audit firm clients.2
Second, we examine whether investors perceive Big 4 and Mid-tier audit quality to be different as reflected in the client- and year-specific loading on the information (accruals) quality factor in an augmented Fama-French three-factor model (i.e., the e-loading metric discussed by Ecker et al. 2006), and in the ex ante equity risk premium. Collectively, our two research questions address the actual as
well as perceived audit quality of Big 4 and Mid-tier auditors.
Prior research has largely focused on the divide between Big 4 and non-Big 4 auditors as the basis for differential audit quality.3 Simunic and Stein (1987) suggest that having spent heavily on building their brand names, the Big 4 have an incentive to protect their reputations by providing more credible financial reports. Becker et al. (1998) and Francis et al. (1999) link audit quality to earnings management, and suggest that Big 4 auditors are more effective at restraining earnings manipulations. They indicate that the net result of a Big 4 audit is lower abnormal accruals, i.e., reported earnings that are
1 Essentially, we examine audit quality differentials since the passage of the Sarbanes Oxley Act in 2002. We focus on the 2003-06 time period to avoid the potentially confounding effects of various events (such as the stock market collapse, the various accounting scandals including Enron and WorldCom, and the criminal conviction of Arthur Andersen) during 2002.
2 The Big 4 consists of PwC, Deloitte & Touche, Ernst & Young, and KPMG. We ranked all US audit firms in 2006 by market share, i.e., the totals of their audit clients’ assets or revenues. Either approach to measuring market share provided similar rankings. For the purpose of this study, we classify the fifth through the eighth largest audit firms (Grant Thornton, BDO Seidman, Crowe Chizek, and McGladrey Pullen) as Mid-tier auditors. We categorize auditors who are neither Big 4 nor Mid-tier as other smaller auditors.
3 For convenience, we use the term Big 4 to denote not only the extant four largest audit firms but also their predecessor firms which prior to their merger (or demise, in the case of Arthur Andersen) were referred to previously as the Big 8, Big 6, or Big 5.
more reflective of the client’s underlying economics.4 These findings are consistent with the notion (articulated by DeAngelo 1981) that audit firm size is an innate determinant of audit quality. Specifically, the argument is that the Big 4’s large size (1) enables them to spend heavily on training and audit technology (thereby contributing to their competence), and (2) makes them less dependent on an individual client, and thus better able to resist client pressure and restrain earnings management.
Still, the recent experience with Arthur Andersen suggests that it may no longer be valid to view audit firm size as an innate determinant of audit quality. Further, at this time, there may be reasons to expect Big 4 and Mid-tier audit quality to be similar. Specifically, Nelson (2006) indicates that reforms mandated by the 2002 Sarbanes Oxley Act (SOX) have increased both client and auditor incentives for accurate financial reporting. In particular, the reforms apply to all registered audit firms and clients (at least initially) with annual revenues in excess of $75 million.
With respect to client incentives for more accurate reporting, SOX’s Section 302 requires
CEOs/CFOs to certify that internal controls are effective and that the financial statements present fairly the firm’s financial position and results. Further, CEOs/CFOs now face a variety of severe financial, criminal, and civil penalties in the event that their certifications are later proved incorrect. Thus, managers are now responsible for fair presentation (which goes beyond mere technical GAAP compliance) and can be visibly penalized for violations (Kinney 2005). Nelson (2006) suggests that these new requirements and penalties for CEOs/CFOs make it less likely that the client will misstate the
financial statements, or pressure the auditor to allow aggressive earnings management. 5
With respect to auditor incentives, SOX’s Section 104 created the PCAOB and an ongoing
program of quality inspections of audit firms. The PCAOB has broad investigative and disciplinary powers, and is required to conduct inspections of audit firms. Palmrose (2006) notes that closer monitoring (by the PCAOB) is likely to induce auditors to increase audit effort, tighten materiality, and
4 Consistent with this view, Teoh and Wong (1993) document that the earnings surprises of Big 4 audit clients are valued more highly by the stock market, which is consistent with the notion that the perceived quality of reported earnings is higher when the auditor is a Big 4 firm. However, Ghosh and Moon (2005, p. 598) report that during 1990-2000 the ERC was lower for Big 4 clients which is inconsistent with Teoh and Wong (1993).
make more conservative judgments and decisions in their audit engagements. Further, SOX Sections 104 and 404 require auditors to do more in terms of testing the control system and attesting to the accuracy of CEO/CFO certifications of the effectiveness of internal controls over financial reporting. Nelson (2006) suggests that these and other SOX-mandated reforms (such as independent audit committees and audit partner rotation) and the continuing threat of PCAOB annual inspections and sanctions, make it more
likely that the auditor will detect financial statement misstatements and resist client pressure to allow opportunistic reporting.
Thus, the cumulative effect of the reforms – in terms of (1) less aggressive reporting by the client,
(2) less client pressure to waive corrections to the misstatements, (3) increased auditor effort to identify
misstatements, and (4) greater auditor resistance to client pressure to allow aggressive reporting – may be
expected to narrow audit quality differences across auditor groups.
Still, the SOX-mandated reforms cannot realistically be expected to eliminate audit quality differences. Basically, these differences are likely to persist to the extent that auditors vary in their ability and willingness to “pushback” against client-driven earnings management. As a practical matter, accrual accounting allows preparers considerable discretion in estimating the future cash flow consequences associated with current period transactions and events. Put differently, accounting flexibility inherently allows earnings to be “managed” based on varying assumptions about an uncertain future. Thus, whether Big 4 and Mid-tier audit quality is different remains ultimately an empirical question.
In our study, we recognize that not all Big 4 clients are auditable by Mid-tier auditors.6 Hence, in examining our two research questions, we “trim” our sample to include only those Big 4 clients for whom the Mid-tier firms are potentially viable as auditors. Specifically, we exclude Big 4 clients whose revenues exceed the revenues of the largest Mid-tier client in each of the four years.7
6 The GAO (2008) notes that the very largest Big 4 clients have global businesses and complex operations that the Mid-tier firms may not have the capacity to audit due to their lack of geographical reach and the necessary depth in staff resources and technical expertise.
7 For completeness, we also analyzed the “full” sample which includes all Big 4 clients. The results for the “full” sample were similar to those reported in the paper for the trimmed sample.
Our results indicate that both Big 4 and Mid-tier audit clients have lower levels of absolute
performance-adjusted abnormal accruals relative to other smaller audit firm clients during 2003-06. More importantly, the levels of these abnormal accruals for Big 4 audit clients are no different than those for Mid-tier audit clients, suggesting that audit quality (as measured by clients’ abnormal accruals) is similar for Big 4 and Mid-tier auditors.
By contrast, for real earnings management, we find the composite metric (based on asset-deflated abnormal operating cash flows, abnormal production costs, and abnormal discretionary expenses) to be higher for both Big 4 and Mid-tier clients relative to other smaller audit firm clients, suggesting that Big 4 and Mid-tier audit quality is potentially lower than that of the other smaller audit firms. As noted by Graham et al. (2005), real methods are more opaque and thus harder to detect.8 Graham et al. (2005) also suggest that auditors are less likely to second-guess real economic decisions since these decisions are largely a matter of business (rather than accounting) judgment. Thus, in comparison to accrual management, real earnings management is less likely to face auditor scrutiny. For these reasons, managers may substitute real earnings management for accrual management. In any event, we find the composite metric for Big 4 audit clients to be no different than that for Mid-tier clients, suggesting that real earnings management is similar for Big 4 and Mid-tier audit clients.
With respect to our second research question, i.e., whether investors perceive Big 4 and Mid-tier
audit quality to be different, we find that investors perceive both Big 4 and Mid-tier audits to be of higher quality (as reflected in the client-specific loading on the information quality factor) relative to other smaller firm audits. Further, we find the e-loading metric for Big 4 audit clients to be no different than that of tier audit clients, suggesting that investor-perceived audit quality is similar for Big 4 and Mid-tier auditors. This finding is consistent with our earlier result -- from a preparer perspective -- that the level of abnormal accruals is similar for Big 4 and Mid-tier clients.
By contrast, we find the client-specific ex ante equity risk premium metric to be lower for Big 4
clients relative to that of both Mid-tier and other smaller audit firm clients. Further, we find the equity
8 As an example, investors may find it hard to discriminate between real earnings management and normal cost-cutting activities intended to improve operating efficiency.
risk premium to be similar for Mid-tier and other smaller audit firm clients. Prior research (Khurana and Raman 2004) suggests that differentials in the ex ante cost of equity capital across Big 4 and non-Big 4 clients is driven by litigation risk and insurance benefits (i.e., the “deep pockets” of Big 4 auditors) rather than by auditor reputation for audit quality. Consistent with this view, the GAO (2008) indicates that investment bankers and institutional investors are motivated by insurance reasons to prefer Big 4 auditors for their own clients and investees. Put differently, underwriters and investors prefer Big 4 auditors primarily for their financial resources (“deep pockets”) and resulting ability to share more of the settlement costs and losses in the event the deal falters or the client fails.
Overall, our evidence on audit quality differentials across auditor groups adds to the literature on audit quality and auditor concentration. In recent years, regulators have focused on auditor concentration and the risks posed by Big 4 dominance of the audit market (Paulson 2007; Solomon 2007).9 The two commonly provided explanations for the Big 4’s market dominance are: (1) their geographic reach and depth of expertise which makes them indispensable to their very largest clients (GAO 2003, 2008), and (2) their brand name reputation for higher audit quality (Simunic and Stein 1987). An implication of our finding that accrual-based earnings management, real-activity based earnings management, and investor perception of information quality are all similar for Big 4 and Mid-tier auditors is that in situations where a Mid-tier auditor is potentially viable, Big 4 clients could utilize a Mid-tier firm as auditor -- and thereby reduce Big 4 market dominance and auditor concentration -- without adversely affecting audit quality.
Since the collapse of Arthur Andersen in 2002, regulators have been concerned about the potential loss of yet another one of the Big 4 firms (due, for example, to catastrophic legal claims), and the likely severe repercussions for auditor competition and auditor choice for audit clients (Committee on Capital Market Regulation 2006; US Chamber of Commerce 2006, 2007). At this time, regulators appear to view the Big 4 as potentially “too few to let any fail” (Johnson 2007, D1).10 Thus, recent initiatives
9 As pointed out by the GAO (2003), the Big 4 audit 78 percent of all publicly owned US companies. “Is this intense concentration in the market for large public company auditing services good for America? If you believe, as I do, that genuine competition is essential to the proper functioning of any market, then the answer is no,” (Cox 2005, p. 3).
10 The US Chamber of Commerce (2006, p. 5) quotes William McDonough, a former PCAOB chair, as stating that “None of us (regulators) has a clue what to do if one of the Big 4 failed.” Reilly (2007) suggests that in 2005
have sought to place limits on auditor liability in order to avoid a possible liability-induced bankruptcy of a Big 4 firm (The American Assembly 2005; Committee on Capital Market Regulation 2006; Johnson 2007; Reilly 2006a, 2006b).11 In this study, we document that Big 4 clients enjoy a lower cost of equity capital than Mid-Tier clients, a finding consistent with investment bankers’ and institutional investors’ preference for Big 4 auditors (for their own clients and investees) primarily for insurance reasons, i.e., possible access to the Big 4’s “deep pockets” in the event of failure (GAO 2008, p. 44). Potentially, any cap on the legal liability of the Big 4 could limit the insurance-based attractiveness of these auditors. In turn, this may induce more clients to take a “fresh look” at Mid-tier auditors as a viable alternative to the Big 4. Thus, an unintended consequence of litigation reform, i.e., a cap on the liability of Big 4 auditors, could be a decrease in auditor concentration as more clients find greater acceptance among their bankers and institutional investors for Mid-tier auditors.12
The rest of the paper proceeds as follows: Section 2 describes and develops our hypotheses. Section 3 discusses our methodology and sample. The empirical findings are reported in Section 4, and Section 5 concludes the paper.
2. HYPOTHESES
2.1 Audit Quality from a Preparer Perspective (Earnings Management Model)
As noted previously, prior research has sought to link audit quality to earnings management. In other words, given managers’ incentives to manipulate reported earnings in order to meet or beat earnings benchmarks (Bartov et al. 2002; Graham et al. 2005), the auditor’s role is viewed as one of lending
federal prosecutors were reluctant to press criminal charges over tax shelters sold by KPMG since such an indictment would have effectively been a death sentence for the firm by irreparably damaging its reputation. Thus, rather than press a criminal indictment, the government offered KPMG a deferred-prosecution arrangement and settled for a fine of $456 million.
11 In the US, these suggestions basically involve arrangements whereby auditors with satisfactory quality control would be provided a measure of protection from legal liability by the SEC and the PCAOB (The American Assembly 2003; US Chamber of Commerce 2006, 2007; Committee on Capital Market Regulation 2006). In the UK and the EU, the suggestion is that auditors be allowed to reach agreements with their audits clients (with shareholder approval) on liability caps (Buck 2006; Buck and Jopson 2006; Michaels and Parker 2004).
12 Prior research (Lee and Mande 2003), suggests that a reduced level of legal exposure for Big 4 auditors could lower their incentives to maintain audit quality by increasing their acquiescence in earnings management by audit clients. However, as discussed previously, the evidence suggests that Big 4 audit quality is no better than Mid-tier audit quality during 2003-06.
credibility to financial statements by restraining earnings management. Consistent with this view, Becker et al. (1998) and Francis et al. (1999) report lower abnormal accruals for Big 4 clients than for non-Big 4 audit clients.13
Separately, Graham et al. (2005) suggest that given the stigma associated with accrual management, earnings manipulations are now more likely to be achieved through “real” economic actions (such as cutting discretionary expenses). In particular, they suggest that managers believe that in attempting to meet or beat earnings targets, auditors are more likely to challenge accounting judgments but less likely to second-guess real economic decisions. Further, there is also the fear that an overzealous regulator may conclude ex post, and with the benefit of hindsight, that an appropriate accounting treatment at the time was actually driven by an attempt to manage earnings (Graham et al. 2005, p. 36). Consistent with these arguments, Cohen et al. (2008) document a decline in accrual management and a rise in real earnings management.
To the extent that real earnings management detracts from fair reporting (i.e., disguises the client’s underlying economic performance) and is used as a substitute for accrual management, audit quality could potentially be judged by the auditor’s ability to restrain both forms of earnings management. However, as noted previously, real earnings management methods are more opaque and harder to detect, and the underlying real economic decisions could be perceived as based on business (rather than accounting) judgment and thus less likely to be questioned by the auditor. Put differently, auditors may believe that they do not have the ability or the responsibility to restrain real earnings management. Still, for the sake of completeness, in our study we examine both accrual management and real earnings management metrics. Our first set of hypotheses (stated in the null form) are as follows:
H1a: Earnings management for Big 4 clients is not different from that of other smaller audit firm clients.
H1b: Earnings management for Mid-tier clients is not different from that of other smaller audit firm clients.
H1c: Earnings management for Big 4 clients is not different from that of Mid-tier audit clients.
13 In additional analysis, Francis et al. (1999) partition their sample into three auditor groups (Big 4, second-tier national firms, and other audit firms) during 1988-1994, and find significant differences in accrual management across all three auditor groups.
2.2 Audit Quality from an Investor Perspective (E-loading Model)
As noted by Dopuch and Simunic (1982), the higher the perceived quality of the audit, the more credible the client’s reported earnings “as judged by users” (p. 407). In turn, more credible earnings may be expected to be associated with higher information quality, i.e., increased likelihood that the reported earnings map well with the client’s underlying economic performance. Consistent with recent research (e.g., Aboody et al. 2005; Ecker et al. 2006; Chen et al. 2007), we utilize the e-loading metric as a market-based representation of investor-perceived information quality.14
In recent research, Bhattacharya et al. (2003, pp. 643-644) argue that although investors in an efficient market can rationally anticipate earnings management, they cannot “see through” it, i.e., they cannot undo the effects of earnings manipulations to arrive at the underlying (but unobservable) economic earnings number. In other words, information asymmetry persists. Further, the information asymmetry
created by earnings management is not completely resolved through other communication mechanisms such as disclosures. For these reasons, earnings manipulations can be expected to lower information quality for investors.
In our study, we examine whether the three auditor groups (Big 4, Mid-tier, and other) are perceived by investors as being associated with differential information quality for their audit clients. To the extent that investors are cognizant of the linkage between audit quality and earnings management, the three auditor groups’ clients may be expected to be associated with differentials in their investor-perceived information quality as proxied by the e-loading metric. Thus, we examine the differentials in clients’ e-loading metric across the three auditor groups during the 2003-06 time period.
Our second set of hypotheses (stated in the null form) are as follows:
H2a: The e-loading metric for Big 4 clients is not different from that of other smaller audit firm clients.
H2b: The e-loading metric for Mid-tier clients is not different from that of other smaller audit firm clients.
H2c: The e-loading metric for Big 4 clients is not different from that of Mid-tier clients.
14 Whether information quality is a priced risk factor remains controversial (Core et al. 2008; Francis et al. 2008, fn. 9). In this section, we do not take a position on this issue.
2.3 Audit Quality from an Investor Perspective (Ex Ante Equity Risk Premium Model)
Traditional asset-pricing theory takes the position that information quality is diversifiable and should not affect expected returns. More recently, Lambert et al. (2007) suggest that although accounting information quality may not be an independent risk factor, it can affect the cost of equity capital because higher information quality reduces a firm’s beta by dampening the conditional covariance of the firm’s cash flows with the market. They indicate that this effect on the assessed covariance of the firm’s cash flows is not diversifiable and is thus priced.
Consistent with the theory of Lambert et al. (2007), empirical work presents evidence that information quality matters for expected returns. Both Francis et al. (2005) and Core et al. (2008) find accrual quality to be priced in the ex ante cost of equity capital. Other research (e.g., Botosan 1997; Botosan and Plumlee 2002; Bhattacharya et al. 2003) also shows that firms with lower information quality exhibit a higher cost of equity financing.
Stein (1989) argues that investors rationally expect earnings management, but cannot completely undo its effects, and therefore price the expected earnings manipulation. Given this pricing behavior, i.e., the fact that rational investors anticipate and price earnings manipulation, it is optimal for managers to manage earnings. Put differently, managers may be expected to continue to manage earnings even when investors cannot be systematically fooled (Stein 1989, p. 668).15 Consistent with the notion of rational investors, Bhattacharya et al. (2003), Core et al. (2008), Francis et al. (2005) show that lower earnings quality is priced by investors in a higher cost of equity capital for the firm.
To the extent that investors are cognizant of the linkage between audit quality and earnings management, the three auditor groups (Big 4, Mid-tier, and other) may be expected to be associated with differentials in perceived information quality for their audit clients, and differentials in the client-specific ex ante equity risk premium. Stated differently, investors may rationally expect differentials in earnings management across the three auditor groups, and to the extent that they cannot undo (or diversify away)
15 Similarly, Graham et al. (2005) suggest that investors are rational and assume (and price the notion) that companies manage earnings. Consequently, they suggest that it is rational for managers to manage earnings to meet or beat earnings benchmarks particularly to avoid the severe negative stock price reaction typically associated with an earnings disappointment.
the adverse effects of increased earnings management for individual clients, they may be expected to respond with price protection by demanding differentials in the expected returns going forward, e.g., a
higher ex ante equity risk premium for accepting lower information quality, and vice versa.16
However, as noted previously, prior research (Khurana and Raman 2004) suggests that differentials in the client-specific equity risk premium across auditor groups may be driven not by differentials in perceived information quality but by litigation risk and insurance considerations, i.e., the “deep pockets” of Big 4 auditors. Potentially, these insurance-related considerations may outweigh information quality differences in the pricing of the client-specific ex ante equity risk premium across auditor groups.
Because of these conflicting arguments, the relation between auditor group and the client-specific equity risk premium remains an open and unanswered empirical question. Our third set of hypotheses (stated in the null form) are as follows:
H3a: The ex ante equity risk premium for Big 4 clients is not different from that of other smaller audit firm clients.
H3b: The ex ante equity risk premium for Mid-tier clients is not different from that of other smaller audit firm clients.
H3c: The ex ante equity risk premium for Big 4 clients is not different from that of Mid-tier clients.
3. RESEARCH DESIGN AND DATA
3.1 Preparer Perspective “Earnings Management” Model
To test Hypothesis 1, we estimate the following preparer perspective model:
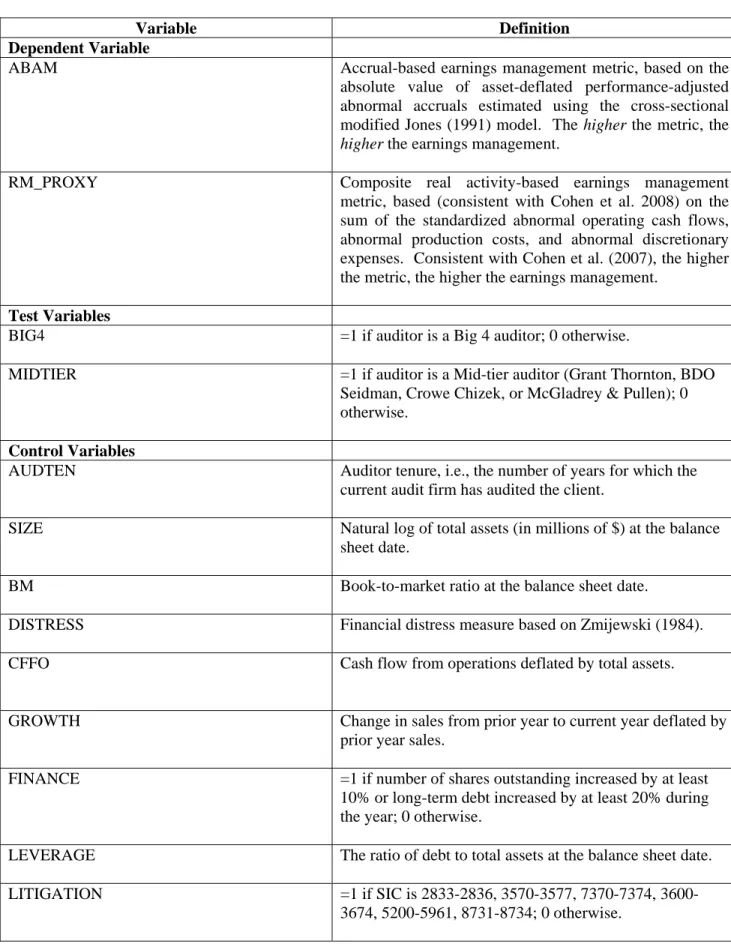
Earnings management metric = f(Test variables, Control variables) (1) In model (1), we utilize two separate earnings management metrics as the dependent variable. These metrics (variables ABAM and RM_PROXY) are defined in Table 1 panel A.
The first metric -- variable ABAM -- represents the absolute value of performance-adjusted abnormal accruals estimated using the cross-sectional modified Jones (1991) model.17 The higher the
16 Note that price protection benefits potential shareholders but adversely affects current shareholders. Other things being equal, an increase in the ex ante equity risk premium (i.e., higher expected returns going forward) implies a lower share price and a loss of wealth for current shareholders.
metric, the greater the accrual-based earnings management. To estimate normal accruals (and consistent with DeFond and Jiambalvo (1994) and Subramanyam (1996)), we utilize the modified Jones (1991) model below in the cross-section by industry.
t i t i it t i it it t i t i it
Assets
PPE
Assets
AR
SALES
Assets
Assets
TA
, 1 , 2 1 , 1 1 , 1 ,1
β
β
ε
α
+
Δ
−
Δ
+
+
=
− − − −In this model, TA is total accruals calculated as income from continuing operations less operating cash flows from continuing operations, ΔSALES is change in sales revenue, ΔAR is the change in accounts receivables, PPE is gross property and equipment, and the subscripts i and t denote firm and year, respectively. The abnormal accruals represent the difference between total accruals and the estimated (fitted) normal accruals. As suggested by Kothari et al. (2005) and consistent with Francis et al. (2005), we array firms in each industry (based on 2-digit SIC codes) into deciles based on the prior year return on assets (ROA), and obtain the performance-adjusted abnormal accruals by subtracting from each firm's abnormal accrual the median abnormal accrual from the corresponding ROA-industry decile to which the firm belongs.
The second metric -- variable RM_PROXY – represents a composite measure of real earnings management. Consistent with prior research (e.g., Cohen et al. 2008; Roychowdhury 2006), the metric focuses on real activity manipulations that impact the signed abnormal levels of operating cash flows (CFO), production costs (PROD), and discretionary expenses (DISCEXP).18 Specifically, it considers (1) the acceleration of sales through more lenient credit terms or increased price discounts, (2) the lowering of cost of goods sold (COGS) through increased production, and (3) the manipulation of discretionary expenses such as R&D and SG&A (including advertising).
Consistent with Cohen et al. (2008) and Roychowdhury (2006), we first estimate the normal level of cash flow from operations (CFO), production costs (PROD), and discretionary expenses (DISCEXP).
17 Since accruals reverse over time, earnings management behavior is better captured by absolute (rather than by income-increasing) accruals. Levitt (1998) makes a similar point in referring to cookie-jar accounting.
18 Unlike accruals, real-activity manipulations may not reverse over time. Hence, consistent with prior research we examine signed real-activity manipulations. Cohen et al. (2008) note that the RM_PROXY variable captures the effects of real earnings management through the three individual component variables in a “comprehensive measure” (p. 16). Consistent with Cohen et al. (2008, p. 16), “we acknowledge that the three individual variables have different implications for earnings which may dilute any results using RM_PROXY alone.”
First, normal CFO is expressed as a linear function of sales and change in sales, and the model is estimated in the cross-section by industry and year:
it t i it t i it t i t i it Assets SALES Assets SALES Assets Assets CFO α β β ε + Δ + + = − − − − , 1 2 1 , 1 1 , 1 , 1
Here, CFO is cash flow from continuing operations, SALES is sales revenue, ΔSALES is change in sales revenue, and the subscripts i and t denote firm and year, respectively. Abnormal CFO (ABCFO) is then calculated as actual CFO less normal CFO estimated using the coefficients from the above model.
Second, production costs are defined as the sum of COGS and change in inventory during the year. COGS is modeled as a linear function of contemporaneous sales, while inventory change is modeled as a function of the change in current year and prior year sales. Thus, normal production costs are expressed as a linear function of sales, and change in current year and prior year sales, and is estimated in the cross-section by industry and year:
it t i t i t i it t i it t i t i it
Assets
SALES
Assets
SALES
Assets
SALES
Assets
Assets
PROD
α
β
β
β
ε
+
Δ
+
Δ
+
+
=
− − − − − − , 1 1 , 3 1 , 2 1 , 1 1 , 1 ,1
Here, PROD is production costs calculated as the sum of cost of goods sold and change in inventory, SALES is sales revenue, ΔSALES is change in sales revenue, and the subscripts i and t denote firm and year, respectively. Abnormal production costs (ABPROD) is then calculated as actual PROD less normal PROD estimated using the coefficients from the model above.
Third, normal discretionary expenses are expressed as a function of lagged sales:
it t i it t i t i it
Assets
SALES
Assets
Assets
DISCEXP
α
β
ε
+
+
=
− − − − , 1 1 1 1 , 1 ,1
Here, DISCEXP represents discretionary expenses measured as the sum of R&D and SG&A (including advertising) expenditures, SALES is sales revenue, and the subscripts i and t denote firm and year, respectively. Once again, abnormal discretionary expenses (ABDISCEXP) is then calculated as actual DISCEXP less normal DISCEXP estimated using the coefficients from the above model. Finally, consistent with Cohen et al. (2008), we compute RM_PROXY as the sum of the standardized variables ABCFO, ABPROD, and ABDISCEXP.
3.1.1 Test Variables
The test variables BIG4 and MIDTIER are defined in Table 1 panel A. Basically, variable BIG4 is equal to 1 if the auditor is a Big 4 firm, and 0 otherwise. Similarly, variable MIDTIER is equal to 1 if the auditor is a Mid-tier audit firm, and 0 otherwise. In the regressions, when both variables BIG4 and MIDTIER are equal to 0, the auditor is an other smaller audit firm. Separately (and as noted previously), given the prior experience with Arthur Andersen, it may no longer be valid to view audit firm size as an innate determinant (or indicator) of audit quality. Hence, in the regressions with ABAM and RM_PROXY as dependent variables, we do not predict the sign for the BIG4 and MIDTIER test variables.
3.1.2 Control Variables
The control variables (AUDTEN through SDCFFO) are defined in Table 1 panel A. Prior research suggests tenure may affect the auditor’s objectivity and knowledge of the client favorably in the early years, but also adversely in later years (Casterella et al. 2002; Davis et al. 2003; Johnson et al. 2002; Myers et al. 2003; POB 2002). Hence, we control for auditor tenure (AUDTEN) in the regressions although we do not predict the sign for this variable.
The other control variables included in the model are also based on prior research. Lang and Lundholm (1993) suggest that larger firms have an incentive to manage earnings less (report more accurately) in an attempt to avoid litigation. We utilize variable SIZE as a proxy for the size of the audit client, and the predicted sign for this variable is negative. Consistent with prior research (e.g., Ashbaugh et al. 2003), the book-to-market ratio (variable BM) represents the inverse of the firm’s growth opportunities, and the predicted sign in negative.
In the regressions, variable DISTRESS represents the firm’s financial condition based on Zmijewski (1984), such that higher values of the variable represent higher levels of financial distress for the firm. Prior research (e.g., DeFond and Jiambalvo 1994; Reynolds and Francis 2000; Sweeney 1994) suggests that financial distress is positively associated with abnormal accruals. However, DeAngelo et al. (1994) find that more troubled firms tend to manage earnings downwards to facilitate debt renegotiation. Hence, in the regressions, we do not predict the sign for variable DISTRESS. Based on prior research
(Ashbaugh et al. 2003; Chung and Kallapur 2003), the audit client’s cash flow from operations is expected to be negatively related to abnormal accruals. In the regressions, variable CFFO represents the cash flow from operations scaled by total assets, and the predicted sign for this variable is negative.
Menon and Williams (2004) suggest that the client’s growth is positively associated with abnormal accruals. Also, Barth et al. (1999) and Dechow and Skinner (2000) suggest that growth firms have a strong incentive to manage earnings in an attempt to meet or beat earnings benchmarks and thus sustain the stock price. Hence, the predicted sign for GROWTH in the regressions is positive. Also, prior research (Ashbaugh et al. 2003; Chung and Kallapur 2003; Rangan 1998; Teoh et al. 1998) suggests that significant changes in company financing are positively related to the client’s incentive to manage earnings. Hence, in the regressions, the predicted sign for the variable FINANCE is positive.
Although DeFond and Jiambalvo (1994) suggest that more leveraged firms are more likely to use income-increasing accruals to avoid violating debt covenants, Hribar and Nichols (2006) report that leverage is negatively related to absolute abnormal accruals. Hence, in the regressions, we do not predict the sign of variable LEVERAGE. Also, firms in certain industries (such as biotechnology or electronics) have a higher incidence of shareholder litigation (Francis et al. 1994). We utilize an indicator variable LITIGATION to represent firms in high litigation risk industries, and consistent with Heninger (2001) the predicted sign for variable LITIGATION is positive. Separately, Bowen et al. (1995) suggest that firms have implicit claims with their stakeholders including customers, suppliers, and employees. Following Matsumoto (2002), we create variable IMPLICIT by factor analyzing three measures related to production, R&D spending, and labor intensity. Prior research suggests that accrual volatility may be related to firm-specific operating characteristics as measured by the volatility of the firm’s sales, earnings, and cash flows (Hribar and Nichols 2006). Hence, in the regressions, we include SDSALES, SDROA, and SDCFFO as control variables.
Finally, in the model with RM_PROXY as the dependent variable, we control for accrual management (variable AM). Since (consistent with Cohen et al. 2008) variable RM_PROXY is a signed metric, variable AM is also a signed measure. Potentially, managers may substitute real earnings
management for accrual management, although this remains an empirical question. Hence, in the regression we do not predict the sign of variable AM.
3.2 Investor Perspective “e-loading” Model
To test Hypothesis 2, we estimate the following investor perspective (e-loading) model:
E-loading metric = f(Test variables, Control variables) (2)
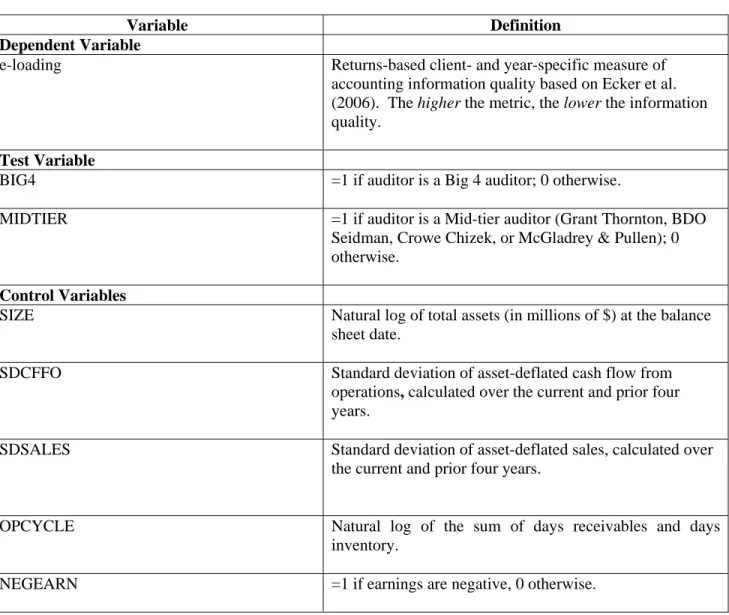
The dependent and independent variables in model (2) are defined in Table 1 panel B. The dependent variable e-loading is a returns-based representation of a client’s information (accruals) quality (Aboody et al. 2005; Ecker et al. 2006; Chen et al. 2007). We follow Ecker et al. (2006) in computing the e-loading metric, i.e., we estimate asset-pricing regressions that correlate daily client-specific returns with the Fama and French (1993) three factor (market, size, and book-to-market) returns as well as an information (accruals) quality factor return. The coefficient estimate on the information quality factor represents the e-loading metric.19 Consistent with Ecker et al. (2006), e-loading is a client- and year-specific estimate of information quality, such that the higher the e-loading metric, the lower the client-specific information
quality.
3.2.1 Test Variable
The test variables BIG4 and MIDTIER are defined in Table 1 panel B. As before, variable BIG4 is equal to 1 if the auditor is a Big 4 firm, and 0 otherwise. Similarly, variable MIDTIER is equal to 1 if the auditor is a Mid-tier audit firm, and 0 otherwise. In the regressions, when both variables BIG4 and MIDTIER are equal to 0, the auditor is an other smaller audit firm.
To the extent that investors are cognizant of the linkage between audit quality and earnings management, investors may perceive differentials in client-specific information quality across auditor groups, i.e., the client-specific e-loading metric may be expected to be associated with the type of auditor (Big 4, Mid-tier, or other). Once again, as noted previously, it may no longer be valid to view audit firm
19 Daily Fama and French (1993) three factor (market, size, and book-to market) returns and the information (accruals) quality factor returns are obtained from Professor Francis’ website. Francis et al. (2005) report that information quality is based on a modified version of the Dechow and Dichev (2002) model that maps accruals into cash flows. The information quality factor returns are formed by taking the difference between the monthly excess returns of the top two quintiles (implying lower information quality and higher expected returns) and the bottom two quintiles.
size as a determinant or indicator of audit quality. Hence, in the regression with e-loading as the dependent variable, we do not predict the sign for the BIG4 and MIDTIER test variables.
3.2.2 Control Variables
In the regressions, we control for other factors that may be expected to affect the e-loading metric. These control variables, i.e., SIZE through NEGEARN, are defined in Table 1 panel B and represent client-specific characteristics. As discussed by Ecker et al. (2006), the e-loading metric (the dependent variable in the model) is expected to be related negatively with firm size (variable SIZE) and positively with the variability of cash flows and sales, the length of the operating cycle, and the incidence of negative earnings (variables SDCFFO, SDSALES, OPCYCLE, and NEGEARN, respectively). Hence, in the regressions, the predicted sign for variable SIZE is negative while the predicted sign for variables SDCFFO through NEGEARN is positive.
3.3 Investor Perspective “Ex Ante Equity Risk Premium” Model
To test Hypothesis 3, our investor-perspective ex ante equity risk premium regression is based on the following model:
ravg = f(Test variables, Control variables) (3)
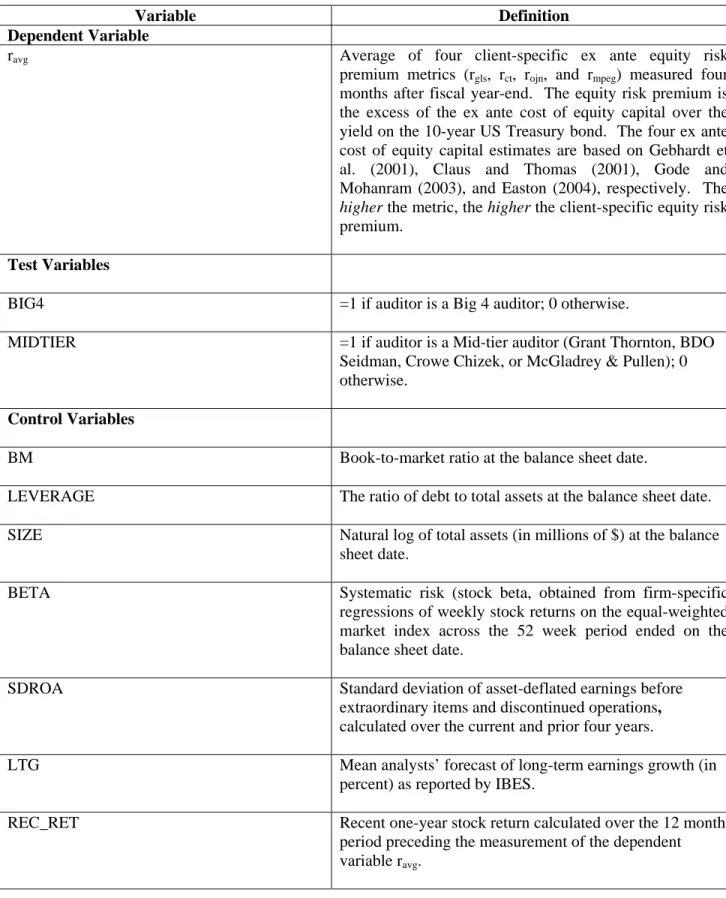
In model (3), the dependent variable ravg is the client-specific ex ante equity risk premium, and is defined in Table 1 panel C. Variable ravg is essentially an ex ante metric, i.e., a measure of expected rather than realized returns, and thus not directly observable.20 As noted by Dhaliwal et al. (2006), there are four alternative approaches discussed in the prior literature for estimating the ex ante cost of equity capital based on Gebhardt et al. (2001), Claus and Thomas (2001), Gode and Mohanram (2003), and Easton (2004). We refer to these estimates as rgls, rct, rojn, and rmpeg, respectively. All four approaches utilize models based on forecasted earnings, dividends, and book values to estimate the return required by shareholders as implied by the observed share price.
The details of each of the four models (and their underlying definitions and assumptions) is discussed in the appendix in Dhaliwal et al. (2006), and we refer the reader to that summary for
20 Consistent with the prior literature (Basu 2004; Botosan and Plumlee 2005; Francis et al 2004), Dhaliwal et al. (2006, p. 699) notes that “at a theoretical level, ex ante estimation is more appropriate for estimating the return demanded by stockholders than methods that rely on ex post realizations.”
convenience. Given the lack of consensus as to which approach (model) is superior in estimating the cost of equity, we follow Dhaliwal et al. (2006) and Hail and Leuz (2006) in using the average (ravg) of the four estimates in our empirical tests to mitigate the effects of particular assumptions that underlie each model on our results. Consistent with prior research (Gebhardt et al. 2001; Dhaliwal et al. 2006), we focus on the equity risk premium (i.e., the excess of the ex ante cost of equity capital over the yield on the 10-year US Treasury bond) as our research metric.21
3.3.1 Test Variables
The test variables BIG4 and MIDTIER are defined in Table 1 panel C. As before, variable BIG4 is equal to 1 if the auditor is a Big 4 firm, and 0 otherwise. Similarly, variable MIDTIER is equal to 1 if the auditor is a Mid-tier audit firm, and 0 otherwise. When both variables BIG4 and MIDTIER are equal to 0, the auditor is an “other” smaller audit firm.
Once again, to the extent that investors are cognizant of the linkage between audit quality and earnings management, investors may perceive client-specific information quality differentials across auditor groups. To the extent that information quality is a priced risk factor, the client-specific ex ante equity risk premium may be expected to be associated with the type of auditor (Big 4, Mid-tier, or other). However, since audit firm size may no longer be a valid indicator of audit quality, we do not predict the sign of the test variables BIG4 and MIDTIER in the regression.
However, an alternative view (discussed previously) is that the client-specific ex ante equity risk premium is driven by insurance-related considerations rather than by perceived audit quality (Khurana and Raman 2004). Put differently, a Big 4 audit (relative to Mid-tier or other smaller firm audits) may be associated with a lower client-specific ex ante equity risk premium by virtue of the Big 4 auditor’s financial resources (“deep pockets”). From this alternative perspective, the predicted sign for the BIG4 test variable in the regression is negative.
21 Consistent with Gebhardt et al. (2001, p. 143), the fourth month is chosen to facilitate alignment between IBES and Compustat.
3.3.2 Control Variables
Model (3) controls for factors that may be expected to affect the client-specific ex ante equity risk premium. These control variables (BM through REC_RET) are defined in Table 1 panel C. Consistent with Fama and French (1997), we control for the book-to-market ratio (variable BM) as an equity risk factor. Variable BM is predicted to have a positive sign in the regressions. Also, a higher degree of financial leverage (variable LEVERAGE) is expected to raise the perceived risk and increase the firm’s equity risk premium (Gebhardt et al. 2001). Hence, variable LEVERAGE is also expected to have a positive sign in the regressions.
Other things being equal, the larger the client, the greater the information available about the client, the more liquid the stock, and the lower the perceived risk (Brennan and Subrahmanyam 1996; Fama and French 1997; Gebhardt et al. 2001). Hence, we control for the size of the client. Variable SIZE is predicted to have a negative sign in the regressions. Also, in the context of the capital asset pricing model, systematic risk (as measured by the stock beta) is predicted to be positively correlated with the equity risk premium. Consequently, variable BETA is expected to have a positive sign.
Separately, Gebhardt et al. (2001) suggest that the volatility in reported earnings may be perceived as a source of risk in valuing stocks. Hence, variable SDROA (the standard deviation of asset-deflated earnings) is predicted to have a positive sign in the regressions. Also, as suggested by Beaver et al. (1970) and La Porta (1996), there may be a positive association between growth and equity risk since growth opportunities are more uncertain than normal earnings. Hence, variable LTG (based on the mean analysts’ forecast of long-term earnings growth as reported by IBES) is expected to have a positive sign. Further, to control for sluggishness in analysts’ earnings forecasts, we include the recent one-year stock return (variable REC_RET) calculated over the 12 months preceding the measurement of the dependent variable ERP. Consistent with Guay et al. (2005), the predicted sign for variable REC_RET is negative.22
22“If recent stock returns have been high (low), and if analysts’ forecasts of future earnings are too low (high) due to sluggish updates of the information that has been recently impounded in stock price, the imputed discount rate will be artificially low (high) in order to maintain the pricing equation” (Guay et al. 2005, p. 18). Hence, in the regressions, the predicted sign for recent stock returns (REC_RET) is negative. Note also that variables BM and SIZE in the model (discussed previously) may be expected to control for any systematic optimism in analysts’ earnings forecasts (Guay et al. 2005, p. 25).
Finally, our regressions include dummy variables to control for the firm’s industry membership (variable INDUSTRYxx, based on 2-digit SIC classifications).
3.4 Econometric Estimations
To estimate the models (1) through (3) above, we utilize a pooled time-series, cross-sectional approach. Statistical inferences for the pooled regressions are based on “robust” t-statistics that are adjusted for residual correlation arising from pooling cross-sectional observations across time, i.e., the t-statistics are based on White (1980) heteroskedasticity adjusted robust variance estimates that are adjusted for within-cluster correlation where the firm and fiscal year comprise the cluster (Cameron et al. 2006; Petersen 2006; Thompson 2005).
3.5 Data and Sample
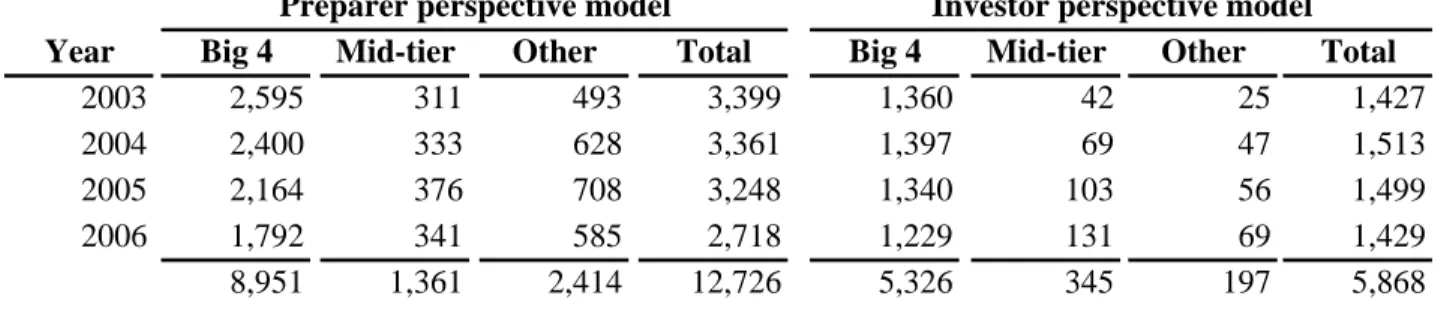
Table 2 panel A summarizes the sample selection process. For the preparer-perspective earnings management model, the sample is formed from the merged Compustat annual industrial files, including the primary, secondary, tertiary and full coverage research files. Excluded from our sample are utility and financial services clients, and industries (2-digit SIC code) with fewer than 10 client-year observations available to estimate the industry-specific modified Jones (1991) model.23 After excluding observations with missing data on control variables, we are left with a sample of 12,726 client-years. For the investor-perspective e-loading and ex ante equity risk premium (ravg) models, we begin with the sample for the preparer-perspective earnings management model (12,726 observations), and exclude observations (client-years) not found in IBES and CRSP. The final sample for the investor-perspective models consists of 5,868 observations.
Table 2 panel B provides information on sample composition by year and auditor group for both the preparer- and investor-perspective regressions. Consistent with the notion that the Big 4 dominate the audit market (GAO 2003, 2008), a large majority of our observations have a Big 4 firm for auditor. Table 2 panel C provides similar information for our “trimmed” sample. As discussed previously, we seek to include in our analysis only those Big 4 clients for whom the Mid-tier firms are potentially viable as
23 Consistent with prior research (e.g., Fields et al. 2004), utilities and financial institutions are excluded because of their unique regulatory and operating characteristics.
auditors. During 2003 through 2006, the largest Mid-tier client had revenues of $5.27 billion, $5.95
billion, $6.17 billion, and $7.86 billion, respectively. Our trimmed sample omits Big 4 clients with revenues exceeding these threshold amounts in each of those years. Another advantage of using the trimmed sample is that it minimizes differences in client characteristics (such as growth opportunities, company size, and risk) across auditor categories.24 Because of this size cap on Big 4 clients, our “trimmed” sample is reduced to 11,849 and 5,225 observations for the preparer- and investor-perspective analyses, respectively. Finally, to reduce the influence of outliers, all variables are truncated at the 1st and 99th percentiles.
4. EMPIRICAL FINDINGS
4.1 Preparer Perspective (“Earnings Management”) Model
4.1.1 Descriptive Statistics
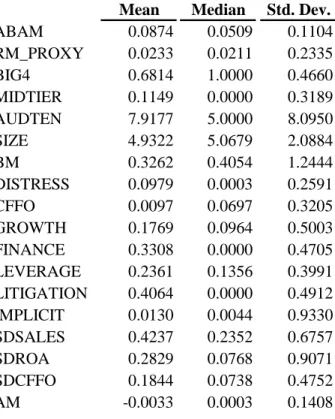
Table 3 provides descriptive statistics and correlation coefficients for the dependent and explanatory variables in the preparer-perspective earnings management regressions. Panel A reports the mean, median, and standard deviation for the earnings management dependent variables (ABAM and RM_PROXY), as well as the independent variables. The mean and median values of both earnings management dependent variables are within the range reported in prior studies (e.g., Cohen et al. 2008). For the test variables BIG4 and MIDTIER, the mean for the BIG4 (MIDTIER) dummy variable is 0.6814 (0.1149), indicating that approximately 68 (11) percent of our pooled observations have a Big 4 (Mid-tier) auditor.25 Thus, the remaining observations (approximately 21 percent) are audited by other smaller auditors. As for the other independent variables, we control for these client characteristics in our multiple regressions (discussed below).
24 The remaining differences in client characteristics are controlled for in our multivariate analyses (discussed later in the paper). Separately, we did not pursue a research design focusing on a sample of audit clients that switched from a Big 4 auditor to a mid-tier auditor for two reasons: First, the sample size for auditor changes is limited. Second, the problem of drawing any inferences without controlling for the reasons underlying the auditor change are potentially insurmountable.
25 As noted previously, our “trimmed” sample excludes Big 4 clients (observations) whose revenues exceed the revenues of the largest Mid-tier client. Hence, for the Big 4, the 68 percent market share we report is somewhat lower than the 78 percent market share of all publicly owned US companies reported by the GAO (2003).
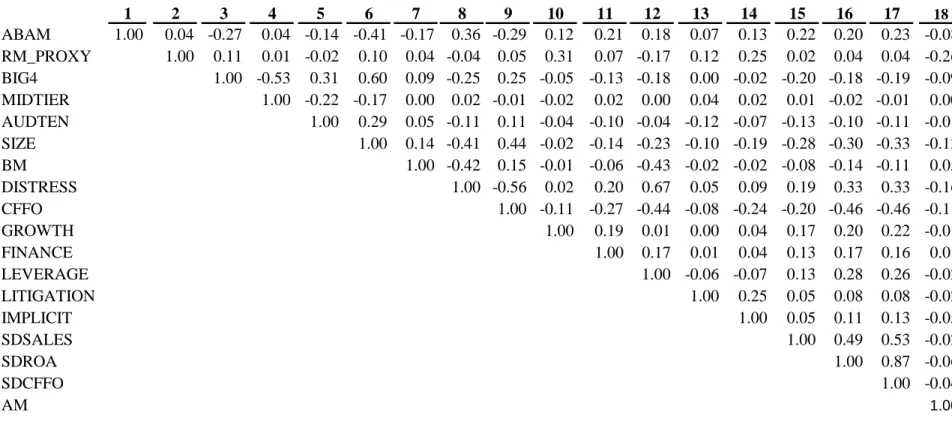
Panel B reports the correlation coefficients between the earnings management metrics (ABAM and RM_PROXY) and the independent variables in the regressions. Although we show the correlation matrix for completeness, we diagnose multicollinearity in the regressions using variance inflation factors (VIFs) as discussed below.
4.1.2 Tests of Hypothesis 1
Table 4 reports regression results with the accrual-based and real-activity based earnings management metrics ABAM and RM_PROXY as the dependent variables. As discussed previously, the test variables BIG4 and MIDTIER represent the type of auditor, with other smaller auditors as the omitted category.
In both regressions in Table 4, the VIFs are fairly low which suggests that collinearity is not likely to be a problem in interpreting the results. Also, the control variables AUDTEN through AM -- where predicted and significant -- have the anticipated signs. The findings for the control variables are consistent with prior research (e.g., Ashbaugh et al. 2003; Warfield et al. 1995) which basically suggests that the relation between earnings management metrics and the control variables are not always clear cut with coefficients differing in signs across studies.
As discussed previously, our Hypothesis 1 examines whether earnings management varies across clients depending on the type of auditor. In the ABAM regression, both test variables BIG4 and MIDTIER are significant at the 0.01 level with a negative sign, indicating that Big 4 and Mid-tier audit
clients have lower levels of accrual management relative to other audit clients. An F-test that the
coefficients for the BIG4 and MIDTIER test variables are equal could not be rejected (F = 0.010, p = 0.917). These results suggest that during 2003-06, the level of accrual management was similar for Big 4 and Mid-tier audit clients.
By contrast, in the regression with RM_PROXY as the dependent variable, the test variables BIG4 and MIDTIER are significant at the 0.01 level with a positive sign, indicating that Big 4 and
Mid-tier audit clients have higher levels of real earnings management relative to other smaller audit firm
clients. Once again, in the regression with RM_PROXY as the dependent variable, an F-test that the coefficients for the BIG4 and MIDTIER test variables are equal could not be rejected (F = 0.217, p =
0.641). These results suggest that the level of real earnings management is similar for Big 4 and Mid-tier audit clients during 2003-06. Collectively, the evidence for both accrual and real earnings management leads us to reject Hypotheses 1A and 1B, but not Hypothesis 1C. In other words, during 2003-06, we find that the level of earnings management varies across clients by type of auditor, but that it is similar for clients of Big 4 and Mid-tier auditors.
4.2 Investor Perspective (“E-loading” and “Ex ante equity risk premium”) Models
4.2.1 Descriptive Statistics
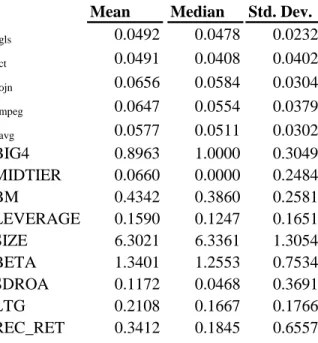
Table 5 reports descriptive statistics and correlation coefficients for the dependent and independent variables in our investor perspective regressions. Specifically, Panels A and B report descriptive statistics and correlation coefficients for the e-loading analysis (i.e., the regressions with the returns-based representation of information quality – the e-loading metric -- as the dependent variable). For variable e-loading, the mean value reported in panel A is comparable to the mean value reported by Ecker et al. (2006). Separately, the clients included in the investor perspective analysis have analyst following (and IBES coverage) and thus tend to be larger in size. For the test variables BIG4 and MIDTIER, the mean values of 0.8963 and 0.0660 indicate that approximately 89.6 percent and 6.6 percent of the pooled observations have a Big 4 or Mid-tier auditor, respectively. For completeness, panel B reports the correlation matrix, although we diagnose multicollinearity in the regressions using VIFs as discussed later.
Table 5 panels C and D report similar information for the ravg analysis (i.e., the regressions with the ex ante equity risk premium as the dependent variable). Panel C reports the mean, median, and standard deviation for the four client-specific ex ante equity risk premium metrics (rgls, rct, rojn, and rmpeg) as well as our dependent variable ravg (the average of the four ex ante equity risk premium metrics). These descriptive statistics are comparable to those reported by Dhaliwal et al. (2006). Panel D reports the correlation coefficients among the four ex ante equity risk premium metrics (rgls, rct, rojn, and rmpeg) as well as the dependent and explanatory variables in the equity risk premium regression. The pair-wise correlations among the ex ante equity risk premium metrics (rgls, rct, rojn, rmpeg, and ravg) are similar to those
reported by Dhaliwal et al. (2006). To diagnose multicollinearity in the regressions, we report VIFs below.
4.2.2 Tests of Hypothesis 2
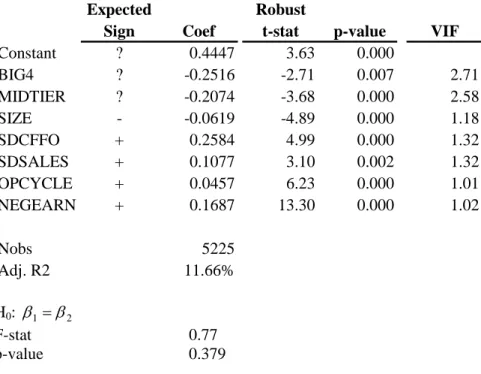
Table 6 panel A reports regression results with variable e-loading (i.e., the client- and year-specific returns-based representation of information quality) as the dependent variable. In the regression, the low VIFs suggest that multicollinearity is not likely to be a problem in interpreting the regression findings. Also, the control variables in the model (SIZE through NEGEARN) are significant with the predicted signs.
In terms of our Hypothesis H2, the test variables BIG4 and MIDTIER are of interest. In Table 6 panel A, both variables BIG4 and MIDTIER are statistically significant with a negative sign. Recall that
a higher e-loading metric indicates lower investor-perceived information quality. Also recall that given
the auditor’s role of lending credibility to reported earnings by restraining earnings management (so that reported earnings are more reflective of the client’s underlying economics), the higher the perceived quality of the audit, the more likely that the client’s information (accrual) quality is captured in a lower client-specific e-loading metric. Hence, in Table 6 panel A, the negative sign for the test variables BIG4 and MIDTIER suggests that Big 4 and Mid-tier clients are perceived by investors as reporting higher quality (accrual) information relative to clients of other smaller audit firms. These findings are consistent with the notion that investors are cognizant of the linkage between auditor type and accrual-based earnings management by clients, and view Big 4 and Mid-tier auditors as providing audits of higher quality relative to other smaller auditors.
Separately, note that an F-test that the coefficients for the BIG4 and MIDTIER test variables are equal could not be rejected (F = 0.77, p = 0.379). These results suggest that investors perceive the Big 4 and Mid-tier firms as providing audits of similar quality, and is consistent with our earlier finding (from a preparer perspective) that the level of accrual-based earnings management is similar for Big 4 and Mid-tier audit clients. Collectively, these findings lead us to reject Hypotheses 2A and 2B, but not Hypothesis 2C. In other words, during 2003-06, we find that the investor-perceived information (accruals) quality varies across clients by type of auditor, but that it is similar for clients of Big 4 and Mid-tier auditors.
4.2.3 Tests of Hypothesis 3
Table 6 panel B reports regression results with variable ravg (the client-specific ex ante equity risk premium) as the dependent variable. Once again, the low VIFs suggest that multicollinearity is not likely to be a problem in interpreting the regression findings. Also, the control variables in the model (BM through REC_RET) are significant with the predicted signs. Note that the model also includes industry dummies, although the industry-specific intercepts are not reported in the Table for brevity.
In terms of our Hypothesis H3, the test variables once again are BIG4 and MIDTIER. As discussed previously, to the extent that investors are aware of the linkage between audit quality and earnings management, investors may perceive client-specific information quality differentials across auditor groups. Further, to the extent that information quality is a priced risk factor, the client-specific ex ante equity risk premium may be expected to be associated with the type of auditor (Big 4, Mid-tier, or other). However, as noted previously, given the recent experience with Arthur Andersen, it may no longer be valid to view audit firm size as an indicator of audit quality. From this perspective, the sign for the test variables BIG4 and MIDTIER in the regression cannot be predicted.
However, an alternative view (also discussed previously) is that the client-specific ex ante equity risk premium is driven by insurance-related considerations rather than by differences in perceived information quality (Khurana and Raman 2004). Put differently, a Big 4 audit (relative to audits by Mid-tier and other smaller audit firms) is expected to be associated with a lower client-specific ex ante equity risk premium by virtue of the Big 4 auditor’s financial resources (“deep pockets”). Based on this view, the predicted sign for the BIG4 test variable is negative.
In Table 6 panel B, variable BIG4 is significant with a negative sign. By contrast, variable
MIDTIER is not significant. Also, an F-test that the coefficients for the BIG4 and MIDTIER test variables are equal is rejected (F = 18.51, p = 0.001). Thus, although our earlier findings (from a preparer perspective) was that the Big 4 and Mid-tier firms provide audits of similar quality, in Table 6 panel B we find that only Big 4 audits are associated with a lower ex ante equity risk premium. Consistent with Khurana and Raman (2004), these findings suggest that what is being priced in the ex ante equity risk premium for audit clients is not audit quality but rather the insurance-related considerations associated
with the type of auditor, i.e., the Big 4 auditor’s financial resources (“deep pockets”). Collectively, the evidence leads us to reject Hypotheses 3A and 3C, but not Hypothesis 3B. In other words, during 2003-06 we find that the ex ante equity risk premium varies across clients by type of auditor, but that it is similar for clients of Mid-tier and other smaller firm auditors.
4.3 Additional Analysis
In examining the Mid-tier auditors in our sample, we noticed that the two smaller audit firms in this group (Crowe Chizek and McGladrey Pullen) accounted for only 125 observations (out of a total of 1,361 Mid-tier observations) during 2003-06.26 In additional analysis, we narrowed the definition of Mid-tier to only the two larger auditors in this group (Grant Thornton and BDO Seidman). The results from this alternative analysis were similar to those reported in the paper, i.e., we found Big 4 and Mid-tier audit clients to have lower levels of accrual-based earnings management and higher levels of real-activity based
earnings management (relative to other smaller audit firm clients) during 2003-06. In both cases, as before, we were unable to reject the null that the level of earnings management (whether accrual-based or real-activity based) is similar for Big 4 and Mid-tier audit clients. With respect to the e-loading metric, the findings again were similar, i.e., the investor-perceived information (accruals) quality is higher for
Big 4 and Mid-tier audit clients (relative to other smaller audit firm clients). Once again, we were unable to reject the null that the e-loading metric is similar for Big 4 and Mid-tier audit clients. Finally, with respect to the client-specific ex ante equity risk premium, we found this metric to be lower for Big 4
clients (relative to both Mid-tier and other smaller audit firm clients). Also, we found the equity risk premium to be similar for Mid-tier and other smaller audit firm clients. Thus, our findings (both individually and collectively) were robust to re-defining the Mid-tier auditor group as consisting of only Grant Thornton and BDO Seidman.
5. CONCLUDING REMARKS
Our study examines audit quality differences across Big 4, Mid-tier, and other smaller auditors during 2003-06. We include in our analyses only those Big 4 clients for whom the Mid-tier firms are
26 As noted previously (fn. 2), we identified four firms (Grant Thornton, BDO Seidman, Crowe Chizek, and McGladrey Pullen) as Mid-tier firms for our study.
potentially viable as auditors. Prior research views the auditor’s role as one of enhancing the credibility of financial reporting by restraining earnings management, i.e., reporting earnings that are more reflective of the client’s underlying economics. Thus, higher audit quality is viewed as being associated with less opportunistic reporting. We examine both accrual-based as well as real-activity based earnings management. Our findings suggest that relative to clients of other smaller auditors, both Big 4 and Mid-tier auditor clients have (1) lower (but similar) levels of accrual management, and (2) higher (but also
similar) levels of real earnings management. Collectively, the evidence suggests that the level of earnings management is similar for Big 4 and Mid-tier clients, implying that Big 4 and Mid-tier auditors provide audits of similar quality.
From an investor perspective, our analysis indicates that the e-loading metric – a measure of investor-perceived information (accruals) quality -- is similar for Big 4 and Mid-tier audit clients, which suggests that investors perceive Big 4 and Mid-tier auditors as providing audits of similar quality. However, we find the ex ante equity risk premium to be lower only for Big 4 clients. Consistent with prior research (GAO 2008, Khurana and Raman 2004), this latter finding appears to be driven by the insurance role of the audit rather than by audit quality considerations. Put differently, the lower equity
risk premium for Big 4 clients is explained by the auditor’s “deep pockets,” i.e., the Big 4 auditor’s financial resources and greater ability to share more of the investor losses in the event of client failure.
Our findings have implications for the ongoing debate about auditor concentration and Big 4 dominance of the audit market (Committee on Capital Market Regulation 2006; US Chamber of Commerce 2006, 2007). Our finding that Big 4 and Mid-tier auditors provide audits of similar quality suggests that in situations where a Mid-tier auditor is viable, Big 4 clients could utilize a Mid-tier auditor – and thereby reduce auditor concentration – without adversely affecting audit quality. Separately, since the demise of Arthur Andersen, various initiatives have sought to limit auditor liability to avoid the potential loss of another Big 4 firm. To the extent that the lower equity risk premium for Big 4 clients is driven by insurance considerations, any limit on auditor liability is likely to lower the insurance-related attractiveness of Big 4 auditors. Thus, a cap on Big 4 auditor liability could have the unintended effect of
lowering Big 4 market dominance by making Mid-tier auditors more acceptable to investment bankers, institutional investors, and audit clients.
REFERENCES
Aboody, D., J. Hughes, and J. Liu. 2005. Earnings quality, insider trading, and cost of capital. Journal of Accounting Research 43(5): 651-673.
Ashbaugh, H., R. LaFond, and B. Mayhew. 2003. Do nonaudit services compromise auditor independence? Further evidence. The Accounting Review 78(3): 611-639.
Barth, M., J. Elliott, and M. Finn. 1999. Market rewards associated with increasing earnings patterns.
Journal of Accounting Research 37: 387-413.
Bartov, E., D. Givoly, and C. Hayn. 2002. The rewards to meeting or beating earnings expectations.
Journal of Accounting and Economics 33: 173-204.
Basu, S. 2004. What do we learn from two new accounting-based stock market anomalies? Journal of Accounting and Economics 38: 333-348.
Beatty, R. 1989. Auditor reputation and the pricing of initial public offerings. The Accounting Review
(October): 693-709.
Beaver, W., P. Kettler, and M. Scholes. 1970. The association between market determined and accounting determined risk measures. The Accounting Review (October): 654-681.
Becker, C., M. Defond, J. Jiambalvo, and K. Subramanyam. 1998. The effects of audit quality on earnings management. Contemporary Accounting Research 15(1): 1-24.
Bhattacharya, U., H. Daouk, and M. Welker. 2003. The world price of earnings opacity. The Accounting Review 78(3): 641-678.
Botosan, C. 1997. Disclosure level and the cost of