The organizational benefits of teams
Linda I. Glassop
A B S T R A C T This study presents an analysis of the benefits of two team structures – quality circles and self-managing work groups – for Australian work organizations utilizing the Australian Workplace Industrial Relations Survey for 1995. The analysis indicates that firms with team struc-tures have higher labor productivity, a flatter management structure and reduced employee turnover. The presence of team structures in Australian firms indicates a decrease in industrial harmony. The find-ings were inconclusive regarding absenteeism and profitability.
K E Y W O R D S industrial harmony productivity quality circles self-managing work groups teams
Introduction
The use of formal work teams, team-building activities and the rhetoric of ‘the team’ are, today, commonplace in the theoretical and popular busi-ness literature (Cordery, 1995; Hillkirk, 1993). Research extends to such topics as team leadership (Manz & Sims, 1987), group structures (Cohen & Ledford, 1994), group-think (Manz & Sims, 1982), team leader selec-tion (Armstrong, 1998), and group dysfuncselec-tion (Diamond, 1991). Research also suggests that teams can provide many benefits for organiz-ations and employees alike (Cordery, 1995; Morehead et al., 1997; Oster-man, 1994).
Callus et al. (1991) and Morehead et al. (1997) suggest that the adop-tion of formal team structures and the use of team-building approaches in
2 2 5
Human Relations [0018-7267(200202)55:2] Volume 55(2): 225–249: 021184 Copyright © 2002
The Tavistock Institute ® SAGE Publications
London, Thousand Oaks CA, New Delhi
Australian organizations are widespread. However, an empirical analysis of their benefits is lacking. Cordery (1995) confirms that such survey data are not available in Australia. American researchers also note, ‘. . . empirical evidence regarding [team] effectiveness is limited’ (Cohen & Ledford, 1994: 13–15). Utilizing a large cross-sectional sample of Australian firms, this article aims to evaluate the benefits of teams for Australian work organiz-ations.
First, we provide a conceptual outline as to what teams are. Second, we present the arguments as to why team structures generate certain organiz-ational benefits. Third, we provide a brief review of previous studies on teams highlighting the lack of sound empirical evidence attesting to the proposed benefits. Fourth, the research method adopted to evaluate the proposed benefits is provided. Finally, the results of the research are detailed together with a discussion of the findings before the article concludes.
Team structures
Teams are a set of interdependent individuals bound by a collective aim (Zaiger Roberts, 1994). Such teams may range in size, but generally have between three and 20 members (McGraw & Dunford, 1987; Orsburn & Moran, 2000; Tyson, 1998). Teams can be temporary in nature – with a finite start and end date – or a permanent feature of the business structure. There are three basic types of teams: problem-solving groups (often called quality circles or process improvement groups); self-managing or natural work groups; and cross-functional teams (such as task-forces, committees and project groups) (Robbins et al., 1998).
Two formal team structures – quality circles (QCs) and self-managing work groups (SMWGs) – are investigated in this study. These are formal team structures that have been regularly discussed in the Australian management literature over the past 30 years (Griffiths, 1997). As a result, their con-struction is generally common across organizations, thereby facilitating cross-organizational research. Cross-functional teams, in contrast, exist in all organizations in some form or another, but their purpose and use may vary widely. Thus, the ability to test the benefits of cross-functional teams is fraught with empirical difficulties.
Quality control circles (QCCs), quality circles (QCs), or process improvement groups (PIGs) were originally devised as a training mechanism as part of Japan’s total quality control (TQC) process in 1962 (Berger & Shores, 1986; Ishikawa, 1985; Juran, 1967/1986). Juran (1967/1986: 3) defines a QCC as
a small group of departmental work leaders and line operators who have volunteered to spend time outside of their regular hours to help solve departmental quality problems.
This definition remains today except that the activities of QCs are usually carried out within paid work hours and often extend to a broader range of workplace problems other than ‘quality’ (McGraw & Dunford, 1987).
Self-managing work groups (SMWGs), self-directed work teams (SDWTs), self-managing teams (SMTs), or semi-autonomous work groups (SAWGs) were first devised by social scientists from the Tavistock Institute (Trist, 1993; Weisbord, 1987). Such groups evolved from a need to develop flexible and adaptive work structures to respond to a continually changing industrial environment (Emery & Emery, 1993).
A self-managing work group is a group of interdependent individuals that have accepted responsibility for a group task and share this responsi-bility by monitoring and controlling the contributions of its members (Cohen & Ledford, 1994; Emery & Emery, 1974, 1993). Whereas QCs are devoted to specific problem-solving, SMWGs are considered a ‘natural’ work group insofar as members are co-joined to fulfill their daily work task and not simply to resolve problems. There are a variety of such groups – self-regulating, semi-autonomous, self-directing (see Sundstrom et al., 1990) – that are all structured on the principles of systems theory as developed at the Tavistock.
The benefits of teams
Several organizational benefits have been proposed in the literature on teams. These include increased workplace productivity; improvements to product/service quality; a reduced management structure; lower levels of absenteeism; reduced employee turnover; and increased industrial harmony, with all these benefits ultimately leading to improved workplace performance. Although quality of work life (QWL) for employees is also identified in the literature as a benefit of teams, for example, work satis-faction, an analysis of QWL factors, from the employee’s perspective, is beyond the scope of this article. We will, however, investigate QWL from the organizational perspective via turnover, absenteeism and industrial harmony. Accordingly, we now set out the theoretical basis for these benefits.
Workplace productivity
QCs were originally devised as a mechanism to train employees on statisti-cal processes (Glassop, 1995). The aim of these statististatisti-cal processes is to elim-inate problems, waste and errors by removing variation in the work system (Shewhart, 1931). Thus, QCs bring individuals together to resolve work-system problems. The removal of variation in the work work-system, as an outcome of QC activity, produces a more productive system (Ishikawa, 1985). SMWGs, however, are designed to ensure that the work system does not malfunction, that work continues in the absence of a human ‘part’ (Emery & Emery, 1993). F.E. Emery (1972, 1993) defines this concept as ‘redundancy of parts’. That is, if redundancy (via a human part) is built into the work system, the system will not malfunction. Thus, SMWGs ensure that the work system has no interruptions.
These elements are inherent to the notion of productivity, inasmuch as productivity is generally viewed as a measure of output per unit of compos-ite input (that is, capital plus labor; Horngren et al., 1997). Given the same level of inputs, if errors and problems are eliminated and work continues undeterred then the resultant output would be expected to be above that of a work system that had not been designed to attend to these issues; hence the notion that QCs and SMWGs improve productivity. Productivity is generally measured in terms of labor utilization (Greiner et al., 1995). It is argued, therefore, that firms that implement QCs or SMWGs will have a higher level of labor productivity than firms that do not have these team structures. Product/service quality
QCs function to remove variation from a work system, resulting in the output being consistent and reliable (Glassop, 1995). Consistency and reliability of output are inherent in the notion of quality (Gilmour & Hunt, 1995). Thus, the primary aim of QC activity is to improve the quality of output thereby improving its ‘fitness for use’ (Juran & Gyrna, 1980). In a production line work structure, employees focus on their individual ‘part’ in the system with quality generally inspected at the end of the production line (Gilmour & Hunt, 1995). Under the structure of SMWGs, a group of workers attends to whole tasks thereby ‘empowering’ such workers to take responsibility for their work and adjust work processes to improve the quality of their output (Cohen & Ledford, 1994). Thus, quality is effectively ‘built-in’ to the process. As such, QCs bring groups of workers together external to their natural work system to improve the quality of their output, whereas SMWGs allow employees to attend to quality issues as a natural part of their operating pro-cesses. It is argued, therefore, that firms with QCs or SMWGs will have
higher levels of product/service quality than firms that do not have these team structures.
Management structure
QCs are charged with the responsibility of improving work performance thereby eliminating work problems. By allocating QC members the responsi-bility for resolving work problems there is less need for external supervision. This reduced need for external supervision may result in a reduced number of levels in the hierarchy (Lawler et al., 1992). SMWGs have been specific-ally designed to build redundancy of functions into the work group (M. Emery, 1993). The redundancy of functions principle operates on the notion that workers in a SMWG are multi-skilled and can take on the responsibility normally accorded a supervisor (redundant functionality of the system is built in). That is, the supervisory function does not sit external to the group, but, rather, is built into the natural work group. Thus, there is a reduced need for external supervision; the group becomes ‘self-managing’.
This reduced need for supervision is often referred to as ‘flattening the hierarchy’. It is argued, therefore, that firms with QCs or SMWGs will have a flatter hierarchy than firms that do not have these team structures.
Absenteeism
With an increased level of autonomy and responsibility asserted for both QCs and SMWGs, together with the belief that these team structures improve QWL indicators, reduced absenteeism is reputed to be a positive outcome (Cohen & Ledford, 1994; Trist et al., 1993). That is, employees enjoying the social structure of teams are more likely to attend work. Thus, it is argued that firms with QCs or SMWGs will have lower absenteeism than firms that do not have these team structures.
Employee turnover
As with absenteeism, the social structure of teams is reported to positively impact employee turnover (Pearce & Ravlin, 1987). If quality of work life is improved for employees when teams are present then a reduction in employee turnover is a likely outcome, given that employee turnover is fre-quently utilized as a measure for job redesign interventions (Hackman & Oldham, 1980). While some research has found that employee turnover increased when teams were introduced (Wall et al., 1986), it is argued here that firms with QCs or SMWGs are likely to have a lower level of employee
turnover (in the long term) than firms that do not have these team struc-tures.
Industrial harmony
QCs actively encourage workers to present the results of problem analysis to management for approval regarding proposed solutions (Blakemore, 1996). This structural facet encourages improved labor–management inter-actions (Bradley & Hill, 1983). By contrast, SMWGs have removed exter-nal supervision thereby suggesting that workers can deal directly with management (Cordery et al., 1991). Again, enhanced labor–management relations should ensue. As a result, QC and SMWG structures enable workers to have a closer working relationship with management. This closer working relationship, it is argued, enables firms with these team structures to have a higher level of industrial harmony than firms that do not have these team structures.
Workplace performance
The above benefits are often collectively identified as workplace performance measures. Workplace performance, however, is also measured in terms of a firm’s financial position (Kaplan & Norton, 1992). Given that case studies on the use of teams regularly cite financial benefits for both QCs and SMWGs as a result of the above structural facets, it is argued that firms that have QCs or SMWGs are likely to be more profitable than firms that do not have these team structures.
Both team structures
Both QCs and SMWGs are work practices that increase employee involve-ment in the work system (Davis & Lansbury, 1996). In Lawler et al.’s (1992) study of employee involvement practices, these authors found that adopting multiple employee involvement mechanisms within a firm was more favor-able to business performance than adopting fewer practices. Multiple employee involvement mechanisms in a firm would suggest that more employees are engaged in activities that yield the above benefits. Thus, it is proposed that firms that adopt multiple employee involvement mechanisms will have a higher level of benefits (as argued above) than firms that have fewer employee involvement mechanisms. Accordingly, we will investigate the above benefits in terms of firms having a single team structure and both team structures.
Previous research
Quality circles
Research on the benefits of QCs has been conducted in Japan, America, Britain and Australia since they were first devised in 1962. However, this research tends to rely on case studies and the self-reported perceptions of employees or management, thus it lacks empirical validity. For example, in Japan, the Japanese Union of Scientists and Engineers has recorded many organization and employee benefits for QCs (Juran, 1967/1986). These include improving the company’s performance; worker self-improvement; employee recognition; creativity amid boredom; and monetary incentives for employees (Juran, 1967/1986). However, such data are based on self-reported evidence from QC operators.
Bradley and Hill (1983) undertook an empirical survey and interview process with 21 QCs (185 employees) from a British firm and six QCs (55 employees) from an American firm within the same corporation. Their study determined that employees wholeheartedly believed that they could con-tribute to production efficiency (94 and 95% respectively); had a greater awareness of their work environment (58 and 85% respectively); stated that their knowledge of the enterprise had increased (65 and 87% respectively); perceived management/labor relations to be improved (64 and 83% respec-tively); believed management to be more willing to listen to their ideas for improvement (54 and 52% respectively); and that they had more influence over work organization (76 and 90% respectively). On the negative side, 75 percent of long-serving employees reported that management withheld infor-mation. Also, there was evidence of a latent distrust with management reported as being similar between QC members and the control groups. Although statistical analyses of QC performance, such as that provided in this case study, are generally lacking in the literature, this research is employee perception based, and thus not objective.
Wood et al. (1983) suggest that the potential effects of QCs may extend to productivity, product quality, cost savings, worker morale, and atten-dance, whereas Shores and Thompson (1986) suggest that QC effectiveness can be measured through quality control, cost reduction, and attitude improvement. However, both sets of authors state that an empirical evalu-ation of QCs from a cross-section of organizevalu-ations is missing from the litera-ture. Wood et al. (1983: 49) state
For all the interest in the adoption of QCs in the U.S., it is ironic that this goes on in spite of a lack of reliable evidence that QCs are effec-tive either here or in Japan.
In 1987 Lawler et al. (1992) undertook a study on employee involvement practices and then repeated it in 1990. Lawler et al. (1992) found that quality circles were reported to be successful or very successful by 67% of respon-dents. By 1990, however, this rate had dropped to 52% of firms. These suc-cesses were identified in terms of a firm’s internal business conditions and the extent of impact on organizational performance measures. However, the results of this research are provided in terms of ‘employee involvement’ and do not discriminate between the various work practices investigated.1Thus, it is difficult to identify the effect of QCs alone. Further, we find that these data are based on management perception and thus are not objective.
In Australia, a survey of 2001 workplaces conducted in 1995 by More-head et al. (1997) identified workplace performance, improved product quality and customer satisfaction as the three most significant management objectives for introducing QCs. These objectives, however, are founded on managers’ perceptions for using QCs and do not establish whether QCs actually meet these objectives. Although there are many Australian cases in the literature citing the benefits, there is no corresponding large sample, cross-sectional empirical analyses to verify the claims.
Self-managing work groups
The first study of a self-managing work group was undertaken in 1963 (see Trist et al., 1993). Over the ensuing years the research has, in the main, remained case based with little empirical data provided to generalize find-ings. Thus, the benefits tend to be organization specific and anecdotal. Cohen and Ledford (1994) state, ‘overall there has been a paucity of high quality studies [on self-managing work groups.]’ Although a number of longitudinal studies has been published (Cordery et al., 1991; Wall & Clegg, 1981; Wall et al., 1986) and one quasi-experiment (Cohen & Ledford, 1994), they are all positioned within a single work organization and focus on employee-centered benefits as opposed to organizational benefits. In general, these studies suggest that SMWGs yield significant benefits in job satisfaction, worker motivation and work performance. The results are mixed for labor cost, employee turnover, absenteeism, and health and safety.
From an organizational perspective, Clifford and Sohol (1999) undertook a survey of SMWGs in thirty Australian manufacturing organiz-ations in 1998; however, they failed to provide any statistical evidence to support their findings. Accordingly, only one American study with cross-organizational data is available to provide some evidence for the organiz-ational benefits of teams.
American firms in 1987 and 1990 suggests that 60 percent of American users of SMWGs in 1990 believed that they were ‘successful’ or ‘very successful’. This was a 7 percent increase from 1987. However, these authors report their findings in a consolidated fashion, that is, they do not provide data for each work practice investigated. As such, it is difficult to discern the specific ben-efits of SMWGs alone. Further, these authors investigated such benben-efits from a management perception perspective, thus not obtaining objective data. Accordingly, their findings are biased given that managers generally under-take the implementation of such innovations on the basis that they will yield a result.
We have similar results from Morehead et al.’s (1997) survey of Aus-tralian work practices in 1995. Morehead et al.’s (1997) study revealed that the three most important objectives for implementing SMWGs for Australian management were increased productivity/efficiency/workplace performance (59%); improvements to product/service quality (36%); and increased client/customer satisfaction (36%); with all these objectives being organiz-ation centered. Employee-centered objectives included increased employee responsibilities/autonomy (32%), employee motivation (31%), enhanced skill levels (31%), improved communications (30%), and increased job satis-faction (30%). Similar to the American research, these results are based on management perception and do not determine if SMWGs actually achieve these objectives.
In sum, while many benefits have been cited for organizations and employees alike, the literature lacks consistent empirical evidence to support their widespread adoption.
Research method
Survey sample
To test the proposed benefits of teams the Australian Workplace Industrial Relations Survey for 1995 (AWIRS95), as published by Morehead et al. (1997), will be utilized. This survey was conducted by the Department of Industrial Relations on behalf of the Commonwealth of Australia. The survey provides a comprehensive data-set on a variety of workplace issues across the private and public sectors, 17 industries, and a range of organization sizes. Data from 2001 firms, identified from the Australian Bureau of Statistics register, comprise the data-set.
Data for this study were taken from the main survey that included four questionnaires – workplace characteristics, general management, employee relations and union delegate questionnaires. These questionnaires were
conducted via face-to-face interviews with the most senior manager in each workplace, with the workplace characteristics survey mailed ahead of the interview process to allow for data collection. See Morehead et al. (1997) for a full review of their methodology.
Using the AWIRS95 data-set limits this analysis to the structure of the available data. However, the cases provided are representative of approxi-mately 37,200 Australian firms, constituting the Australian workplace popu-lation. Thus, the potential exists for generalizing across all work organizations in Australia, thereby providing the first comprehensive survey on the benefits of teams in Australia.
Measurement decisions
Question items from various questionnaires within the AWIRS95 data-set will be utilized (see Table 1). Some variables required computation (see below) and most question items required the response order to be reversed to facilitate positive correlation.2
To measure the presence of QCs (QCS) and SMWGs (SMWGS) the first level of penetration to be assessed, as per Osterman (1994), is a yes/no response. Whereas Osterman went on to ask his respondents the degree to which employees were involved in these teams, no AWIRS95 data were available to reflect this information requirement. Thus, firms with minimal adoption cannot be distinguished from firms with extensive adoption of these team structures, as they both would have simply responded ‘yes’ to the question item. Although this presents a severe limitation, it will yield a pre-liminary assessment on the benefits of these team structures.
To measure the presence of both team structures (TEAMS), those cases in which respondents had recorded a ‘yes’ to the presence of both QCs and SMWGs, were regarded as having both team structures. All other cases were regarded as having no team structures.
To assess any differences based on adoption timing, we have incorpor-ated an analysis of early versus recent adoption trends. As such it was deter-mined that firms that were in the process of implementing either team structure might be undergoing ‘bedding’ down issues during the first two years (Mathews, 1994). Thus, the implementation date was utilized to measure those cases with a less than two-year implementation period. In addition, 165 cases having either team structures did not respond to this question item. It was assumed that those firms that were in the process of implementing either team structure would be cognizant of their implemen-tation date. Accordingly, all other cases, in which teams existed, were assumed to have a greater than two-year implementation date. As a result,
Glassop
The or
ganiza
tional benefits of teams
235
Table 1 Selection of question items for organizational benefit variables
Variable Question item Response
Quality circles (QCS) ‘Looking at the showcard, which of these, if any, are ‘F’ indicating ‘Quality Circles in place’. Scale was 2 for yes, currently in place at this workplace?’ 1 for no, –1 for don’t know.
Self-managing work groups (SMWG) ‘Looking at the showcard, which of these, if any, are ‘C’ indicating ‘Semi Autonomous Group in place’. Scale was currently in place at this workplace?’ 2 for yes, 1 for no, –1 for don’t know.
Both team structures (TEAMS) Computed as 2 for yes, 1 for no.
Implemented (IMPQCS, IMPSMWG) ‘In what year (were/was) the [semi/fully autonomous Metric value, converted to a scale of 2 for 2+ years, 1 for workgroup; quality circle] introduced here?’ < 2 years.
Implemented (IMPTEAMS) Metric value, converted to a scale of 3 for 2+ years, 2 for
mixed timing, 1 for < 2 years.
Labor productivity (PRODUCTIVITY) ‘Looking at the showcard, how would you generally ‘5, a lot higher’, ‘4, a little higher’, ‘3, about the same’, describe labor productivity at this workplace ‘2, a little lower’, or ‘1, a lot lower’.
compared with two years ago?’
Hierarchy (HIERARCHY) ‘How many employees worked at or from this Numerical response. workplace during the pay period ended on or
before 18 August 1995?’ and
‘How many employees were in each of the Numerical response for item ‘A’ which represented following occupational groups during the pay ‘managers’.
period ended 18 August 1995?’
Absenteeism (ABSENTEEISM) ‘On an average working day, what percentage of Numerical response. all employees here are typically away from work
or on sick leave without leave being approved in advance?’
tions 55(2)
Table 1 Continued
Variable Question item Response
Employee turnover (TURNOVER) ‘Looking at the showcard, could you estimate the Numerical response for each question item. percentage of employees that voluntarily resigned
from this workplace during the last year?’ and ‘How many employees worked at or from this workplace during the pay period ended on or before 18 August 1995?’
Industrial harmony (HARMONY) ‘Looking at the showcard, could you indicate which, ‘A’, ‘B’, ‘C’, ‘D’, ‘E’, ‘F’, ‘G’ see Footnote 4 for definitions. if any, of these have taken place at this workplace in Scale of 1 for yes and 2 for no computed to a collective
the last year?’ score.
Workplace performance (PROFIT) ‘In the last financial year, did this workplace make a ‘3, profit’, ‘2, break even’, ‘1, loss’ ‘-1, not applicable – pre-tax profit, break even or make a loss?’ administrative office only’.
two timing variables were created (IMPQCS and IMPSMWGS). The variable for both team structures (IMPTEAMS) required a slightly different analysis given that a mix of implementation timings could be present.
To measure labor productivity required data relating labor input to unit output. Data were not available from the AWIRS95 data-set to measure this. Thus, the item selected served as a proxy. By asking respondents for a com-parison with a previous period, the question item normalizes the response for all workplaces. Unlike Lawler et al. (1992), this item was not related to any specific work method, thus bias is reduced.
No data were available to test ‘product/service quality’. This benefit is constantly espoused yet no empirical data are available to determine its validity. Although Lawler et al.’s (1992) study suggests that firms enjoy improvements to product/service quality, their data are perception-based and not objective. Operationalizing ‘product/service quality’ for a cross-organizational study remains a challenge; although data regarding customer returns and production waste are typically regarded as the ‘cost of quality’ (Gilmour, 1991; Glassop, 1995). Future studies should attempt to empirically investigate this benefit.
A span of control measure was created to measure hierarchy. Both QCs and SMWGs, it was argued, could lead to a decreased level of supervision. This decreased level of supervision should be evident in the span of control allocated to ‘managers’. In addition, using a span of control measure allows for the results to be normalized across different organizational sizes, whereas a count of the levels within a hierarchy would be higher for large firms than small firms. The hierarchy scale was calculated by dividing the number of employees by the number of managers (Robbins et al., 1998). The broadest span of control (one manager to one worker) was set at one, with any deviation from this represented as a positive value. Accordingly, the higher the value, the flatter (or less hierarchical) the organization. The descriptive statistics for the hierarchy scale suggested that there were potential problems with the data given the maximum score of 1172 being some 19 standard deviations from the mean.3 Investigation via scatterplots and boxplots revealed four cases as extreme outliers. As such, these cases were removed from the data-set resulting in the maximum score being some nine standard deviations from the mean.
The methodology utilized by Lawler et al. (1992) to measure absen-teeism was deemed unsuitable as it asked respondents for their perception of absenteeism. The AWIRS95 item selected most closely approximated ‘avoid-able’ absenteeism, which relates to work motivation issues as required by this study (Erwin & Iverson, 1993).
Employee turnover was calculated utilizing the same procedure as
Morehead et al. (1997), by dividing the number of resignations by the number of employees for the year preceding the survey.
To measure industrial harmony an industrial harmony score was created according to a weighting of the severity of the industrial dispute type as identified by respondents.4Respondents could have multiple responses; as such their responses were aggregated. Calculation of Cronbach’s alpha for the seven items indicates that the scale has good internal consistency (alpha = .7965). Once the score was calculated it was reversed to represent the highest value as industrial harmony and the lowest value as the highest level of dispute. Only firms with unions present were included in the study, as the index relates to actions primarily instigated by such firms. Union presence was determined by a response to a question item requesting the number of unions present. For the purposes of this study, these data were converted to a simple yes/no response.
Measuring profit can require a complex array of sensitive data that firms are generally unwilling to provide. This study was attempting to utilize Lawler et al.’s (1992) approach in which it was deemed suitable, however, their measure of profitability asked respondents to identify levels of profit-ability in relation to the employee involvement methods being investigated. Thus, Lawler et al.’s question was biased. Although the item selected from AWIRS95 provided a simple and naive response to the notion of profit, it enabled a preliminary analysis of this variable.
As a result of the measurement decisions made, the data-set consists of six dependent variables and six independent variables. The AWIRS95 sam-pling technique utilized a stratification procedure based on organization size and industry sector. As a result the data-set has an over-representation of responses from larger organizations and some industry sectors. Thus, the data have been weighted according to the AWIRS95 procedure (Morehead et al., 1997). The descriptive statistics for the unweighted and weighted data are set out in Table 2. As a consequence the effective sample size is 1177 cases, as opposed to 2001. The SPSS software package has been utilized for the data organization and analysis.
Data limitations
There is a significant advantage in utilizing the AWIRS95 data-set given its large array of data. However, there are several issues specifically related to the quality of the data provided.
The quality of the data utilized to calculate ‘hierarchy’ is questionable. With 125 cases falling outside one standard deviation from the mean, and at least one case with a hierarchy ratio of 1:1172, the data for ‘manager’ require
evaluation. The definition for ‘manager’ may have been unclear and respon-dents might have provided varying responses. Alternatively, these outliers may be worthy of investigation in their own right. Also, a number of the question items offered to participants in the AWIRS95 were on a 3-point scale. A 5-point scale, as utilized by Lawler et al. (1992) and Osterman (1994) may have yielded more discrimination, and thus more powerful results.
Although the above has set out a number of areas in which the data utilized were less than satisfactory, the breadth of reach of the data-set – 2001 firms of varying sizes across seventeen industries and multiple sectors – has added to the generalizeability of the findings.
Analysis method
To determine if the these benefits are valid, the primary analysis method will be a hypothesis test on the means, given that the independent variables are dichotomous and that the dependent variables are either a 3-point scale or metric. This will result in ten tests for each variable with significance com-puted via a z-score. We will compare firms with team structures, implemented team structure in last two years and implemented team structure more than two years ago against firms with no team structures. The level of significance will be set at 5 percent.
Glassop The organizational benefits of teams 2 3 9
Table 2 Descriptive statistics
Unweighted Weighted
Variables N Mean SD N Mean SD Min. Max.
QCS 2001 1.07 .26 1177 1.05 .22 1 2 SMWGS 2001 1.34 .47 1177 1.35 .48 1 2 TEAMS 1181 1.15 .36 703 1.13 .34 1 2 IMPQCS 140 1.69 .46 60 1.73 .45 1 2 IMPSMWGS 680 1.72 .45 414 1.75 .43 1 2 IMPTEAMS 181 2.27 .86 93 2.38 .83 1 4 PRODUCTIVITY 1949 4.06 .88 1133 4.02 .91 1 5 HIERARCHY 1774 31.67 43.24 1063 25.33 32.11 1.29 425.00 ABSENTEEISM 1403 2.78 2.77 797 2.60 2.52 .00 50.00 TURNOVER 1765 12.80 16.34 1051 12.67 16.42 .00 214.29 HARMONY 816 9.95 1.99 816 9.95 1.99 1 11 PROFIT 1281 2.58 .75 743 2.57 .75 1 3
Results
This section presents the results of the means tests for each team structure (see Tables 3–5). The following section will provide a cumulative discussion of the findings.
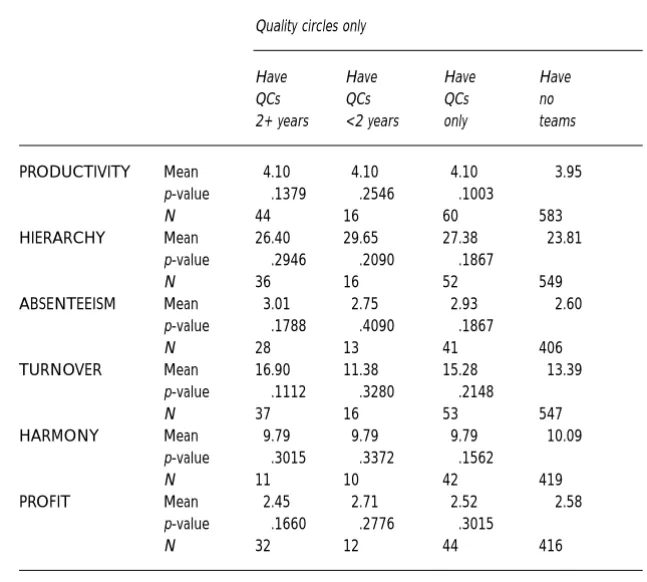
Firms that have quality circles only
The data provide no insight, at 5 percent significance, into the benefits of quality circles for Australian firms. However, there is some evidence that labor productivity is higher for firms with quality circles only (mean = 4.10, p < 11%) than firms with no team structures (mean = 3.95). Further, there is some indication that industrial harmony is lower for firms with QCs only
Table 3 Means test results for quality circles only
Quality circles only
Have Have Have Have
QCs QCs QCs no
2+ years <2 years only teams
PRODUCTIVITY Mean 4.10 4.10 4.10 3.95 p-value .1379 .2546 .1003 N 44 16 60 583 HIERARCHY Mean 26.40 29.65 27.38 23.81 p-value .2946 .2090 .1867 N 36 16 52 549 ABSENTEEISM Mean 3.01 2.75 2.93 2.60 p-value .1788 .4090 .1867 N 28 13 41 406 TURNOVER Mean 16.90 11.38 15.28 13.39 p-value .1112 .3280 .2148 N 37 16 53 547 HARMONY Mean 9.79 9.79 9.79 10.09 p-value .3015 .3372 .1562 N 11 10 42 419 PROFIT Mean 2.45 2.71 2.52 2.58 p-value .1660 .2776 .3015 N 32 12 44 416 *p < .05; **p < .01.
(mean = 9.79, p < 16%). Thus, further investigation of these two variables seems warranted.
Firms that have self-managing work groups only
Firms that have SMWGs only tend to report higher levels of labor produc-tivity (mean = 4.09, p < 1%) than those firms that have no team structures (mean = 3.95). However, firms that have implemented SMWGs in the last two years show a significantly higher level of labor productivity (mean = 4.32, p < 1%) than those firms that have implemented SMWGs more than two years ago (mean = 4.02, p < 10%) or have no team structures at all (mean = 3.97). This could suggest that there are short-term productivity gains with the implementation of SMWGs, but labor productivity drops after a few
Glassop The organizational benefits of teams 2 4 1
Table 4 Means test results for self-managing work groups only
Self-managing work groups only
Have Have Have Have
SMWGs SMWGs SMWGs no
2+ years < 2 years only teams
PRODUCTIVITY Mean 4.02 4.32 4.09 3.95 p-value .0918 .0000** .0011** N 301 97 398 583 HIERARCHY Mean 26.97 24.7 26.46 23.81 p-value .0314* .3783 .0375* N 290 88 377 549 ABSENTEEISM Mean 2.61 2.30 2.53 2.60 p-value .4562 .1446 .3264 N 207 72 280 406 TURNOVER Mean 10.61 15.56 11.81 13.39 p-value .0038** .1151 .0409* N 281 90 371 547 HARMONY Mean 9.84 9.94 9.86 10.09 p-value .0294* .2546 .0222* N 213 73 286 419 PROFIT Mean 2.63 2.51 2.59 2.58 p-value .2061 .2266 .4207 N 156 67 223 416 *p < .05; **p < .01.
years. Overall, however, the argument that firms with SMWGs have higher labor productivity is supported with this result.
Firms that have SMWGs only have a broader span of control (mean = 26.46, p < 5%) than firms with no team structures (mean = 23.81), with this value increasing slightly after a two-year implementation period (mean = 26.97, p < 5%). The data are not significant for recent adopters. This con-firms the argument that con-firms with SMWGs are less hierarchical than con-firms with no team structures.
The data for absenteeism are not significant, thus the notion that firms that have SMWGs have lower levels of absenteeism is not substantiated with this evidence.
Firms that have SMWGs only have a lower level of employee turnover (mean = 11.81, p < 5%) compared with those firms with no team structures (mean = 13.84). However, employee turnover drops off considerably for Table 5 Means test results for both team structures
Both team structures
Have Have Have Have Have
2+ mixed <2 both no
years time years teams teams
PRODUCTIVITY Mean 4.05 4.23 4.10 4.10 3.95 p-value .2061 .0793 .2546 .0571 N 56 21 16 92 583 HIERARCHY Mean 26.32 37.86 24.82 28.84 23.81 p-value .2676 .0146* .4483 .0523 N 51 20 14 86 549 ABSENTEEISM Mean 2.80 2.34 2.68 2.66 2.60 p-value .2946 .3264 .4483 .4052 N 40 17 13 70 406 TURNOVER Mean 9.36 10.68 11.34 10.01 13.39 p-value .0571 .2451 .3342 .0418* N 47 20 13 80 547 HARMONY Mean 9.60 9.46 9.43 9.54 10.09 p-value .0495* .1515 .0853 .0089** N 42 10 16 69 419 PROFIT Mean 2.61 2.31 2.53 2.54 2.58 p-value .4052 .1093 .4129 .3409 N 38 12 11 61 416 *p < .05; **p < .01.
those firms that have implemented SMWGs more than two years ago (mean = 10.61, p < 1%). The data are inconclusive for recent adopters. This result supports the argument that firms with SMWGs have a lower level of employee turnover than firms with no team structures.
For firms with SMWGs only, industrial harmony (mean = 9.86, p < 5%) is lower than firms with no team structures (mean = 10.09). A further drop in industrial harmony is evident for firms that have implemented SMWGs more than two years ago (mean = 9.84, p < 5%). Again, the current implementation period yields no insight. Thus, the argument that firms with SMWGs have higher levels of industrial harmony is rejected with this result. The data for firm profitability are insignificant. Thus, Carnegie et al.’s (1993) findings that firms facing imminent financial demise are likely to undertake workplace innovations gains no support here.
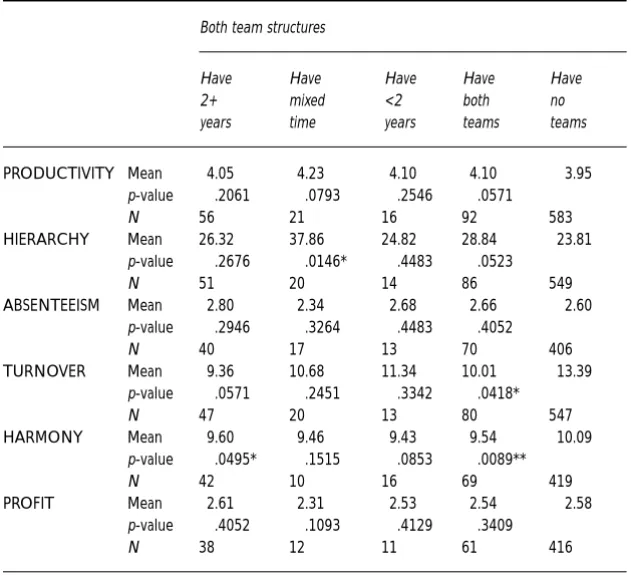
Firms that have both team structures only
The data are inconclusive, at 5 percent significance, for firms that have both team structures. However, there is some evidence that firms that have both team structures report a higher level of labor productivity (mean = 4.10, p < 6%) than firms with no team structures (mean = 3.95). Firms that report a mix of implementation period report a significantly higher level of labor productivity (mean = 4.23, p < 8%), although the reliability of this result is diminished with significance at less than 8 percent.
Firms that have both team structures have a larger span of control (mean = 28.84, p < 6%) than firms with no team structures (mean = 23.81). Firms with a mixed implementation period show a significantly flatter hier-archy (mean = 37.86, p < 5%) than firms with no team structures (mean = 23.81). Thus, there is evidence to suggest that firms with both team tures enjoy a flatter organizational structure than firms with no team struc-tures as argued.
The data for absenteeism are not significant. While Erwin and Iverson (1993) utilized team structures as a specific intervention strategy for reduc-ing absenteeism with some success, these results provide no support for their findings.
For firms that have both team structures in place, employee turnover is lower (mean = 10.01, p < 5%) compared with firms with no team struc-tures (mean = 13.39). This result is even more favorable given that it drops further for early adopters (mean = 9.36, p < 6%) compared with firms that have no team structures (mean = 13.39). Thus, the argument that firms with both team structures have a lower level of employee turnover than firms with no team structures is accepted with this evidence.
The presence of both team structures shows a marked decline in indus-trial harmony (mean = 9.54, p < 1%) compared with firms with no team structures (mean = 10.09). The early implementation timing suggests a slight improvement to industrial harmony (mean = 9.60, p < 5%) compared with the overall results (mean = 9.54, p < 1%), whereas a mixed implementation timing and recent implementation period yield little insight. The argument that firms with both team structures have higher levels of industrial harmony finds no support with this evidence.
The data for firm profitability are inconclusive at 5 percent significance. Again, Carnegie et al.’s (1993) finding that firms facing business difficulties are likely to adopt workplace innovations finds no support with this evidence.
Discussion of findings
Only 5.1 percent of Australian work organizations report the use of quality circles. With a sample of sixty firms we have been unable to determine the benefits of quality circles. Although labor productivity is one potential benefit, the lack of significant results may lend weight to our understanding of their low adoption rate when compared with SMWGs.
Quality circles were originally devised as a mechanism for training employees about monitoring the work system. The objective of quality circles is to focus on systems and procedures to reduce variation in the quality of output. Thus, devised as a ‘quality’-enhancing process, it is not surprising that the primary benefit is an improved level of productivity given that enhancing such processes eliminates waste and system downtime, although the evidence is slim. It should be noted, however, that this study has not been able to examine the impact of QCs on product/service quality.
Self-managing work groups only have been adopted by 35.2 percent of Australian firms. The results for this team structure indicate that there are benefits for organizations and employees alike. There is a marked benefit in labor productivity, a reduced management hierarchy and reduced labor turnover. This lends empirical support to the theoretical premises of redun-dancy of parts (eliminating system breakdown increases productivity) and redundancy of functions (improving system response time with devolved decision-making responsibility), together with improving the quality of work life for employees (as measured by turnover).
For employees, SMWGs seem to improve employment stability as indi-cated by a decrease in labor turnover. Absenteeism benefits, however, are inconclusive. The presence of SMWGs has a small negative impact on indus-trial harmony. This could be related to Australian firms tending to be heavily
unionized (Morehead et al., 1997). That is, the likelihood of industrial unrest might be higher when multiple unions are present. Future studies could deter-mine if the number of unions present significantly impacts industrial harmony.
Interestingly, we also find that firms that have implemented SMWGs recently have a significantly higher level of productivity. This could suggest that the initial interest in a new work structure acts favorably on this vari-able, however, we have no conclusive data about the maintenance of improved productivity over time. Further, for firms that have had SMWGs in place for more than two years we find that employee turnover is signifi-cantly lower and the span of control measure increases indicating a flatter structure for these firms. Thus, firms may continue to improve upon the initial benefits of SMWGs as their experience with the new work structure increases. However, we find that industrial harmony has eroded slightly. This may indicate that as employees strengthen their empowerment, their indus-trial ‘voice’ is heard more often. Longitudinal studies are needed to verify these claims.
The use of both team structures have been adopted by 7.8 percent of Australian firms and tends to reflect the results of SMWGs; although labor productivity and hierarchy are only significant at less than 6 percent. On the positive side, employee turnover is 1.8 percent lower than for firms with SMWGs only indicating that the more firms employ participation methods the more stable employees may become. However, on the reverse side, we see industrial harmony lower for firms with both team structures, although slightly better for firms that have had both team structures for more than two years.
Given the above, the argument that firms with SMWGs or both team structures have higher levels of industrial harmony than firms with no team structures is rejected. This is inconsistent with the case literature given that both team structures aim to increase employee involvement in workplace matters to improve industrial relations (Davis & Lansbury, 1996). This result could suggest that team structures are potentially raising employee expec-tations for involvement in work matters that are unrealized. Alternatively, it could be that industrial harmony is impacted by factors other than work structure, for example, pay and conditions. Further investigation is war-ranted.
In sum, the results suggest that firms with self-managing work groups and both team structures benefit from increased workplace productivity and a reduced management hierarchy. Employee benefits, to the extent that they are examined here, may be less forthcoming; although there is good evidence
that firms with SMWGs and both team structures have a lower level of employee turnover. Firms with team structures, however, seem to have a reduced level of industrial harmony compared with firms with no team struc-tures. This study has failed to empirically determine the benefits of quality circles.
Conclusion
This study has investigated the organizational benefits of team structures for Australian work organizations. Two formal team structures were identified from the literature, namely quality circles (QCs) and self-managing work groups (SMWGs). Both these team structures enjoy good adoption rates within Australia with 13 and 43 percent of organizations, respectively, reporting their use (Morehead et al., 1997).
The literature on teamwork is primarily case-based, with little empiri-cal evidence identifying adoption patterns nor examining, via a large sample, the benefits espoused. From the literature six organizational benefits were identified. To test these benefits the AWIRS95 data-set was utilized.
The primary benefit of team structures for firms is higher labor produc-tivity, a flatter management structure (except firms with QCs only) and a decrease in employee turnover (except firms with QCs only) compared with firms with no team structures. However, the presence of team structures indi-cates a decline in industrial harmony.
Team structures have been advocated as a win–win strategy for firms and employees alike. This study shows that adopting team structures can yield benefits for firms (via increased labor productivity and a flatter manage-ment structure) and employees (via decreased labor turnover).
Notes
1 These employee involvement practices include survey feedback, quality circles, par-ticipation in groups other than QCs, union-management, QWL committees, job enrichment or redesign, self-managing work teams and mini-enterprise units. 2 This procedure has been used by other researchers utilizing this same dataset (see
Harley, 1999).
3 This score suggests that there is one manager for every 1172 employees.
4 No previous research has been identified attempting to create such a score. Thus, the author has adopted a weighting based on the perceived levels of disruption to a firm for each type of dispute – strikes, 2; stop work meetings, 2; overtime bans or restrictions, 1; go slow, 1; picketing, 1; work to rule, 1; and other bans, 1.
References
Armstrong, A. Using assessment centers to select team leaders. Asia-Pacific Journal of Human Resources, 1998, 35(2), 65–79.
Berger, R.W. & Shores, D.L. (Eds) Quality circles: Selected readings. New York: Marcel Dekker, 1986.
Blakemore, J. Quality habits of best business practice. Sydney: Prentice Hall, 1996. Bradley, K. & Hill, S. After Japan: The quality circle transplant and productive efficiency.
The Journal of Industrial Relations, 1983, 25(1), 291–311.
Callus, R., Morehead, A., Cully, M. & Buchanan, J. Industrial relations at work: The Aus-tralian workplace industrial relations survey. Commonwealth Department of Industrial Relations, Canberra: AGPS, 1991.
Carnegie, R., Butlin, M., Barratt, P., Turnbull, A. & Weber, I. Managing the innovating enterprise: Australian companies competing with the world’s best. Melbourne: Business Council of Australia 1993.
Clifford, G.P. & Sohol, A.M. Developing self-directed work teams. Management Decision, 1999, 36(2), 77–84.
Cohen, S. & Ledford, G.E. The effectiveness of self-managing teams: A quasi-experiment. Human Relations, 1994, 47, 13–43.
Cordery, J.L. Work redesign: Rhetoric or reality. Asia-Pacific Journal of Human Resources, 1995, 32(2), 3–19.
Cordery, J.L., Mueller, W.S. & Smith, L.M. Attitudinal and behavioral effects of auton-omous group working: A longitudinal field study. Academy of Management Journal, 1991, 34, 464–76.
Davis, E. & Lansbury, R. (Eds) Managing together: Consultation and participation in the workplace. Melbourne: Longman Cheshire, 1996.
Diamond, M.A. Stresses of group membership: Balancing the need for independence and belonging. In M.F.R. Kets de Vries (Ed.), Organizations on the couch. San Francisco, CA: Jossey-Bass, 1991.
Emery, F.E. Characteristics of socio-technical systems. In L.E. Davis and J.C. Taylor (Eds), Design of jobs. Harmondsworth: Penguin, 1972.
Emery, F.E. Characteristics of socio-technical systems. In E. Trist and H. Murray (Eds), The social engagement of social science: A Tavistock anthology (Vol. II). Philadelphia: Uni-versity of Pennsylvania Press, 1993.
Emery, F. & Emery, M. Participative design: Work and community life. In Center for Continuing Education Occasional Paper No. 4. Canberra: The Australian National Uni-versity, 1974.
Emery, F. & Emery, M. Participative design: Work and community life. In M. Emery (Ed.), Participative design for participative democracy. Canberra: Center for Continuing Education, The Australian National University, 1993.
Emery, M. (Ed.) Participative design for participative democracy. Canberra: Center for Continuing Education, The Australian National University, 1993.
Erwin, P.J. & Iverson R.D. Strategies in absence management. Asia-Pacific Journal of Human Resources, 1993, 32(3),13–32.
Gilmour, P. Operations management in Australia. Melbourne: Longman Cheshire, 1991. Gilmour, P. & Hunt, R.A. Total quality management: Integrating quality into design,
oper-ations and strategy. Melbourne: Longman Cheshire, 1995.
Glassop, L.I. The road to quality: Turning effort into reward. Sydney: Prentice Hall, 1995. Greiner, M., Kask, C. & Sparks, C. Comparative manufacturing productivity and unit labor
cost. Monthly Labor Review, February 1995.
Griffiths, A. Sociotechnical interventions and teams in Australian organisations: 1970s–1990s. Center for Corporate Change Working Paper No. 52. Sydney: Australian Graduate School of Management, University of New South Wales, 1997.
Hackman, J.R. & Oldham, G.R. Work redesign. Reading, MA: Addison-Wesley, 1980. Harley, B. The myth of empowerment: Work organization, hierarchy and employee
auton-omy in contemporary Australian workplaces. Work, Employment and Society, 1999, 13(1), 41–66.
Hillkirk, J. Self-directed work teams give IT a lift. USA Today, 20 December 1993, 57–70. Horngren, C.T., Foster, G. & Datar, S.M. Cost accounting: A managerial emphasis (6th
edn). Englewood Cliffs, NJ: Prentice Hall, 1997.
Ishikawa, K. What is total quality control? The Japanese way. (Translated by D.J. Lu.) Englewood Cliffs, NJ: Prentice Hall, 1985.
Juran, J.M. The QC circle phenomena. In R.W. Berger and D.L. Shores (Eds), Quality circles: Selected readings. New York: Marcel Dekker, 1967/1986.
Juran, J.M. & Gyrna, F.M. Quality planning and analysis: From product development through use (2nd edn). New York: McGraw-Hill, 1980.
Kaplan, R.S. & Norton, D.P. The balanced scorecard: Measures that drive performance. Harvard Business Review, 1992, 70(1), 71–9.
Lawler, E.E., Morham, S.A. & Ledford, G.E. Employee involvement and total quality management: Practices and results in Fortune 1000 companies. San Francisco, CA: Jossey-Bass, 1992.
McGraw, P. & Dunford, R. Quality circles, employee participation and industrial relations: A study in Australian industry. Employee Participation Report, Department of Employ-ment and Industrial Relations. Canberra: AGPS, 1987.
Manz, C.C. & Sims, H.P. The potential for ‘groupthink’ in autonomous work groups. Human Relations, 1982, 35, 773–84.
Manz, C. & Sims, H.P. Leading workers to lead themselves: The external leadership of self-managing work teams. Administrative Sciences Quarterly, 1987, 32, 106–28. Mathews, J. Catching the wave: Workplace reform in Australia. St Leonards, NSW: Allen
and Unwin, 1994.
Morehead, A., Steele, M., Alexander, M., Stephen, K. & Duffin, L. Changes at work: The 1995 Australian workplace industrial relations survey. Melbourne: Longman, 1997. Orsburn, J.D. & Moran, L. The new self-directed work teams: Mastering the challenge.
New York: McGraw Hill, 2000.
Osterman, P. How common is workplace transformation and who adopts it? Industrial and Labor Relations Review, 1994, 47, 173–88.
Pearce, J.A. II & Ravlin, E.C. The design and activation of self-regulating work groups. Human Relations, 1987, 40(11), 751–82.
Robbins, S.P., Millet, B., Cacioppe, R. & Waters-Marsh, T. Organizational behavior: Leading and managing in Australia and New Zealand (2nd edn). Sydney: Prentice-Hall, 1998.
Shewhart, W.A. Economic control of quality of manufactured product. New York: D. Von Nostrand, 1931.
Shores, D.L. & Thompson, M.C. A historical perspective: Japan and the United States. In R.W. Berger and D.L. Shores (Eds), Quality circles: Selected readings. New York: Marcel Dekker, 1986.
Sundstrom, E., De Muse, K.P. & Futrell, D. Work teams. American Psychologist, 1990, 45(2), 120–33.
Trist, E. Introduction to volume II. In E. Trist, and H. Murray (Eds), The social engage-ment of social science: The socio-technical perspective (Vol. II). Philadelphia: University of Pennsylvania Press, 1993.
Trist, E., Higgin, G., Murray, H. & Pollock, A. Alternative work organizations: An exact comparison (1963). In E. Trist and H. Murray (Eds), The social engagement of social science: The socio-technical perspective (Vol. II). Philadelphia: University of Pennsylva-nia Press, 1993.
Wall, T.D. & Clegg, C.W. A longitudinal field study of group work redesign. Journal of Occupational Behavior, 1981, 2(31), 31–49.
Wall, T.D., Kemp, N.J., Jackson, P.R. & Clegg, C.W. Outcomes of autonomous work-groups: A long-term field experiment. Academy of Management Journal, 1986, 29(2), 280–304.
Weisbord, M. Productive workplaces. San Francisco, CA: Jossey-Bass, 1987.
Wood, R., Hull, F. & Azumi, K. Evaluating quality circles: The American application. Cali-fornia Management Review, 1983, XXVI(1), 37–53.
Zaiger Roberts, V. The organization of work: Contributions from open systems theory. In A. Obholzer and V. Zaiger Roberts (Eds), The unconscious at work. London: Rout-ledge, 1994.
Glassop The organizational benefits of teams 2 4 9
Linda I. Glassop is currently a doctoral student within the Department
of Social Inquiry in the Faculty of Arts at Deakin University, Melbourne, Australia. Her research interests include workplace democracy, employee involvement, organizational learning, motivation and systems theory. [E-mail: lglassop@optusnet.com.au]