A Cross-Country Exploration of Math-Related Learning in
the United States, England, and Singapore:
Parent Perceptions and Practices Regarding Math
Education During the Middle School Years
The following paper represents key fi ndings from a 2010 survey of 1,144 parents of children ages 10-14 regarding math attitudes, beliefs, and behaviors. The results will be of interest to educators, parents, the public, and those dedicated to promoting pathways to college and careers in science, technology, engineering, and math (STEM).
workforce to create the solutions that serve its global customer base. To that end, Raytheon is committed to investing in and developing students and employees with diverse talent in the areas of science, technology, engineering, and mathematics (STEM).
Research suggests that the United States will not graduate enough college students with STEM degrees in the future. Of the 1.57 million U.S. high school graduates in 2010 who took the ACT college entrance exam, only 43% met the mathematics “College Readiness” benchmark, defi ned as a 50% chance of earning a “B” or higher in fi rst-year college algebra.1 But graduates who
completed more than three years of mathematics while in high school were four times more likely to meet the benchmark—indicating a great opportunity to keep students engaged and enrolled in math learning. Students—particularly those of middle school age—tend to lose interest in math and therefore fail to pursue advanced STEM education or careers. Through its MathMovesU® program, established in 2005, Raytheon aims to increase middle school students’ interest in math and science education by engaging them in hands-on, interactive activities.
Since 1995, a representative sample of U.S. students in grades 4 and 8 have participated in the Trends in International Mathematics and Science Study (TIMSS), which allows for certain international comparisons in student math performance. Raytheon believes it is important to understand why some regions of the world consistently produce highly capable STEM students or signifi cant test score gains. To this end, Raytheon commissioned Eduventures, an independent research fi rm focused on the fi eld of education, to conduct an international study of the
behaviors of parents and students in three countries: the United States, Singapore, and England.
To gain a deeper look into the infl uencers and out-of-school math experiences of adolescents, Raytheon determined that parents would be a rich and relatively untapped source of data. Across cultures and countries, we hypothesized that relevant differences in parent data might exist—differences that could help inform how to engage and motivate students in the study of mathematics. We also view today’s parents as the most important infl uencers along the pathway of students’ college and career choices.
We invite you to share this study as well as your thoughts and comments.
1 ACT. The Condition of College and Career Readiness, 2010. http://www.act.org/research/policymakers/cccr10/pdf/ ConditionofCollegeandCareerReadiness2010.pdf
Eduventures, Inc.
101 Federal Street 12th Floor Boston, MA 02110 617-426-5622 www.eduventures.com info@eduventures.comRaytheon Company
870 Winter Street Waltham, MA 02451 781-522-3000 www.raytheon.com corporate-pr@raytheon.comRESEARCH PROJECT
TEAM MEMBERS
LIA SCHULTZ ERIC BASSETT TIM MANN CLAIRE ARENA PAUL KIMInternational Parent Perspectives on Math-Related Learning among Students Ages 10-14
SUMMARY AND KEY TAKEAWAYS
In-country Findings: United States
◆ To solve the world’s most pressing technological, environmental, and economic issues, the global
community must cultivate a pipeline of talented students who will pursue degrees and careers in the areas of science, technology, engineering, and mathematics (STEM). The nation faces a key challenge in that other countries often outperform the United States when it comes to consistently preparing top-performing students in the area of mathematics.
◆ The middle school years are a crucial time for engaging students in math learning, and parents play a key
role in supporting math education. Among U.S. parent respondents, 77% provide outside-of-school math help to their children; when family help is provided, the support is most commonly 1-2 hours per week.
◆ More than half of U.S. parents believe they have high ability to help their children with fractions, division,
and math word problems. Seventy-two percent agree they “know the level of math education my child needs to succeed in college.” Yet, evidence suggests U.S. parents may be overly confi dent or lacking in the use of accurate metrics around math performance and college preparedness. For example, 78% of U.S. parents report their children’s math performances are in the top 20% compared to peers in school.
International Findings: United States, England, and Singapore
◆ In Singapore, 42% of parents report the use of tutors for math help among students ages 10-14; in the United States only 10% use math tutors.
◆ Parents in the United States may feel more equipped to help their children because math levels may not advance as rapidly as in comparison countries. In the United States, parents report students begin to learn multiplication of numbers at about age 7 (mean age 6.8), but in Singapore students begin to learn at age 6 (mean age 6.1). By the time Singapore students reach grades 5-8, they are exposed to advanced levels of math that often exceed parent ability to provide instruction.
◆ Parents in Singapore receive more instruction from educators about how to help their children with math.
Only 25% of parents in the United States and England say they receive instructional information to better help them prepare their children for math tests compared to 51% of parents in Singapore.
◆ One third of students in Singapore participated in math competitions. Comparatively, 20% of England students and only 9% of U.S. students participated in math competitions in the past 12 months.
◆ Across the board, children in Singapore are more actively engaged in math-related learning, including the use of math worksheets, workbooks, or assessment books not assigned through school, math competitions, robotics fairs/competitions, and camps focused on math or science. Ninety-two percent of Singapore students are engaged in some form of out-of-school math learning, while less than half of students in the U.S. and England receive supplementary math instruction.
BACKGROUND AND COUNTRY SELECTION
This study originates in the United States and is approached through the lens of increasing the number of students qualifi ed to study and succeed in higher-level mathematics—especially the levels required for careers in science, technology, engineering, and math fi elds.
As a backdrop to the study, test scores from the Trends in International Mathematics and Science Study (TIMSS) were used to inform the choice of two comparative countries to the United States. Relatively few international math performance benchmarks exist for the target population of students age 10-14, so the TIMSS was a natural choice due to its focus on 4th and 8th-grade student cohorts. Countries were fi rst considered for target population size and accessibility. Literature reviews and interviews of in-country math experts were then conducted to further narrow the choice of countries to the following:
Singapore: A Top-Performing Nation in Mathematics
The country of Singapore was selected due to its success in consistently cultivating a top-performing student body in mathematics. Additionally, Singapore’s strengths in math teaching and curriculum have become a recent infl uence on K-8 curricular practices in the United States, with thousands of U.S. students now learning through Singapore math textbooks or practices (developed through Singapore’s Ministry of Education).
England: Similar in Math Performance
The country of England was selected due to its historic infl uence on education globally and its similarities to the United States.
The United States: Striving for Increases in Math Performance
The United States has made modest gains in math performance as measured by the TIMSS but remains near the bottom of industrialized nations in math performance. The next examination year for the TIMSS is 2011.
Apart from policy makers, government offi cials, and those with an eye to international comparisons, the TIMSS receives relatively low attention among educators and families. Signifi cantly more emphasis is placed on in-country exams related to high school admission, high school graduation, and college admissions—all of which include math testing.
While major policy and curricular changes have undoubtedly infl uenced test-score fl uctuation in many countries, this study does not seek to focus on in-depth analysis of curriculum, policy, and testing practices. Rather, this study sets out to gather much-needed data about what happens behind the scenes—among parents and their children—when “math” or “maths”2 instruction
and values are shaped outside and in relation to the classroom.
2 All survey instruments were localized to ensure accuracy of language and data by country. While relatively few words needed to be “localized,” the questions represented in this report are those from the U.S. survey instrument.
“Our nation displays an
acceptance for math illiteracy
that you just don’t see in
other parts of the world. No
one would proudly say ‘I can’t
read,’ but Americans can be
quick to utter the words, ‘I
International Parent Perspectives on Math-Related Learning among Students Ages 10-14
MATH PERFORMANCE BY COUNTRY
Table 1. Math Test Scores on the Trends in International Mathematics and Science Study (TIMSS) TIMSS Average Math Scores3
Top 20 Participating Countries in Past Decade 8th-Grade Population 1999 2003 2007 Singapore 604 605 593 South Korea 587 589 597 Taiwan 585 585 598 Hong Kong 582 586 572 Japan 579 570 570
Belgium (Flemish schools only) 558 537
Netherlands 540 536 Slovak Republic 534 508 Hungary 532 529 517 Canada 531 Slovenia 530 493 501 Russian Federation 526 508 512 Australia 525 505 496 Finland 520 Czech Republic 520 504 Malaysia 519 474 Bulgaria 511 476 464
Latvia (Latvian speaking schools only) 505
United States 502 504 508
England 496 513
TIMSS scale average 500 500 500
The eighth-grade TIMSS mathematics assessment covers the content domains of algebra, numbers, data and chance, and geometry as well as the cognitive domains of mathematical knowing, applying, and reasoning. The majority of students are age 13 when they participate in the examination. In 2007, the United States met guidelines for sample participation rates only after substitute schools were included. In 2003, England participated in the 8th-grade TIMSS but did not meet sample guidelines.3
3 Highlights From TIMSS 2007: Mathematics and Science Achievement of U.S. Fourth and Eighth-Grade Students in an International Context, (2009) and NCES TIMSS data charts.
◆
◆ ◆
In 8th-grade mathematics, the United States is one of the lowest performing industrialized nations among those participating in the Trends in International Mathematics and Science Study (TIMSS).
United States
England
Singapore
SURVEY METHODOLOGY
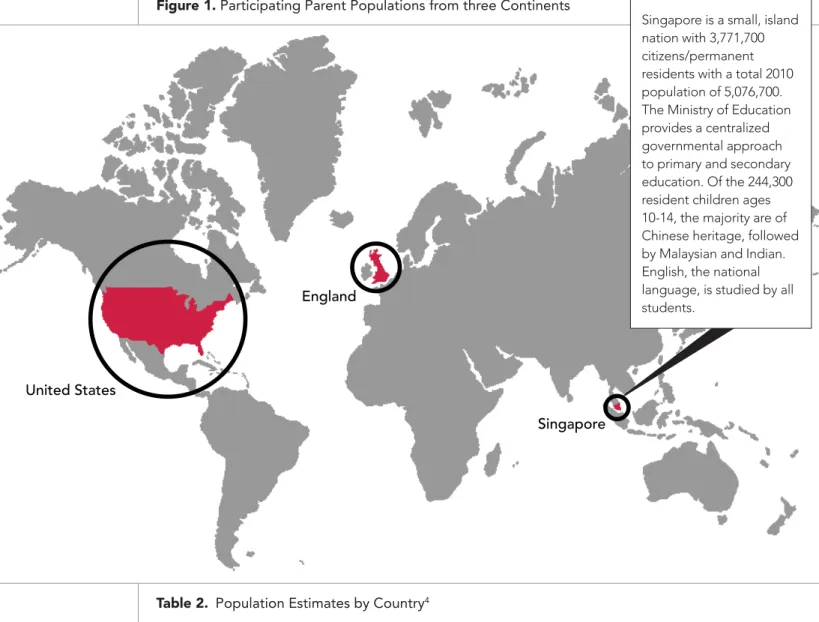
In October 2010, a total of 1,144 parents of middle-school age students responded to a Web-based survey containing 110 items related to math education, homework and activities related to math, and preparedness for college and careers. The study was designed to allow cross-country comparison of parent information from three countries of focus: the United States, England, and Singapore. A balanced number of responses were obtained from parents with children ages 10, 11, 12, 13 or 14. Parent respondents had an email address, regular access to a computer, and were most typically preparing their child for a college-bound path. Due to the differing population size of each country, more responses were obtained from countries with larger populations (561 from United States; 311 from England; 272 from Singapore).
Figure 1. Participating Parent Populations from three Continents
Table 2. Population Estimates by Country4
Resident-Only Population Estimates U.S. England Singapore
Total Population of Country 310,501,940 51,809,700 3,771,700 Ages 10-14 Population 21,114,131 3,016,500 244,300 Percentage of Population Ages 10-14 6.8% 5.8% 6.8% 4 U.S. Census Bureau PopClock Projection for October 17, 2010 and American Community Survey (ACS) data; U.K. Offi ce for National Statistics 2009
data; Singapore Department of Statistics 2010 Mid-year Estimates from Population Trends 2010.
Singapore is a small, island nation with 3,771,700 citizens/permanent residents with a total 2010 population of 5,076,700. The Ministry of Education provides a centralized governmental approach to primary and secondary education. Of the 244,300 resident children ages 10-14, the majority are of Chinese heritage, followed by Malaysian and Indian. English, the national language, is studied by all students.
International Parent Perspectives on Math-Related Learning among Students Ages 10-14
PARENT EDUCATION LEVELS
The majority of parents participating in this study had some post-secondary educational experience. Of U.S. respondents, 59% earned a bachelor’s degree or higher; among England respondents, 52% earned a bachelor’s degree or higher; of Singapore respondents, 40% earned a bachelor’s degree or higher and 14% earned a polytechnic diploma (typically requiring advanced mathematics as a program requirement).
Table 3. Parents’ Level of Education
Highest Level of Education U.S. England Singapore
Some secondary school/high school, but no diploma 1% 1% 10%
Secondary/High school diploma or equivalent 7% 16% 14%
Vocational/technical/junior college certifi cate, diploma, or degree 6% 10% 17%
Associate’s degree 6% 10% 0%
Polytechnic diploma 0% 5% 14%
Some college but no degree 20% 6% 3%
Bachelor’s degree 31% 26% 24%
Some graduate or professional school, but no degree 5% 5% 3%
Master’s degree (MA, MS, MBA, etc.) 17% 11% 13%
Graduate-level law degree (JD, Master of Laws) 2% 1% 0%
Doctoral Degree (MD, Ph.D., etc.) 4% 5% 0%
The data presented in Table 5 is a representation of respondents’ memories of their own math learning, as they are capable of labeling or categorizing it in curricular terms, and may be helpful to readers as a baseline in understanding parent engagement in math learning.
Table 4. Parents’ Math Training Received in High School or College
Percentage of Parents Who Report Studying Area of Math
Level of Math Studied by Parent Respondent U.S. England Singapore
Algebra 75% 80% 73% Geometry 67% 77% 64% Pre-algebra 50% 48% 36% Calculus 48% 55% 44% Trigonometry 47% 69% 48% Statistics 42% 63% 57% Accounting or fi nance 34% 22% 39% Advanced calculus 26% 18% 22%
Advanced mathematics for my major fi eld of study 15% 12% 25%
Discrete mathematics 7% 7% 17%
Parent education credentials in this study are representative of those held by parents of today’s college-enrolled population in each country.
Singapore parents were less likely to study pre-algebra at the high school or college level, due to the increasingly advanced national math curriculum.
OCCUPATIONS AND PREDICTED PATHS OF STUDY
Table 5. Parent Occupations
Top 10 Reported Occupations U.S. England Singapore
Business/management/fi nancial 25% 28% 23% Sales 11% 4% 13% Computers/information technology 9% 10% 8% Education 8% 10% 6% Engineering 8% 7% 11% Government/public sector 7% 6% 7% Medicine/health services 7% 11% 3% Homemaker 6% 7% 16% Construction 4% 1% 3% Law/legal 3% 2% 1%
Table 6. Top Ten Predicted Paths of Study for Children
Child’s Likely Area of Study U.S. England Singapore
Medicine or health services 15% 8% 9%
Visual, performing, or creative arts (e.g., music, dance, theater, fi lm) 14% 17% 13%
Engineering 11% 10% 13%
Business/management 11% 13% 14%
Natural sciences (e.g., chemistry, biology, physics) 10% 10% 9%
Education 9% 6% 8%
Behavioral and social sciences (e.g., economics, political science,
psychology, communication, social work) 5% 2% 6%
Law 5% 7% 4%
Quantitative sciences (e.g., math, computer science) 4% 6% 9%
Humanities (e.g., English, philosophy, history) 3% 6% 6%
At the middle-school stage, U.S. parents predict 25% of students will pursue engineering, natural science, math, or computer fi elds and an additional 15% will pursue pre-med or health-related paths. By high school, only about 17% of students will have high profi ciency and interest in STEM majors.5
5 ACT. The Condition of College and Career Readiness, 2010.
http://www.acto.org/research/policymakers/cccr10/pdf/ConditionsofCollegeandCareerReadiness2010.pdf
“As an electrical and mechanical engineer,
I use myself as an example of how I am
required to use mathematics every day and
how important it is in my career. My son
also wants to be an engineer so to fulfi ll his
ambitions he needs to be competent and
comfortable using math.”
Key Findings
Even though modern schools now provide
extensive instruction during an increasingly
expanding school day and growing school year in
several nations, many students and their families
further add to that through a host of shadow
education activities—structured, outside-school
activities for improving students’ mathematics
achievement categorized as a mix of both
remedial and enrichment strategies.
66 Baker, Akiba, LeTendrew, and Wiseman. “Worldwide Shadow Education: Outside-School Learning, Institutional Quality of Schooling, and Cross-National Mathematics Achievement.” Educational Evaluation and Policy Analysis (2001).
PARENT PERCEPTIONS REGARDING MATH LEARNING
U.S. parents of middle-school age children express moderate levels of confi dence in understanding their children’s pathways to college. While only one third strongly agree, 72% percent of U.S. parents say they “know the level of math education my child needs to succeed in college,” (see Figure 2). U.S. parents are even more confi dent about their general knowledge of a pathway to college acceptance for their children—78% agree that they “know the steps my child must achieve to get into college.” England and Singapore parents present similar patterns regarding knowledge of college preparation, but with somewhat lower levels of confi dence expressed.
Figure 2. Parent Knowledge of College Readiness Pertaining to Math
36% Singapore U.S. England 0% 10% 20% 30% 40% 50% 60% 70% 80% 90% 100% 32% 40% 72% 62% 26% 47% 16% 63%
I know the level of math education my child needs to succeed in college.
Singapore England U.S. Strongly
Agree Agree
More than 80% of U.S. parents say “doing well on math exams is extremely important,” but only half are willing to agree that “without top math scores my child won’t get into a good college.”
Table 7. Parent Agreement with Math-related Views
Percentage of Parents who Agree or Strongly Agree with Statement about Math
Statement U.S. England Singapore
Math is useful. 92% 87% 83%
Math is important for a successful career. 82% 78% 73%
Doing well on math exams is extremely important. 82% 73% 72%
I use math in my job or daily life. 78% 72% 64%
Without top math scores my child won’t get into a good college. 52% 42% 63%
Math is fun. 45% 36% 54%
Math is hard. 20% 20% 42%
I wasn’t very good at math when I was in school. 20% 23% 34%
Parents need information about math preparedness as it relates to admission into and success in STEM majors.
U.S. parents widely agree math is useful, important, and relevant in daily life. U.S. and England parents are only half as likely as Singapore parents to agree “math is hard.”
International Parent Perspectives on Math-Related Learning among Students Ages 10-14
PARENT DRIVERS RELATED TO MATH LEARNING
Table 8. What is Important to Parents?
Percentage of Parents Rating Important or Very Important
Factor or Outcome Related to Math U.S. England Singapore
Quality of math instruction my child receives in school 99% 96% 88%
Math test preparation for acceptance into college 88% 79% 77%
Math test preparation for acceptance into high school 80% 71% 79%
My child’s earning potential in his/her career 78% 64% 75%
Ranked math performance of my child compared to peers 69% 56% 64%
Quality of math instruction my child receives after school (in a
special program, private institute, at home, etc.) 67% 52% 81%
Providing math learning opportunities for my child outside of
school curriculum 60% 54% 75%
My child’s standing in society based on his/her career 53% 49% 74%
U.S. parents prioritize college test preparation as an important form of supplemental math instruction— perhaps because it is readily available for high stakes college entrance exams such as the ACT and SAT. U.S. parents are also somewhat more likely to indicate that earning potential is important in their children’s career paths. When forced to rank earning potential, math ranking among peers, test scores resulting in acceptance into a top college, and preparedness for high school and college math curriculum, parents across all three countries widely rank “preparedness for high school and college math” as number one in importance.
U.S. and England parents place highest importance on in-school instruction, while Singapore parents place nearly equal importance on in-school and out-of-school math learning.
“My child has ADHD and keeping
him interested is important.
He loves games. We attempt to
make math homework fun by
turning it into a game.”
- U.S. parent
PARENT ABILITY TO PROVIDE MATH HELP
Parents in the United States express greater confi dence in their ability to help with math, as compared to parents in England and Singapore. Yet, only 45% of U.S. parents report a high ability to help with algebra problems and only 37% report a high ability to help with geometry problems—two key areas around which middle-school math curricula are built. More than 90% of U.S. parents report high ability to help with addition, subtraction, multiplication, and division. But, even in these areas, U.S. parents express concern: “I’d like to see an easier process to do division and multiplication…the new ways my child is taught to do these are much too diffi cult.”
Table 9. Parent’s Reported Ability to Help Child with Math
Percentage of Parents who Report High Ability to Help
Type of Math Problem U.S. England Singapore
Addition and subtraction of numbers 96% 82% 67%
Multiplication or division 93% 77% 63%
Decimals 79% 61% 48%
Fractions 73% 57% 45%
Math Problems Requiring Use of a Calculator 67% 56% 31%
Math Word Problems 56% 41% 27%
Algebra 45% 33% 26%
Geometry 37% 33% 31%
Parents may be overly confi dent or lacking in the use of accurate metrics regarding math performance and college preparedness. Seventy-eight percent of U.S. parents report their children’s math performances are in the top 20% compared to peers in school.
Table 10. Parent-reported Math Performance of Child Compared to Peers
Percentage of Parents Describing Child’s Math Performance as Top 20%
U.S. England Singapore
78% 76% 61%
Parent ability to provide math help decreases as the level of math diffi culty increases. Instructional materials can enhance at-home learning and increase the number of parents who can provide math help.
Parents need meaningful metrics regarding their children’s math abilities that help them interpret and act upon math performance data.
International Parent Perspectives on Math-Related Learning among Students Ages 10-14
GENERATIONAL SHIFTS IN MATH CURRICULUM
Two thirds of U.S. parents acknowledge that math assignments have changed since they were in school; an even higher number of parents in England and Singapore agree that math assignments have changed. At the elementary and secondary levels, Singapore’s national math curriculum has undergone regular and major revisions during the past 30 years. At the post-secondary level, Singapore’s system of universities, polytechnics, junior colleges, and technical institutes is presently in a high-growth phase, resulting in changing requirements and levels of competitiveness for admission.
Table 11. Noticeable Shifts in Math Curriculum
Percentage of Parents Who Agree or Strongly Agree with Statement about Math
Statement U.S. England Singapore
Math assignments today are different than
when I was in school. 68% 72% 81%
As one Singapore parent explains, “[Math] textbooks and curriculum have changed vastly as compared to past standards. Parents are unable to guide as much as we would like to, as the working platform and the format of obtaining answers has all changed with time.” Parents in all three countries express diffi culty in understanding math-related curricular changes without instruction or support.
Parents recognize that math pedagogy and curriculum have changed, but without up-to-date instructional support, most cannot provide adequate help with today’s math assignments.
“When the methods for
working out mathematical
problems change over the years,
it is very confusing for the parent,
and makes it diffi
cult to provide
extra support at home.”
- U.S. parent
PARENT ENGAGEMENT IN MATH HELP
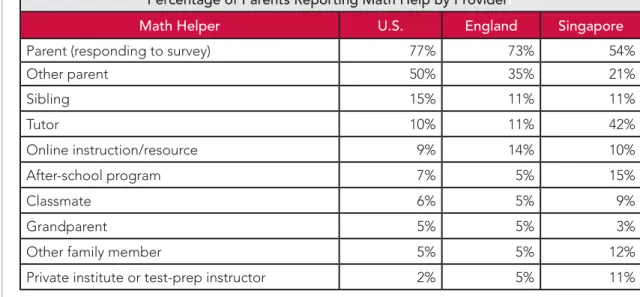
In-country experts agree that parents are able to provide more math instruction for younger children (ages 10 and under). Once students reach more advanced lessons in mathematics, many parents shift out of an instructional role and into a more supervisory/support role or simply become less engaged in math-related homework. In countries such as Singapore, outside-of-school instruction shifts to tutors and tuition school teachers once the level of math study becomes too challenging for parents to teach or coach, but parents and family members remain engaged in math learning in various ways.
Table 12. Providers of Out-of-School Math Help
Percentage of Parents Reporting Math Help by Providerr
Math Helper U.S. England Singapore
Parent (responding to survey) 77% 73% 54%
Other parent 50% 35% 21% Sibling 15% 11% 11% Tutor 10% 11% 42% Online instruction/resource 9% 14% 10% After-school program 7% 5% 15% Classmate 6% 5% 9% Grandparent 5% 5% 3%
Other family member 5% 5% 12%
Private institute or test-prep instructor 2% 5% 11%
Parents in the United States may feel more equipped to help their children because math levels do not advance as rapidly as in comparison countries. In the United States, parents report that students begin to learn multiplication at about age seven, but in Singapore students begin to learn at age six. In a 2005 study examining math standards, textbooks, assessments, and teacher quality, The American Institutes for Research found that “questions on Singapore’s high-stakes grade 6 Primary School Leaving Examination (PSLE) are more challenging than the released items on the U.S. grade 8 National Assessment of Education Progress (NAEP) and the items on the grade 8 state assessments.”7
Table 13. Mean Age Reported for Learning Multiplication of Numbers
Age at Which Children Begin to Learn Multiplication of Numbers
U.S. England Singapore
Mean Age Reported by Parents 6.8 5.2 6.1
7 The American Institutes for Research. What the United States Can Learn From Singapore’s World-Class Mathematics System (2005). http://www.air.org/fi les/Singapore_Report_Bookmark_Version1.
Parents are by far the number one provider of math help—77% of U.S. parents report they provide outside-of-school math help to their children. But, just as they enter middle school, parents’ ability to provide math help decreases as the diffi culty of math increases.
International Parent Perspectives on Math-Related Learning among Students Ages 10-14
EMPOWERING PARENTS TO HELP STUDENTS
Only 34% of U.S. parent respondents say they have received information about “how to help my child complete specifi c math assignments” from the child’s school or other organizations (see Figure 3). In both the United States and England, parents report only 25% have received test-preparation information regarding “how to help my child to prepare for examinations involving mathematics.” In contrast, nearly half of Singapore parents report that they have received these types of math informational materials— revealing more active communication among Singapore parents, schools, and educators surrounding math learning.
Figure 3. Percentage of Parents Receiving Math Instructional Information from Child’s School or Other Organization
Singapore England U.S.
How to help my child prepare for examinations involving
mathematics
How to participate in or prepare for math-related competitions How to help my child
complete specific math assignments 25% 51% 25% 13% 12% 26% 34% 46% 36%
Many U.S. parents express a desire to understand new teaching methods coupled with the need for parent-focused instructional materials:
“Show parents in a hand out how you are teaching the problems so they can help.” “Help parents understand the changes.”
“Provide guides to assist parents in aiding with homework.”
“Give more opportunities for parents to understand what their child is learning and how to help them. It’s a little overwhelming when I see their homework and have no idea how to help them.”
“Defi ne homework more clearly and communicate with parents on what is assigned with instructional packets to the parents on what is being taught and how to help the child at home.”
“Provide early information as to the need for further education around career choices so that parents and kids understand how important the subjects may be to life choices.”
“Provide math answer sheets for the homework given to parents (with problem solving) to ensure that we are helping correctly.”
“Provide help for me so
I can help my child.”
– U.S. Parent
Singapore parents are signifi cantly more likely to receive instructional support for math assignments, exams, and competition preparation.
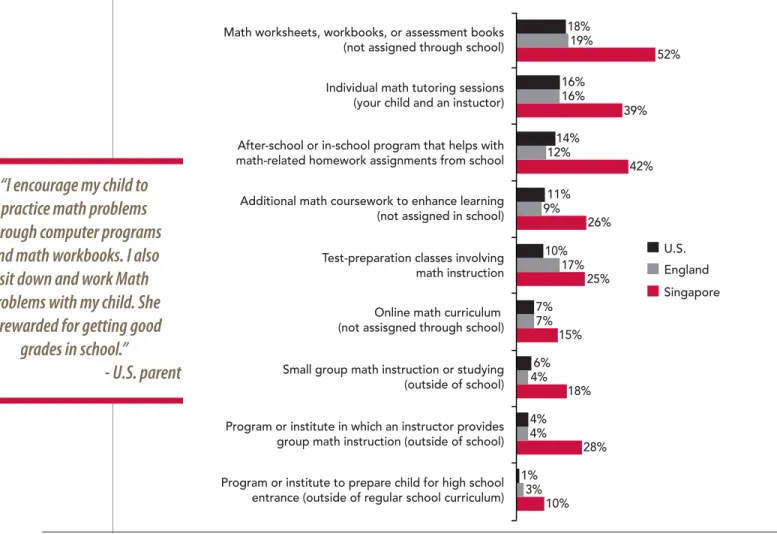
STUDENT PARTICIPATION IN MATH LEARNING OUTSIDE THE CLASSROOM
Nearly all Singapore parents (92%) say their children engage in some form of out-of-school math learning. In the United States and England, less than half of parents report the use of supplementary math instruction. When U.S. parents do choose supplementary math instruction for their children, they are most likely to use math worksheets or workbooks (18%). Comparatively, 52% of parents in Singapore report the use of math worksheets or workbooks by their child. In both England and the United States, 16% of parents report the use of a math tutor (either in school or out of school), while 39% of parents from Singapore report the use of a math tutor.
Figure 4. Child Participation in Math Instruction or Learning in Past 12 Months
Small group math instruction or studying (outside of school) Program or institute in which an instructor provides group math instruction (outside of school) Program or institute to prepare child for high school entrance (outside of regular school curriculum)
52% 19% 18% 16% 16% 39% 42% 12% 14% 11% 9% 26% Additional math coursework to enhance learning
(not assigned in school) Test-preparation classes involving math instruction Online math curriculum (not assisgned through school) Math worksheets, workbooks, or assessment books (not assigned through school) Individual math tutoring sessions (your child and an instuctor)
After-school or in-school program that helps with math-related homework assignments from school
25% 17% 10% 7% 7% 15% 18% 4% 6% 4% 4% 28% 1% 3% 10% Singapore England U.S.
For American middle school-age students, the vast majority of math learning occurs within the structure of the math classroom and/or curriculum assigned through students’ schools. This model of school-concentrated math learning is prevalent in countries such as the United States and England. For many college-bound students worldwide (including some in the United States), math learning occurs as an interplay of in-school lessons, at-home resources, and additional learning either through tuition schools, private math institutes, test-prep courses, tutoring providers, or a combination of low-cost or no-cost programs related to math learning. Driven by high-stakes testing and a competitive environment for the best secondary and university seats, parents in many top-performing math countries often devote signifi cant resources to supporting their child’s math and language learning as they enter adolescence.
“I encourage my child to
practice math problems
through computer programs
and math workbooks. I also
sit down and work Math
problems with my child. She
is rewarded for getting good
grades in school.”
- U.S. parent
International Parent Perspectives on Math-Related Learning among Students Ages 10-14
STUDENT PARTICIPATION IN MATH AND SCIENCE ACTIVITIES
England somewhat outpaces the United States regarding use of science museums and math or science-related computer/video games, Web sites, and extracurricular programming among students. Yet, these math and science activities rate highest among all activities measured for U.S. participation—with nearly one third of U.S. students attending a science museum in the past 12 months. Additionally, U.S. parents report the use of math games as motivators for their children, with one expressing a need for “more interactive math and science games that capture the interest of young boys.” Another parent uses gaming to reinforce math-related career options: “If he wants to work in the gaming industry he needs to know math.” Parents across all three countries mention the use of math-related Web sites and math computer games as incentives and offerings that keep their children engaged in math learning.
Figure 5. Child Participation in Educational Activities Related to Math or Science in the Past 12 Months
28% 39% 32% 29% 34% 26% 27% 38% 28% 11% 7% 26% Camp or extracurricular program
focused on math or science
Computer programming, Web site design, or advanced computer learning Science museum visit
Educational computer games or video games focused on math or science
Math or science-focused Web site viewing
14% 12% 10% Singapore England U.S.
U.S. middle-school age students are even more likely to participate in a reading program than visit a science museum—37% of U.S. parents report child participation in a reading program during the school year (see Figure 6). A similar percentage of U.S. students (34%) participated in a reading program during summer break. Due to a longer summer break (typically between grade levels), U.S. students have more time than their British peers to participate in summer programs. In some countries such as Singapore, school breaks occur between November and January, instead of during the summer.
Figure 6. Child Participation in Reading Programs in the Past 12 Months
Singapore England U.S. Summer reading program Reading program(s)
during the school year
34%
18% 24%
22% 37%
One quarter of Singapore students participated in camps or extracurricular programs focused on math or science—typically the events offering the most active and in-depth learning opportunities.
Singapore provides opportunities for a much higher percentage of students to participate in mathematics and robotics competitions, as compared to the United States and England.
“My daughter is involved
in robotic competition
yearly. With a good
foundation in math, she
can solve many problems.
She understands the
importance of math now,
and even for the future.”
– Singapore parent
STUDENT PARTICIPATION IN COMPETITIONS
Academic and athletic competitions have invigorated America’s student populations for centuries. In the early 1900s, “math bees,” where students computed mental arithmetic problems, were nearly as popular as spelling bees in some regions. Today, only 9% of U.S. students between the ages of 10-14 engaged in a math competition within the past 12 months. Comparatively, 20% of peers in England and 33% of peers in Singapore participated in math competitions in the past 12 months—indicating that math competition participation is double to triple that of the United States in comparison countries. A somewhat larger U.S. student population participated in writing contests (15%), spelling competitions (17%), or science fairs (27%).
Figure 7. Child Participation in Educational Competitions in Past 12 Months
14% 2% 1% 9% 20% 33% 15% 17% 15% 17% 13% 10% Entry in a writing contest (fiction,
non-fiction, poetry, journalism, ect.)
Science fair Robotics fair or competition
Mathematics competition Spelling competition 28% 11% 27% Singapore England U.S.
International Parent Perspectives on Math-Related Learning among Students Ages 10-14
CONCLUSION
Today’s middle school population will enter college in or near the year 2020. They will enter the most demographically and technologically diverse institutions in the history of higher education. And, the employment world into which they graduate will continue to have increased needs for those with science, technology, engineering, and math expertise.
The challenge regarding STEM preparation is formidable in that only 19% of U.S. parents say it is very important to “prepare my child for a career that requires advanced math skills.” And, only 36% of U.S. parents strongly agree with the statement “I know the steps my child must achieve to get into college.” Even fewer know the level of math education their children will need to succeed beyond middle school.
Table 14. Parent Knowledge Regarding College and Career Steps
Percentage of Parents who Strongly Agree with Statement
Statement U.S. England Singapore
I know the steps my child must achieve to get into college. 36% 29% 16% I know the steps my child must achieve to earn a master’s degree. 33% 24% 15% I know the level of math education my child needs to succeed. 32% 26% 16% I know how to help my child afford a college education. 29% 26% 18% I know the steps my child must achieve to become a doctor. 20% 14% 10% I know the steps my child must achieve to become an engineer. 18% 21% 10%
Collectively and collaboratively, stakeholders must employ effective math practices already in place in other parts of the globe. High math performance at the middle-school level most readily occurs when all parties involved in educating students are highly and actively engaged. Singapore, a country that consistently cultivates a top-performing student body in mathematics, demonstrates the following:
◆ Parental involvement in math help and the provision of math resources
◆ Educator communication regarding math assignments and exams
◆ Commitment to excellence in the provision of both remedial and enrichment math instruction ◆ Student engagement in active math learning such as competitions, camps, and games
Raytheon’s MathMovesU program was founded in 2005 to spark passion in science, technology, engineering and math (STEM) among U.S. middle school students. Combating a declining interest in STEM among U.S. children and teens, the program engages students ages 10-14 through interactive learning and tutoring programs, contests, events, scholarships and more. Raytheon is committed to “making math fun,” encouraging students to pursue math-related careers and helping to inspire the next generation of U.S. innovators. Learn more at www.raytheon.com/responsibility/stem
THE RAYTHEON COMMITMENT
MathMovesU has touched the lives of more than 1 million students, teachers and parents. More than 14,000 Raytheon employees volunteered more than 36,300 hours in MathMovesU and STEM initiatives and events in 2009.
SPONSORSHIPS & EVENTS
Raytheon is the title sponsor of the Raytheon MATHCOUNTS® National Competition, a math enrichment and coaching program that promotes middle school mathematics achievement in every U.S. state and territory. Raytheon also annually sponsors National Engineers Week and the FIRST® Robotics Competition, each incorporating events and competitions to engage and excite students in math. Learn more about MATHCOUNTS online at www.mathcounts.org
SUM OF ALL THRILLS™
Raytheon is proud to present Sum of all Thrills™, a one-of-a-kind experience that lets children and park guests custom-design their own ride using mathematical tools and then immediately experience it in a robotic simulator. Sum of all Thrills is located within INNOVENTIONS at Epcot®, at the Walt Disney World Resort, and is the latest Raytheon effort to help educate young students about the power of math and inspire them to pursue math-related activities and careers. In addition to the experience at INNOVENTIONS, Raytheon also created a virtual Sum of all Thrills experience on-line at www.MathMovesU.com
LEARNING THROUGH SPORTS
Raytheon celebrates the history and achievement of the New England Patriots while also promoting math and science education for children through football at The Hall at Patriot Place. Raytheon developed an interactive football-themed learning display called “In the Numbers” inside the Hall. Raytheon also sponsors the Patriots’ math curriculum and works with the Patriots Foundation to develop educational outreach programs throughout Massachusetts. Patriot Place is the offi cial home of the New England Patriots Hall of Fame. Learn more at www.patriot-place.com/thehall.
U.S. STEM EDUCATION MODEL
Raytheon and Business-Higher-Education Forum (BHEF) have partnered to produce the fi rst simulation and modeling tool for the U.S. STEM education system. This tool, known as the U.S. STEM Education Model, enables researchers, policy makers and educators to explore policy scenarios that can strengthen U.S. STEM education and workforce outcomes. Raytheon and the BHEF have plans to develop specifi c state-level STEM models for use in 2011. Learn more at
www.raytheon.com/responsibility/stem/model.
CHANGE THE EQUATION (CTEq)
Raytheon supports our nation’s efforts to improve STEM education through its membership in Change the Equation (CTEq). The CTEq initiative supports the president’s Educate to Innovate campaign, designed to increase private and philanthropic involvement in STEM education. CTEq is the fi rst and only national CEO network devoted entirely to cultivating widespread literacy in STEM with a focus on a larger and more racially, ethnically and gender diverse pool of students. Raytheon joins other companies in this effort and has pledged to invest in STEM programs during the next fi ve years. Learn more at www.changetheequation.org.
SCHOLARSHIPS, GRANTS & GIVING
Raytheon annually awards more than $2 million in MathMovesU scholarships and grants to recognize students, their teachers and schools for mathematical achievement and advancement. To date, Raytheon has recognized 1,421 students and teachers and more than 500 schools nationwide. Raytheon employees also support education with their personal contributions, which are matched by the company. In 2009, employee giving and matching grants for education totaled nearly $5 million.
ONLINE INTERACTIVE LEARNING
Raytheon’s Web site www.mathmovesu.com is a free, interactive online destination designed for middle school students that incorporates educational games and activities to showcase the math behind students’ favorite pastimes, such as music, fashion and sports.