Understanding Information Visualization
in the Context of Visual Communication
Caroline Ziemkiewicz∗ Robert Kosara†
University of North Carolina at Charlotte
ABSTRACT
Despite its often technical nature, visualization is in many ways part of the broader space of visual communication. Just how visualiza-tion relates to illustravisualiza-tion, informavisualiza-tion graphics, digital art, visual languages, etc., is nonetheless poorly understood.
We propose a theory that embeds information visualization within other visual traditions in terms of criteria that are not purely technical: dependence on data, mapping, interactivity, and nota-tionality. In addition to providing the means for a classification, these criteria also foster a different understanding of information visualization. We further adapt our theory to differentiate within visualization, using mapping, readability and information loss, and notationality as the criteria. Both sets of criteria are demonstrated in a number of case studies.
We believe that our novel taxonomies of visualization methods serve as a step towards a more comprehensive theoretical context for understanding the essential purposes, properties, and functions of information visualization.
Keywords: Visualization, theory, taxonomy, classification, visual communication, readability.
Index Terms: H.5.1 [Information Interfaces and Presenta-tion]: Multimedia Information Systems—Evaluation/methodology; H.1.1 [Models and Principles]: Systems and Information Theory— Information theory
1 INTRODUCTION
Information visualization is a young field which draws from dis-parate sources in computer science, design, statistics, data mining, psychology, and the visual arts. While interest in visualization has grown greatly in recent years, its appropriate position within this broader space is unclear, as is the nature of the boundaries that set it off from its neighbors. In order for new research and new ideas to be understood within this larger context, a theoretical founda-tion is needed. General computing theory breaks algorithms down to their essential properties, identifying those which are fundamen-tally similar or different independent of implementation. Similarly, a theory of visualization which identifies the primitives and essen-tial properties of visualization methods could offer new perspec-tives on current problems and identify paths that lead forward from existing research.
This theory should include a definition of information visualiza-tion as distinct from other forms of visual representavisualiza-tion. Often, visualization is defined as any translation of data to image, but tuitively its purpose seems substantially different from that of in-formation graphics or data-based artworks. Locating visualization within the larger context of visual representation will contribute to a greater understanding of fundamental research goals.
∗e-mail: [email protected]
†e-mail: [email protected]
Meaningful divisions within data visualization are also needed. Traditional categories of visualization, most notably scientific visu-alization, information visuvisu-alization, and visual analytics, are them-selves vaguely defined and tend to overlap. The termdata visu-alizationitself is ambiguous, as it sometimes refers to all of the above and is sometimes used to refer specifically to scientific visu-alization and not information visuvisu-alization. For our purposes,data visualizationwill be used to refer to all visualization derived from data, whether that data is abstract or bound to locations. Our pri-mary focus is on information visualization (InfoVis), although our theory has applications outside of that focus. More precise defini-tions are needed not only to clarify the concepts already in use, but also to show in sharper relief potential research areas which exist beyond those concepts, as suggested by Tory and M¨oller [25].
With this in mind, we have constructed a map of the visualiza-tion field that contains not only the internal structures of the field, but also the outer borders that separate visualization from similar ventures such as infographics, visual languages, and data art. Our theory, which draws from existing visualization theory as well as broader theories of aesthetics and visual grammar, takes active read-ability of information to be the central goal of visualization, distin-guishing it from other categories of visual representation. Read-ability is defined in terms of four criteria: to be readable, a visual-ization must be a mapping from property data to a corresponding image. This mapping must bebijective, so that there is a one-to-one correspondence between elements of the image and pieces of information. We also argue that readability requires nontrivial inter-activity, so that the possible information a visualization can convey is not fixed by the designer. Finally, we argue that information vi-sualization in particular must besyntactically notationalby Nelson Goodman’s definition [7], meaning that it is composed of discrete and disjoint visual symbols. We use these criteria to define both in-formation visualization and several closely related classes of visual representation.
We then propose a set of three classifications based on aspects of readability in order to formalize the internal distinctions among in-formation visualization methods. These include whether the map-ping is linear or nonlinear, whether it is designed to minimize or control information loss, and whether the visualization is discrete or continuous, which we define formally using Goodman’s idea of semantic notationality. We go on to apply this taxonomy to some key examples from existing visualization research, and show how it can form meaningful groupings of visualization methods based on type of readability that echo and expand upon earlier taxonomies. We believe that this classification will serve to inspire innovative research directions and illuminate new connections within existing research. We also hope to stimulate interest in a more comprehen-sive theoretical basis to visualization, leading to greater understand-ing of the field as a whole.
2 RELATEDWORK
We are building on top of a wide range of existing work, within in-formation visualization but also in the more general areas of visual representation and languages.
2.1 Visual Mappings and Languages
A major goal of our work is to understand the primitives of visual representation and the mappings by which they are combined into meaningful symbol systems. A seminal inspiration for this area of research is Bertin [4], who analyzes diagrams and maps as a semiotic system of marks, retinal encodings, and spatial proper-ties. Other formal theories of visual mapping include Goodman [7], whose definition of a notational system is meant to distinguish for-mal visual languages, such as those that make up certain kinds of diagrams, from the broader class of representational pictures. These two theories serve as important foundations for our work.
More application-specific work in visual languages and mapping includes Alexander et al. [2], who introduce a complex and sweep-ing language of architectural forms, and Wilkinson’s creation of a formal grammar for information graphics [31]. Heer and Agrawala extend Alexander’s idea of design patterns to software patterns for visualization [11]. These definitions of visual grammar are similar in spirit to our attempt to define visual mappings, although we do not believe that all visualization methods can be described as formal grammars.
One relevant branch of research is that which strives to create automated or semi-automated visualization systems based on for-malized systems of visual mapping, even though we do not want to go nearly as far. This includes Mackinlay’s system for automati-cally generating visualizations based on properties of the data [17]. More recently, Stolte et al. [24] have presented a system called Po-laris, driven by a taxonomy of visualization methods and primitives, which is used to dynamically generate visualizations based on user queries of a large database. Eventually, the goal is certainly to pro-vide practical guides (e.g., as software design patterns as mentioned above), but this is not the immediate aim of this work.
2.2 Visualization Taxonomies
In addition to understanding visual mappings as they relate to in-formation visualization, our work builds upon previous efforts to construct a taxonomy of visualization methods. Shneiderman [22] introduces a 2-axis classification of methods based on type of task and type of data. A similar taxonomy is proposed by Card and Mackinlay [5], who combine a more formal definition of data types with a system of visual properties drawn from Bertin [4].
Chi [6] takes a different approach by focusing on the transforma-tion from data to visual representatransforma-tion, and goes on to differentiate visualization techniques by the actions taken at each transformation step. Tory and M¨oller [25] build on previous work that considers the degree of spatial constraint and continuity of data as important axes, but take a more usability-inspired perspective in viewing these as attributes of the designer’s internal model of the data rather than inherent properties of the data themselves.
Our work differs from these previous taxonomies in our focus on visual mapping as independent from data and task type. In this sense it is most similar to Chi, although our interest lies in defining properties of the mapping as a whole, while Chi focuses on dividing it into stages. Our work is also unique in that it attempts to place visualization within the larger realm of visual communication. We believe that this effort is vital in guiding progress within the field, by illuminating both the limitations and unexplored directions of data visualization.
3 VISUALIZATION INVISUALCOMMUNICATION
Our theory covers two major subjects: first, how to distinguish vi-sualization from other forms of visual representation, and second, how the concepts from this definition may be used to differenti-ate visualization methods from one another. We have developed a definition of information visualization as that class of visual repre-sentation which:
Figure 1: Our model of the visual mapping process, which is a sim-plified version of the data state reference model [6].
• is derived from data,
• represents a bijective mapping from information to image, • provides for nontrivial interactivity, and
• is a syntactically notational symbol system.
We elaborate on each of these items and show how they con-tribute to the overall definition of readability.
3.1 Data-Driven
A data visualization must consist of a mapping function from some existing data source to an image. We define this mapping as a two-step transformation: in the first two-step, data is processed to produce information in the form of an analytical abstraction, and in the sec-ond step, the information is transformed to visual elements (Fig-ure 1). This view of the visual mapping follows Chi’s data state reference model [6], although for our purposes we treat the visual mapping as a single step rather than dividing it into a visualization transformation and a visual mapping transformation.
The requirement that a data visualization be based on data is per-haps an obvious one, although the definition ofdatamay require more elaboration. For example, a mathematical visualization that shows a fractal expanding over time may be a visual representation of information, but not of data in the sense that visualization re-searchers generally use the term. Generally, the termdatain our sense refers to a collection of properties about objects or concepts which exists independently of the visualization. This can come in the form of tabular data containing attributes of some collection of subjects, scientific data which represent a sampling of the proper-ties of an object or phenomenon, text, or multimedia data which contain properties of images or sound.
It may be useful, then, to make a distinction between data visu-alization, which represents properties of information, and function visualization, which represents the visual analog of a process. In the latter case, the information being visualized is treated as a definition of the mapping itself, while we are concerned with cases in which the mapping is independent of specific data. For our purposes, we use the termvisualizationto mean data visualization, with function
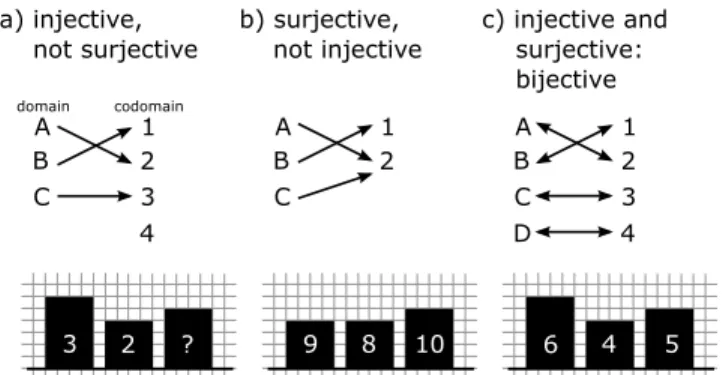
Figure 2: Three types of mapping and resulting information loss (see also Figure 4), using the example of a bar chart. a) an injective map-ping that is not surjective (what does a bar between two possible val-ues map to?); b) a surjective mapping that is not injective (and can thus not be reversed); c) a bijective mapping retains all information and is perfectly readable.
visualizations such as mathematical visualizations, algorithm visu-alizations, visual programming languages, and visual proofs to be separate ventures.
3.2 Bijective Mapping
Although a visualization must be the result of a mapping function, not all visual mappings necessarily result in visualizations. We take the concept of injective, surjective, and bijective functions from mathematics (Figure 2) as an analogy in distinguishing visual map-pings that form visualizations from those which do not.
A function is defined as a mapping from a domain to a codomain. Those mappings in which each element in the (source) domain is mapped to a unique element in the (target) codomain are injective (Figure 2a). In a non-injective mapping, several elements in the do-main may map to one element in the cododo-main. Because of this, a non-injective mapping is irreversible, i.e., there does not exist a function which perfectly inverts the mapping. Mappings in which each element in the codomain is mapped to by some element in the domain are surjective (Figure 2b). This means that there are no pos-sible values in the codomain which do not correspond to a value in the domain. Those mappings which are both injective and surjective are bijective (Figure 2c), so that every element in the domain maps to exactly one element in the codomain, and every element in the codomain can be mapped back to a single element in the domain.
We use these classifications as a metaphor in defining properties of the visual mapping step. In this metaphor, the domain represents the information extracted from the data in the data mapping step and the codomain is the set of image elements in the visual repre-sentation. An injective visual mapping is therefore one in which ev-ery piece of information maps to a single visual element, although there can appear visual elements that do not correspond to informa-tion. Likewise, a surjective visual mapping consists only of visual elements that relate to information, although each unique visual el-ement can correspond to one or more pieces of information. And a bijective visual mapping is one in which every piece of information corresponds to exactly one unique visual element. In Section 3.4 we discuss the definition of visual elements more thoroughly.
We find that both injectivity and surjectivity are necessary con-ditions for a visual representation of information to be readable. In a non-injective mapping from information to image, more than one piece of information can be mapped to a single unique visual ele-ment. Since this can lead to ambiguity and information loss (Sec-tion 5.2), such a mapping would not be readable. Non-surjectivity, on the other hand, implies that there can be significant elements in the visual representation that do not convey information. These
elements may be accidental artifacts of the visual mapping, or tentional aesthetic elements included for decorative rather than in-formational purposes (what Tufte callschartjunk[26]). Since such elements can distract or mislead a user, we require that the visual mapping be surjective as well. An exception should be made, how-ever, for visual elements that provide information about the map-ping itself, such as legends, scales, or labels, provided they do not interfere with readability.
3.3 Nontrivial Interactivity
We argue that interactivity is an essential aspect of active readabil-ity. Byactive readabilitywe mean that a user should be able to actively seek information, rather than merely accessing existing formation determined by the designer. This would exclude static in-formation graphics, diagrams, illustrations, and maps from the class of visualization. The ability for the user to control her view of the data within the context of the given visual mapping has long been considered one of the foundations of visualization, as evidenced by Shneiderman’s oft-cited Visual Information-Seeking Mantra [22] and the emphasis on focus-and-context strategies in both informa-tion and scientific visualizainforma-tion.
Additionally, we distinguish between trivial and nontrivial inter-action, which changes the parameters of the visual mapping itself. For example, semantic zooming, moving from node to node on a hyperbolic tree, and multidimensional scaling would be nontrivial interactions. While a visual representation may include any number of interaction methods, both trivial and nontrivial, the presence of at least some nontrivial interactivity is an especially strong argument for a given representation being a visualization.
3.4 Syntactically Notational
As discussed in Sack [20], the usability goals of visualization have been described as opposed to ideas of the “sublime” as a criterion for aesthetic works. Although Sack proposes several other aesthetic criteria by which to judge artistic visualizations, we distinguish be-tween data-based representations with the goal of readability and those which are to be read as more pictorial depictions. Therefore, for the last item in our definition of visualization, we have drawn from Nelson Goodman’s definition of notational systems. A no-tational system is a visual mapping in which discrete and disjoint concepts map to discrete and disjoint symbols, making the system a visual grammar of sorts, rather than an image which is to be un-derstood in a more holistic, pictorial fashion. For example, musical notation, in which each mark maps to a unique musical note, is a notational system, while photography is not. Goodman’s formal criteria for a notational system, as summarized by Lee [15], are as follows:
1. The system must consist of symbols (utterances, inscriptions, marks) that form equivalence classes (characters), which can be exchanged without syn-tactical effect. [...] The characters have to be dis-joint, so that no mark qualifies as an instance of more than one character. [...]
2. Characters have to be “finitely differentiable” (or “articulate”) in the sense that their disjointness is feasibly testable; this rules out, in particular, “dense” systems in which any two (ordered) char-acters have another between them.
3. Notational systems must beunambiguous, so that the extension (i.e., what is referred to, which Goodman calls the “compliance-class”) of an in-scription is invariant with respect to time, context, and so on.
Representation Data-Driven Type of Mapping Interactive Syntactically Notational
Examples
InfoVis Yes Bijective Yes Yes See Section 6
SciVis Yes Bijective Yes No Flow Vis, Volume Vis, Terrain Vis
Infographics Yes Injective or Bijective No Yes Maps, Diagrams, Illustrations
Function Vis No None Maybe Maybe Math Vis, Algorithm Vis, Visual Languages
Vis Art Yes Injective, Surjective, or Bijective Maybe No Data Art, Ambient Vis, Music Vis
Iconography No None No Yes Traffic Signs, Interface Icons, Ideograms
Art No None Maybe No Painting, Decoration, Photography, etc.
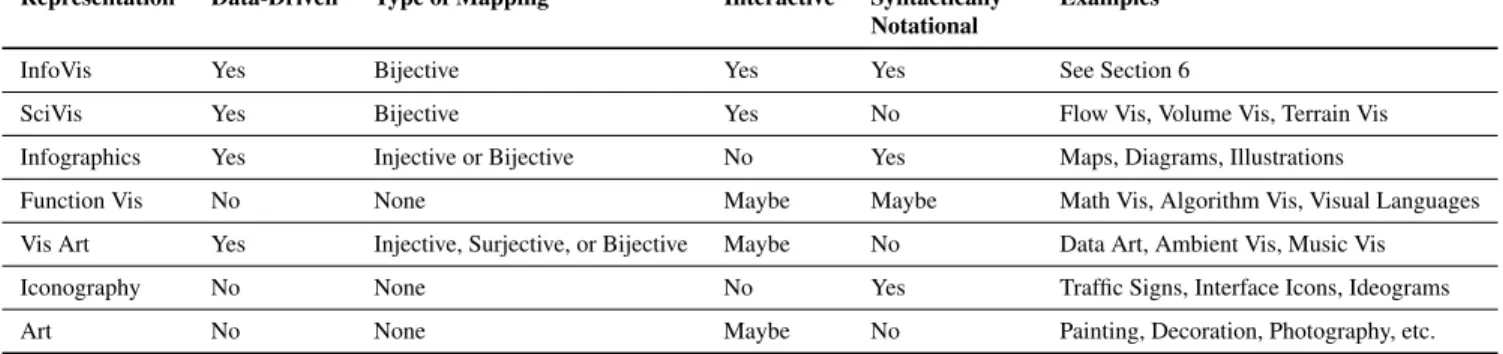
Table 1: Embedding information visualization within visual representation, depending on whether or not a representation is data-driven, its mapping type, interactivity, and syntactic notationality.
4. The compliance-classes of all characters must be disjoint. (Also, the system will ideally be nonre-dundant.)
5. Compliance-classes must also be finitely differen-tiable. Thus, for example, any system that is “se-mantically dense,” in that its compliants form an ordering such that any two have another between them, is excluded.
The first two criteria define syntactic notationality, which deals with the symbols of the system, and the last three define semantic notationality, which deals with the meaning of the symbols. The discrete characters to which Goodman refers can be thought of as glyphs [3], where the term is being used more generally than usual, to refer to the primitive symbols of any visualization. That is, a glyph is the smallest portion of a visualization whose visual at-tributes are fully meaningful in terms of mapping data.
We can use Goodman’s definition of notational characters, then, as a definition of glyphs as visualization primitives. The claim that glyphs must be disjoint implies that each possible glyph must qual-ify as a unique character regardless of its placement in the image, and no mark in the image qualifies as more than one unique glyph. The claim that they are finitely differentiable implies that the space of possible glyphs must be discrete. Glyphs in our formulation need not be the multidimensional icons to which the term is most often applied; they could just as well be bars, points, lines, areas, pixels, or voxels. As long as they are discrete pieces of visual information that can be differentiated from other elements of the visual field, they qualify. This is even true for the extreme case of pixel-based visualization [13], in which each single pixel can be considered a glyph.
We do not require that any given information visualization be a complete notational system, but that it be at least syntactically no-tational, meaning that it must be composed of discrete and disjoint glyphs.
4 VISUALCOMMUNICATIONCASESTUDIES
The common definition of visualization as the presentation of in-formation in visual form can be argued to include a large variety of visual representations with wildly differing goals. A partial list of these representations, and their classification according to our system, can be seen in Table 1. According to our definition, infor-mation visualization contains those visual representations which are based upon property data, represent a bijective mapping of informa-tion to image, include nontrivial interactivity, and are syntactically notational, distinguishing it from several closely related categories. While some of these distinctions are self-explanatory, others war-rant further discussion.
4.1 Scientific Visualization
Data visualization as a whole can be seen as comprising all vi-sual representations that fit the first three criteria: being data-driven, having a bijective mapping, and being nontrivially interac-tive. Through the final requirement of syntactic notationality, our theory makes a distinction between information visualization and most kinds of scientific visualizaton as the terms are usually used. Many instances of flow and especially volume visualization cannot be broken into disjoint glyphs. In all these cases, the continuous nature of the visual representation makes the resulting image picto-rial rather than notational. Understanding a scientific visualization is more like taking in a picture than like reading a visual language. 4.2 Information Graphics
Information graphics, or infographics, are often mentioned in con-nection with information visualization, and there are cases where it is unclear which category a given visual representation falls un-der. The term historically refers to visual presentation of data in the context of a newspaper or magazine, however. It may be thought of as a useful category covering those visual representations whose in-tent is communication of fixed information rather than interaction with fluid information: in other words, readability, but not active readability. Therefore, the main distinction between infographics and information visualization is the lack of interactivity. In addi-tion, many infographics found in magazines and newspapers con-tain decorative elements which detract from the surjectivity (and, in extension, the bijectivity) of the representation.
4.3 Function Visualization
Another category closely related to data visualization contains what might be thought of as function visualizations. Visual analogues of mathematical functions, algorithms, or logical proofs are not based on property data, and as such are not readable in our sense. A visu-alization of a fractal, for example, is a representation of the equation on which it is based, but it is not possible to retrieve that function by looking at the image. Since we see visualization as the map-ping from properties of data to properties of image, visualization of processes represents an interesting but separate field of visual representation. Visual programming languages may fall under this category as well, since they are closely related in purpose to algo-rithm visualization and visual proofs.
4.4 Artistic Visualization
Artistic visualizations, such asArtifacts of the Presence Era[28] orThe Dumpster[16], provide a final borderline case. While these vary widely, in general they treat data in a visualization-like way with the goal of achieving an aesthetic rather than a readable ef-fect. Artifacts can perhaps be broken into glyphs in the form of
the “strata” that build on top of one another to show the images and sound waves captured in a museum over time. These strata are not, however, finitely differentiable; since the glyphs are based directly on the image and sound wave, and the precise nature of the images and sounds captured can be nearly infinitely varied, the range of possible glyphs is syntactically dense, and therefore non-notational. In contrast, if properties of the image and sound (such as illumination, number of people visible, or volume) were mapped to visual properties, the disjointness of the glyphs could be feasibly tested.
Our theory also suggests an additional answer to the questions raised by Skog et al. [23]. This ambient visualization of bus sched-ules inspired by the art of Piet Mondrian was not automatically per-ceived by passersby as being a visualization at all, but rather was often assumed to be just a piece of digital art. Since only a few of the many visual elements on display in the image corresponded directly to data, the mapping was not surjective. This may be a char-acteristic of many decorative or artistic visualizations where visual elements are chosen for aesthetic reasons (including creating a sub-lime experience, Section 3.4) rather than those of usability. As Sack points out [20], the two goals can be seen as diametrically opposing each other. The fact that many passersby saw the work as aesthetic rather than readable may be a result of its bijectivity and non-notationality, in addition to its resemblance to existing artworks. 5 DIFFERENTIATIONWITHININFORMATIONVISUALIZATION Having established the boundaries of the field of visualization, we will now examine how aspects and implications of that definition may be used as the foundation for a novel visualization taxonomy. This taxonomy is composed of three axes:
• whether the mapping is linear or nonlinear,
• the treatment of information loss in the mapping, and • whether the system is semantically notational.
We believe that these axes, while not immediately obvious, en-capsulate many of the intuitive dimensions on which researchers tend to sort visualization methods.
5.1 Linear and Nonlinear Mappings
Another characteristic of the visual mapping function that illu-minates fundamental differences among visualization methods is again based on an analogy from mathematical functions. In this case, we explore what it means for a visual mapping to be linear or nonlinear.
In mathematics, a linear transform is one which has the following two properties [19]:
• Additivity, so that f(x+y) =f(x) +f(y) • Homogeneity, so thatf(ax) =a f(x)
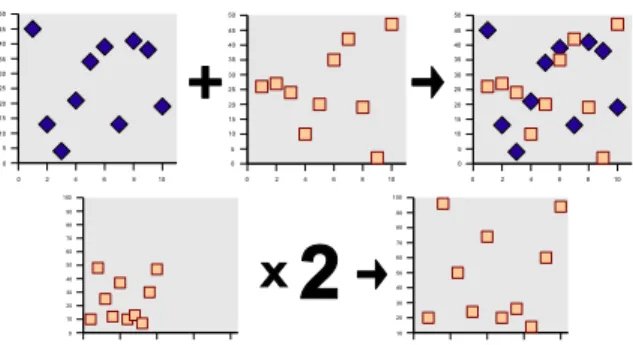
We extend these properties to visual mappings as follows. A vi-sual mapping is additive if a vivi-sualization of one dataset, combined visually with the same visualization of another dataset, is equiva-lent to the visualization of the union of the two datasets. Likewise, a visual mapping is homogenous if a constant transformation over the data would yield a similarly constant transformation over the image (Figure 3).
Because this is only possible when a given data point’s mapped location and appearance remain constant when other portions of the dataset change, this implies that a linear visual mapping is one in which each visual element of a glyph has absolute meaning. In nonlinear mappings, in which a glyph’s location and appearance change with changes in the dataset, information in the visualization must arise to some degree from visual relationships among glyphs.
Figure 3: A scatterplot is a linear mapping, because position has an absolute meaning. A scatterplot superimposed over another scat-terplot (of the same scale) is no different from a scatscat-terplot of both datasets combined (top), and multiplying all the values in a dataset by a constant factor yields a uniform stretch of the visual representa-tion (bottom).
5.2 Mapping and Information Loss
The mapping of data to its visual representation is a central aspect of visualization, and thus also a criterion for differentiating within visualization. In the definition section, we discussed the require-ment that a visualization implerequire-ment a bijective mapping of data to visual parameters (Section 3.2). But what exactly does this mean for a practical visualization that uses a real-world output system with a limited resolution both spatially and in terms of color? Vi-sualization leads to a loss of information in most cases, but exactly how much is lost, and when do we accept this?
We distinguish between two types of information loss: inten-tional and unintended.
Intentional Information Loss
Information loss is intended in many cases where data is aggregated so as to get a better overview of the structure of the data rather than its exact details (e.g., histograms [14], pivot graphs [30], etc.). Information is also intentionally lost in the case of non-numerical data like text documents. Many nonlinear mappings (see above), like the multi-dimensional scaling used in IN-SPIRE [32], reduce the data to a tiny fraction of the original in order to visualize them at all.
Unintended Information Loss
Unintended information loss comes from the limits of the output device and/or human perception. All current displays use pixels of finite size as their basic elements, and have a limited number of col-ors or shades of gray they can show. Human perception is certainly also limited in the number of points it can discern, and more than that in the number of colors that can be differentiated [29].
There are many different kinds of unintended information loss, which can result from projections of higher dimensional data, over-plotting (which can have different reasons), etc. For the purposes of our model, we only investigate the loss of information caused by the quantization of single values when they are displayed on an output device.
A linear transformation of data to visual properties on screen (Figure 4) can be defined as follows. Thenth data dimensionDn=
{di}of an unstructured data set contains a largest valuedmax and a smallest valuedmin. The data is mapped onto screen valuessi, which can be pixel positions or colors. For simplicity, we only consider a single visual attribute here, but this discussion can be easily generalized. The smallest value forsissmin, the largestsmax (Figure 4); these are always whole numbers. The square bracket indicates rounding to the nearest integer.
Information Loss? rD≤uS rD>uS uD≤uS No Yes, unless categorical
uD>uS Yes Yes
Table 2: Information loss in the linear case, depending on: number of distinct screen valuesuS, range of data valuesrD, and the number
of unique data valuesuD.
si=s(d) =
di−dmin
dmax−dmin(smax−smin)
+smin
Especially in the case of color, a more general quantization func-tion [8] may be introduced that further reduces the number of pos-sible values. s(d) =q di−dmin dmax−dmin (smax−smin) +smin
There is clearly a loss of information from the quantization that results from the rounding that needs to be performed when the value is drawn onto the screen; in the case of anti-aliasing, the rounding will be to a fraction of an integer, but the resolution of the display is still finite (and the values are not easily recovered).
The resulting limited resolution limits the user’s ability to read values. We can quantify the resolution in data space as follows. All values within one bin of size∆dend up looking exactly the same to the user. ∆d= dmax−dmin smax−smin
In case a quantization functionqis used, and this function is a uniform quantizer,∆d=∆q(∆qbeing the bin size of the quantizer). Actual information loss comes from the difference between data values and possible visual mappings. We define additional vari-ables:rD=dmax−dminis the range of values in the data dimension; uDis the number of unique (distinct) values in data dimensionD; uSis the number of distinct values on screen, which for the linear case meansuS=smax−smin+1, and in case of using a quantization functionuS=Nq(Dn), the number of distinct values the quantizer can produce for the given data dimensionDn. In the case of a uni-form quantizer,Nq(Dn) =drD
∆qe.
Information loss occurs in all cases whereuD>uS(Table 2), i.e., there are more distinct values than can be mapped into the visual domain (Figure 4a). ForuD≤uS, there are two different cases. If rD>uS, information loss occurs if the data is to be mapped onto a continuous scale. In the case of the data domain being categorical (Figure 4b), however (which is rather likely for alluD≤rScases), the data can be mapped without loss. The best case in terms of information loss is ifrD≤uS, because no information loss will occur: there are enough unique screen variables to which the data can be mapped.
Since a true bijective mapping is only occasionally possible, vi-sualization designers must make a choice between trying to mini-mize the amount of information loss as much as possible and con-trolling information loss at the data mapping stage through data processing techniques such as clustering, aggregation, or filtering. Whether a visualization contains intentional information loss or only unintended information loss is the second axis in our taxon-omy.
Figure 4: An illustration of information loss in a linear mapping for two cases: a) there are more distinct values in the data range than there are possible bar lengths on screen (i.e.,uD>uS), so information loss
occurs; b) there are fewer distinct values than pixel positions (i.e., uD<uS), so no information is lost – even though the range of values
in the data space is larger than on screen in both cases (rD>uS).
5.3 Semantic Notationality and Continuity
Following Tory and M¨oller, we see a discrete or continuous data model as an additional important variable in distinguishing among visualization methods. We further formalize this variable using the second part of Goodman’s definition of notationality (Section 3.4). As the first two items referred to syntactic notationality, the last three define a system with semantic notationality. A semantically notational system is one in which the meaning of a symbol is un-ambiguous and does not overlap with the meanings of other sym-bols. In terms of visualization, this means that any given glyph must maintain a distinct meaning regardless of context, and each glyph refers to a unique and disjoint portion of the data.
In visual mappings that are based on continuous data models, semantic notationality does not apply. A continuous data model implies the assumption that data points are not disjoint, but rather can be thought of as samplings along a continuum, so that the por-tions of the continuum referred to by any two consecutive sample points cannot be clearly divided. Furthermore, a continous model implies that context is significant in understanding the meaning of a data point. For example, in a visualization showing change over time along a timeline, each glyph’s meaning is dependent upon the change it represents from the glyphs that come before and after. Semantic notationality, therefore, can be used as a definition of the intuitive sense of continuity that some visualizations represent.
To elaborate further upon the notion of continuity, it is also useful to consider whether the data are treated as sampled or fully repre-sented. In medical volume data, for example, the data are generally discrete images, but represent a sampling from a continuous struc-ture; therefore, the design model usually treats the data as continu-ous and sampled, implying the need for interpolation. Data in the form of a continuous distribution function, on the other hand, could be treated as continuous and fully represented. This distinction ap-plies similarly to discrete data. A dataset of attributes of different cars, for example, is usually treated as both discrete and fully rep-resented. Census data, on the other hand, are discrete data which are often treated as sampled, since not all of the people represented are actually polled. Another example is stock market data, which can represent a sampling over time of the aggregation of many in-dividual actions (i.e., buying and selling at specific prices).
Since a fully represented and continuous data model requires a continuous symbol space, a visual mapping that employs such a model is not syntactically notational and therefore lies outside of information visualization. Of the other three cases, only the dis-crete and fully represented data model is semantically as well as syntactically notational. Both discrete and sampled and continuous and sampled models are not semantically notational, and are there-fore relatively more pictorial than other visual mappings.
A visualization method that employs a discrete and fully repre-sented data model, and is therefore a complete notational system, is a more literal mapping of the data than one that does not. In other
Information Loss Type of Mapping Continuity Examples
Loss Is Unintended
Linear Discrete Scatterplot, Parallel Coordinates [12], Bar Charts Continuous Timelines [18]
Nonlinear Discrete TreeMap [21], Cartograms, Node-Link Diagrams Continuous Information Flocking Boids [27]
Loss Is Intentional
Linear Discrete Histograms [14], PivotGraph [30] Continuous Brush Strokes [10]
Nonlinear Discrete IN-SPIRE [32]
Continuous ThemeRiver [9], TextPool [1]
Table 3: Differentiation within information visualization along the axes of information loss, mapping, and continuity.
words, the metaphor being used is more direct, since it maps more closely to a translation from one language (that of the data, be it numerical or otherwise) to another (i.e., the symbol system of the visualization). As a visualization moves closer to Goodman’s idea of the pictorial, the mapping from data to image becomes less a translation than an abstraction.
6 INFORMATIONVISUALIZATIONCASESTUDIES
The three major axes described above map the design space of valid visualization methods according to our definition. In Table 3, we show a number of information visualization techniques sorted ac-cording to our three axes. This produces an informal spectrum of methods from the most direct at the top of the list to the most ab-stract at the bottom. We have divided this spectrum into four loosely defined groups as an initial taxonomy of visualization methods by type of readability. Note that these are not rigidly defined bound-aries between subgroups, and that some methods may draw from several categories.
6.1 Direct Translation
The methods on the unintended loss, linear, and discrete end of the spectrum are the most direct translations from data to image. These methods perform minimal processing of the data, so that the visual mapping is executed directly on data points, rather than on intermediate pieces of information. In parallel coordinates [12], for example, each data point is projected to a unique glyph (in this case, a polyline); therefore, any information loss that occurs due to overplotting is unintentional, not inherent to the mapping. Like-wise, this mapping is linear since the arrangement of each poly-line glyph has absolute meaning, and it is discrete since there is no meaningful interpolation between data points. This is a direct translation because if there were no unintended information loss, one could theoretically reverse the mapping to produce the original data. Readability of data in this case is straightforward, except as it is confounded by information loss.
6.2 Relative Meaning
As mappings employ more intentional information loss, nonlinear mapping, and continuous data models, the visualization becomes more abstracted in different ways. In the case of TreeMaps [21], there is no intentional data loss, and the data model is discrete; how-ever, the mapping is nonlinear since the position of a glyph (that is, a rectangle representing a node in the hierarchy) only has meaning relative to the position of other glyphs. Adding data to a hierarchy would result in an entirely different TreeMap layout. This makes for a slightly more indirect mapping than in the linear case. The readability of such a mapping is less trivial than in the case of more
direct methods, because data is mapped not only to visual proper-ties, but to relationships among visual properties. The user must look at more than one glyph to extract information about a single data point.
An unusual case which shows the abstraction in continuous rel-ative meaning methods is the Information Flocking Boids [27] sys-tem. In this visualization of time-varying stock market data, glyphs are treated as agents which attempt to gather near similar glyphs without colliding with them. This is meant to produce a flocking behavior among clusters of similar stocks over time. Since the posi-tion of glyphs is so highly dependent on other glyphs, this is clearly nonlinear, and the importance of context to meaning indicates a continuous data model. While this method still attempts to show every data point, it represents a high level of abstraction. Since data properties are being mapped to physical attraction of glyphs rather than to simple image properties, readability is not a matter of reversing the mapping to data points, but rather of seeing overall patterns.
6.3 Aggregation
In mappings where the loss is intentional, steps are taken in the data mapping stage to pare down the amount of information in order to reduce the amount of unintended loss. The simplest of these are his-togram methods, which aggregate data into bins based on categor-ical dimensions or ranges of numercategor-ical dimensions, with size rep-resenting the number of members in each category or range. Pivot graphs [30] combine the idea of node-link diagrams with histogram representations, resulting in aggregated nodes and links, rather than nodes and links which refer to one data point or one relationship each. Properties of the dataset are readable, while individual prop-erties of data points may be lost.
6.4 Abstraction
The most abstract mappings are found at the nonlinear and con-tinuous end of the intentional-loss methods. This includes meth-ods such as ThemeRiver [9], which employs a continuous model of highly filtered and aggregated document data in a nonlinear map-ping. These methods sacrifice readability of any given data point for an understanding of the dataset as a whole, meaning they are moving closer to being pictorial rather than purely notational sym-bol systems.
While many useful methods have already been established in the more direct subgroups of our taxonomy, examples in the more ab-stracted subgroups are relatively rare. These areas may suggest di-rections for novel future research that seeks innovative mappings of data to image.
7 CONCLUSION
We present a model in which visual representations are classified by properties of their mapping from data to image, rather than by properties of the image or properties of the data. This theory em-beds visualization as a field within the larger visual culture, and serves as a basis for a taxonomy of information visualization meth-ods. This work contributes some elements of a more solid theoret-ical foundation for the visualization field. Additionally, it provides a new perspective on visualization as a whole as well as on the sim-ilarities and differences among visualization methods. This theory can be used to guide design decisions and to inspire debate that will lead to greater understanding of the visualization field.
The application of our model to existing forms of visual repre-sentation demonstrates its viability as an organizational tool. In particular, using the distinction between notational and pictorial systems, we have shown how the classic categories of scientific vi-sualization and information vivi-sualization can be distinguished from one another without relying on properties of the data, which can be problematic [25]. This definition also allows us to formalize to some degree the intuitively apparent differences among data visu-alization, artistic visuvisu-alization, and infographics, in addition to the less frequently considered category of function visualizations.
In extending our theory to an internal taxonomy of information visualization, we also build upon the work of Tory and M¨oller in constructing a new perspective on visualization which is less de-pendent upon inherent properties of the data. Specifically, their axis of discrete vs. continuous models of the data is included in our taxonomy, while we use the notion of semantic notationality to formalize and expand upon the original concept. Our axis of linear vs. nonlinear mappings also addresses some of the intent of Tory and M¨oller’s axis of spatially given vs. spatially chosen data mod-els. Both axes end up describing visualizations with varying levels of spatial constraint assumed in a given visualization, though the axis of linearity does so independent of data type.
Future work in this research includes a more thorough examina-tion of the taxonomy of informaexamina-tion visualizaexamina-tion and a more for-mal characterization of the groupings it produces. This work may also serve as the foundation for a semi-automated tool for designing glyphs and visual representations, in order to test its practical ap-plicability. Such an effort would entail a greater exploration of the definition of glyphs taken from Goodman’s syntactic notationality. ACKNOWLEDGEMENTS
This work was performed with partial support from the National Vi-sualization and Analytics Center (NVACTM), a U.S. Department of Homeland Security Program, under the auspices of the SouthEast Regional Visualization and Analytics Center. NVAC is operated by the Pacific Northwest National Laboratory (PNNL), a U.S. Depart-ment of Energy Office of Science laboratory.
REFERENCES
[1] C. Albrecht-Buehler, B. Watson, and D. A. Shamma. TextPool: Vi-sualizing live text streams. InProceedings Information Visualization, pages 215–216. IEEE CS Press, 2004.
[2] C. Alexander, S. Ishikawa, M. Silverstein, M. Jacobson, I. Fiksdahl-King, and S. Angel. A Pattern Language: Towns, Buildings, Con-struction. Oxford University Press, USA, 1977.
[3] E. Anderson. A semigraphical method for the analysis of complex problems.Proceedings of the National Academy of Sciences, 43(923– 927), 1957.
[4] J. Bertin.Semiology of Graphics. Univ. of Wisconsin Press, 1983. [5] S. K. Card and J. Mackinlay. The structure of the information
visual-ization design space. InProceedings Information Visualization, pages 92–99. IEEE CS Press, 1997.
[6] E. H. Chi. A taxonomy of visualization techniques using the data state reference model. InProceedings Information Visualization, pages 69– 76. IEEE CS Press, 2000.
[7] N. Goodman.Languages of Art. Hackett Publishing Company, 1976. [8] R. M. Gray and D. L. Neuhoff. Quantization. IEEE Transactions on
Information Theory, 44(6):2325–2385, October 1998.
[9] S. Havre, B. Hetzler, and L. Nowell. ThemeRiver: Visualizing theme changes over time. InProceedings Information Visualization, pages 115–123. IEEE CS Press, 2000.
[10] C. G. Healey, L. Tateosian, J. T. Enns, and M. Remple. Perceptually based brush strokes for nonphotorealistic visualization. ACM Trans-actions on Graphics, 23(1):64–96, January 2004.
[11] J. Heer and M. Agrawala. Software design patterns for informa-tion visualizainforma-tion.IEEE Transactions on Visualization and Computer Graphics, 12(5):701–708, 2006.
[12] A. Inselberg and B. Dimsdale. Parallel coordinates: A tool for visual-ing multi-dimensional geometry. InProceedings IEEE Conference on Visualization, pages 361–378. IEEE CS Press, 1990.
[13] D. A. Keim. Designing pixel-oriented visualization techniques: The-ory and applications. IEEE Transactions on Visualization and Com-puter Graphics, 6(1):59–78, 2000.
[14] R. Kosara, F. Bendix, and H. Hauser. TimeHistograms for large, time-dependent data. InJoint Eurographics - IEEE TCVG Symposium on Visualization (VisSym 2004), pages 45–54, 2004.
[15] J. Lee. Goodman’s aesthetics and the languages of computing. In P. A. Fishwick, editor,Aesthetic Computing, chapter 2, pages 29–42. MIT Press, 2006.
[16] G. Levin, K. Nigam, and J. Feinberg. The Dumpster. http://artport.whitney.org/commissions/thedumpster/, 2006. [17] J. Mackinlay. Automating the design of graphical presentations of
re-lational information.Transactions on Graphics, 5(2):110–141, 1986. [18] C. Plaisant, B. Milash, A. Rose, S. Widoff, and B. Shneiderman. Life-Lines: Visualizing personal histories. InProceedings Human Factors in Computing Systems (CHI), pages 221–227. ACM Press, 1996. [19] T. Rowland. Linear function. From MathWorld – A Wolfram Web
Resource, created by Eric W. Weisstein.
http://mathworld.wolfram.com/LinearFunction.html.
[20] W. Sack. Aesthetics of information visualization. In C. Paul, V. Vesna, and M. Lovejoy, editors,Context Providers. University of Minnesota Press, 2007 (forthcoming).
[21] B. Shneiderman. Tree visualization with tree-maps: 2-d space-filling approach.ACM Transactions on Graphics, 11:92–99, 1992. [22] B. Shneiderman. The eyes have it: A task by data type taxonomy for
information visualization. InProceedings IEEE Symposium on Visual Languages, pages 336–343. IEEE CS Press, 1996.
[23] T. Skog, S. Ljungblad, and L. E. Holmquist. Between aesthetics and utility: Designing ambient information visualizations. InProceedings Information Visualization, pages 233–240. IEEE CS Press, 2003. [24] C. Stolte, D. Tang, and P. Hanrahan. Polaris: A system for query,
analysis, and visualization of multidimensional relational databases. IEEE Transactions on Visualization and Computer Graphics, 8(1):52– 65, January-March 2002.
[25] M. Tory and T. M¨oller. Rethinking visualization: A high-level taxon-omy. InProceedings Information Visualization, pages 151–158. IEEE CS Press, 2004.
[26] E. R. Tufte.The Visual Display of Quantitative Information. Graphics Press, 2nd edition, 2001.
[27] A. Vande Moere. Time-varying data visualization using information flocking boids. InProceedings Information Visualization, pages 97– 104. IEEE CS Press, 2004.
[28] F. B. Vi´egas, E. Perry, E. Howe, and J. Donath. Artifacts of the presence era: Using information visualization to create an evocative souvenir. InProceedings Information Visualization, pages 105–111. IEEE CS Press, 2004.
[29] C. Ware. Information Visualization: Perception for Design. Morgan Kaufmann Publishers Inc., San Francisco, CA, USA, 2000. [30] M. Wattenberg. Visual exploration of multivariate graphs. In
Proceed-ings Human Factors in Computing Systems (CHI), pages 822–819. ACM Press, 2006.
[31] L. Wilkinson.The Grammar of Graphics. Springer, 1st edition, 1999. [32] J. A. Wise. The ecological approach to text visualization.Journal of the American Society for Information Science, 50:1224–1233, 1999.
![Figure 1: Our model of the visual mapping process, which is a sim- sim-plified version of the data state reference model [6].](https://thumb-us.123doks.com/thumbv2/123dok_us/1734554.2743769/2.918.540.773.77.411/figure-model-visual-mapping-process-plified-version-reference.webp)