PERSPECTIVE
Combining Human Computing and Machine Learning
to Make Sense of Big (Aerial) Data for Disaster Response
Ferda Ofli,1,* Patrick Meier,2Muhammad Imran,1Carlos Castillo,1Devis Tuia,3Nicolas Rey,4Julien Briant,4 Pauline Millet,4Friedrich Reinhard,5Matthew Parkan,6and Ste´phane Joost6
Abstract
Aerial imagery captured via unmanned aerial vehicles (UAVs) is playing an increasingly important role in disaster response. Unlike satellite imagery, aerial imagery can be captured and processed within hours rather than days. In addition, the spatial resolution of aerial imagery is an order of magnitude higher than the imagery produced by the most sophisticated commercial satellites today. Both the United States Federal Emergency Management Agency (FEMA) and the European Commission’s Joint Research Center ( JRC) have noted that aerial imagery will inevitably present a big data challenge. The purpose of this article is to get ahead of this future challenge by proposing a hybrid crowdsourcing and real-time machine learning solution to rapidly process large volumes of aerial data for disaster response in a time-sensitive manner. Crowdsourcing can be used to annotate features of interest in aerial images (such as damaged shelters and roads blocked by debris). These human-annotated features can then be used to train a supervised machine learning system to learn to recognize such features in new unseen images. In this article, we describe how this hybrid solution for image analysis can be imple-mented as a module (i.e., Aerial Clicker) to extend an existing platform called Artificial Intelligence for Disaster Response (AIDR), which has already been deployed to classify microblog messages during disasters using its Text Clicker module and in response to Cyclone Pam, a category 5 cyclone that devastated Vanuatu in March 2015. The hybrid solution we present can be applied to both aerial and satellite imagery and has applications beyond disaster response such as wildlife protection, human rights, and archeological exploration. As a proof of concept, we recently piloted this solution using very high-resolution aerial photographs of a wildlife reserve in Namibia to support rangers with their wildlife conservation efforts (SAVMAP project, http://lasig.epfl.ch/savmap). The results suggest that the platform we have developed to combine crowdsourcing and machine learning to make sense of large volumes of aerial images can be used for disaster response.
Key words:Big Data analytics; crowdsourcing; machine learning; remote sensing; UAV
Introduction
Situational awareness—knowing who has been affected, how, where, and when—is an integral element of disas-ter response. Humanitarian organizations carry out rapid disaster damage and needs assessments following disasters to improve their situational awareness and take
more informed decisions. Reducing the time it takes to carry out these assessments provides aid organizations with more rapid situational awareness, which enables them to respond more quickly and thus speedup their life-saving relief efforts. This explains why satel-lite imagery has played an important role in disaster 1
Social Computing Group, Qatar Computing Research Institute (QCRI), Hamad bin Khalifa University (HBKU), Doha, Qatar.
2
Social Innovation Group, Qatar Computing Research Institute (QCRI), Hamad bin Khalifa University (HBKU), Doha, Qatar.
3
MultiModal Remote Sensing Group, Department of Geography, University of Zurich, Zurich, Switzerland.
4
Section of Environmental Engineering, School of Architecture, Civil and Environmental Engineering (ENAC), Ecole Polytechnique Federale de Lausanne (EPFL), Lausanne, Switzerland.
5
Kuzikus.org, Windhoek, Namibia.
6
Laboratory of Geographical Information Systems (LASIG), School of Architecture, Civil and Environmental Engineering (ENAC), Ecole Polytechnique Federale de Lausanne (EPFL), Lausanne, Switzerland.
*Address correspondence to:Ferda Ofli, Social Computing Group, Qatar Computing Research Institute (QCRI), Hamad bin Khalifa University (HBKU), Tornado Tower 13th Floor, Doha 5825, Qatar, E-mail: fofl[email protected]
response for almost two decades.1,2 That being said, commercial satellites can take 24 hours or more to acquire and process imagery following a disaster. After Typhoon Haiyan—the most powerful typhoon to make landfall in recorded human history—devas-tated the Philippines in 2013, it took 64 hours before satellite imagery analysis of the damage was made available to responders.3In contrast, unmanned aerial vehicles (UAVs) could have captured higher-resolution aerial imagery within hours. In addition, commercially available UAVs are considerably cheaper than satel-lites.4This explains why an unprecedented number of organizations deployed UAVs in the wake of Typhoon Haiyan and why many experts expect the number of humanitarian UAV missions to increase significantly in the years ahead.5
Challenges of processing aerial images
Given this sudden surge in the use of UAVs for disaster response, both the United States Federal Emergency Management Agency (FEMA) and the European Com-mission’s Joint Research Center ( JRC) have warned of an impending big (Aerial) data challenge (Ted Okada, Chief Technology Officer [CTO] of FEMA on May 14, 2014, and Peter Spruyt at the Joint Research Center [JRC] on April 15, 2014, pers. comm.). The volume and type of aerial data that UAVs can collect depend on the sensor used. Cameras and video cameras can take very high-resolution aerial photographs and vid-eos in visible light, while infrared cameras can be used to capture thermal imagery. Fleets of UAVs can easily collect terabytes worth of very high-resolution im-agery (2–20 cm resolution) in a single day. To make sense of these data, disaster response organizations such as FEMA have been using crowdsourcing to ana-lyze this aerial imagery since Hurricane Sandy in 2012.6 However, analyzing these images is a tedious and time-consuming task. In one recent UAV mission in Namibia, for example, it took a small team of two to four analysts over 400 hours—18 days—to process (i.e., to download and orthorectify the imagery and subsequently search for wildlife as well as fauna) some 15,000 aerial images.7 In Haiti, another UAV mission captured some 5600 images, which took ana-lysts 25 days to manually process the level of damage caused by an earthquake.8Just like other big data chal-lenges, manual processing alone is only a temporary or partial solution at best, and even if large-scale crowd-sourcing is possible—such as DigitalGlobe’s ‘‘crowd-search’’ of Malaysia Flight 370, as described in Meier9—
this may not be the best use of human time if faster semi-automated solutions exist.
Combining human and machine intelligence
In recent years, hybrid solutions combining hu-man computing and machine intelligence have been introduced. This includes the categorization of mes-sages posted on social media during disasters. Artifi-cial Intelligence for Disaster Response (AIDR)—is the only free and open-source platform that currently does this in real time at the wake of a disaster.10 A joint project between the Qatar Computing Research Institute (QCRI) and the United Nation’s Office for the Coordination of Humanitarian Affairs (OCHA), AIDR allows the UN and others to crowdsource the annotation of microblog messages (tweets) by digital volunteers and to use those annotations to create ma-chine learning classifiers on the fly. This allows orga-nizations such as OCHA to automatically identify relevant information posted on Twitter in real time once the classifiers are trained.
AIDR’s public crowdsourcing interface (http://clickers .micromappers.org) includes a collection of micro-tasking apps (which we refer to as Clickers) to process a variety of human intelligence tasks.11The Text Clicker, for instance, is used by digital volunteers to categorize crisis-related tweets (e.g., requests for donations and reports of people missing). The Image Clicker enables digital volunteers to quickly and easily rate the level of infrastructure damage in pictures posted on Twitter and mainstream media during a disaster. AIDR already uses the labels gathered through the Text Clicker to create supervised machine learning classifiers that clas-sify new incoming tweets.12We are currently working on doing the same with the Image Clicker.
Contribution
Since social media messages, satellite images, and aerial images have been shown to provide complementary information about an affected area during a crisis,12 providing a tool that processes aerial data in addition to social media data in real time would enable disaster responders to simultaneously make sense of these mul-tiple big data sources and overlay the results on a live crisis map. We thus propose to extend the hybrid methodology to aerial photographs by creating an Aer-ial Clicker powered by crowdsourcing and machine learning. We recently developed and tested this new Clicker, which enables digital volunteers to quickly
and blocked roads. These traced images can then be used as training data to create image-based machine learning classifiers that can automate the disaster damage assess-ment process for humanitarian aid organizations. These classifiers can also be deployed as a preprocessing mod-ule in the hybrid pipeline for filtering out images that are irrelevant or do not carry significant content for human annotation or for providing human annotators with rel-evant image features to annotate. In both cases, manual workload on the digital humanitarians will be reduced significantly. That being said, it is important to note that correctly identifying features of interest in aerial (and satellite) imagery is a more complex and error-prone task than the manual annotation of microblog posts. In the past, distributing image annotation tasks to the crowd has led to a mixture of positive7,13,14and negative15results.
Case study
Deploying new and untested technologies such as the Aerial Clicker in the middle of an ongoing disaster is far from ideal. So, we piloted our Clicker in a less time-sensitive scenario. We partnered with a wildlife protec-tion project in the Kuzikus Wildlife Reserve in Namibia to support their wildlife protection and antipoaching ef-forts (SAVMAP project, http://lasig.epfl.ch/savmap). According to rangers at this reserve, ‘‘rhino poaching continues to be a growing problem that threatens to extinguish some rhino species within a decade or two. Rhino monitoring is thus important for their protec-tion. One problem is to detect rhinos in large areas and/or dense bush areas.’’16This pilot was carried out in partnership between the QCRI, Kuzikus Wildlife Reserve, the Polytechnic of Namibia, the Laboratory of Geographic Information Systems (LASIG) of the E´cole Polytechnique Fe´de´rale de Lausanne (EPFL), the MultiModal Remote Sensing Group of the University of Zurich, and Drone Adventures.
The remainder of this article is organized as follows. The section ‘‘Combining Human and Machine Intelli-gence for Processing Disaster-Related Microblog Messages’’ presents the methods used to apply crowd-sourcing and machine learning to microblog posts. The section ‘‘Machine Learning, Remote Sensing, and UAVs’’ reviews the state of the art in machine learning for analysis of satellite and aerial imagery. The section ‘‘Image Machine Learning and Crowdsourcing’’ elabo-rates on the development of an Aerial Clicker and its deployment in Namibia. The section ‘‘Experiments’’ pres-ents our experimental results on the Namibia deployment,
which confirm that our Aerial Clicker can indeed be com-bined with machine learning for disaster response. The final section presents our main conclusions.
Combining Human and Machine Intelligence for Processing Disaster-Related Microblog Messages In this section, we describe how crowdsourcing and machine learning can be used to process microblog messages posted during a crisis situation.
Social media platforms such as Twitter, Facebook, Instagram, and YouTube are heavily used during disas-ters.17Twitter alone can receive hundreds of messages per hour during an emergency situation as it was the case during Hurricane Sandy in 2012 (16,000 tweets per minute). Identifying in real time the relevant and actionable reports in this vast volume of information would be invaluable for disaster response. (For a de-tailed survey on different techniques used to process social media data, please see Imran et al.18) Crowd-sourcing alone is insufficient to make sense of this user-generated source of big data. A crowd of 5000 vol-unteer annotators would only be able to classify 11,000 tweets per minute, for example,19and even if a larger crowd were available, it would take the equivalent of six human years to classify each tweet generated during the Hurricane Sandy. If semi- or fully automated solu-tions existed, then this would save considerable human time, which could be used for more appropriate tasks during relief efforts.
Fully automated methods based on supervised learn-ing require trainlearn-ing data obtained from previously an-notated data, for example, a previous disaster of a similar nature. However, these methods in general per-form poorly due to the domain transfer problem, that is, a classifier trained using data from one event may not perform accurately in the classification of tweets from a different event.20,21 (This problem has also been encountered in the processing of satellite and aerial data.) We thus present an alternative approach below.
Architecture of a hybrid
crowdsourcing/machine learning system
AIDR (http://aidr.qcri.org) is a platform that efficiently processes high-velocity social streams while maintain-ing high classification accuracy. AIDR’s design is based on the Crowdsourced Stream Processing approach, which combines human and machine intelligence in a stream (online) processing architecture, maintaining high throughput, high load adaptability, high quality, and low latency.19AIDR is specifically designed to scale
the processing capability of disaster responders to an-alyze large volumes of social media data in real time by using crowds of human volunteers for labeling and machines for automatic classification.
Figure 1 depicts the general architecture of AIDR. First, the Collector module collects messages from a se-ries of data sources. In the specific case of Twitter, this collection is done by specifying keywords, hashtags, and/or geographical regions. Note that AIDR also works with text messages, SMS. Next, the Tagger mod-ule uses supervised learning to classify the messages; in this process, it selects certain elements for labeling and sends them to crowdsourcing workers (e.g., digital vol-unteers). The labels obtained by crowdsourcing are passed to a Learner module that updates (or initially creates) the classification model used by the tagger, using the available labels.
For the Tagger module, AIDR leverages well-known machine learning algorithms, while at the same time hiding the details of the specific algorithm being used from the end users. The Tagger runs a parameterized classification model. The parameters are provided by the Learner module, which identifies these parameters automatically based on labeled data provided by a crowd of volunteer annotators. The Tagger uses an al-gorithm to prioritize which items (tweets) should be automatically tagged and which should be pushed back to the crowd for human labeling (a technique known as active learning).22
For the Crowdsourcing module, we use MicroMap-pers (http://clickers.micromapMicroMap-pers.org/), a volunteer crowdsourcing site powered by open-source
crowd-sourcing platform PyBossa (http://pybossa.com/). A consensus of two of three labelers is required for each labeled item. Labeled items are then fed to the Learner module. AIDR follows the principle of keep data moving, that is, the Tagger processes the items that it receives from the Collector with the best model avail-able at the time.
Accuracy, cost, and performance
The classification accuracy of a supervised automatic classification system is determined by the effective-ness of the machine learning algorithm used and, most critically, by the quantity and quality of the la-bels being used to train it. In this case, a high classi-fication accuracy depends on (1) having volunteers to provide the labels and (2) mechanisms to keep the label quality high (in our case, redundancy of the labels).
The cost of running such a system in the long run is basically given by the time investment of digital volun-teers. AIDR employs two strategies to maximize the classification improvements per label received. First, duplicates and near-duplicates are removed so that two elements that are too similar to each other are con-sidered as a single task. Second, active learning is used to strategically select the items that lead to larger clas-sification improvements.
In terms of performance, being a stream processing system, AIDR maintains a high throughput (i.e., 500 items per second or more), which is double the ob-served peak rates in a real disaster (i.e., *270 items per second).
Machine Learning, Remote Sensing, and UAVs In this section, we provide an overview of recent ad-vances found at the interface between machine learning and remote sensing. We first review how the remote-sensing community, working particularly on satellite and airborne sensors, traditionally applied various ma-chine learning techniques in their studies. Then, we discuss the needs and challenges for a new set of ma-chine learning techniques as UAV sensing is becoming more prevalent day by day.
Machine learning in remote sensing
The remote sensing image analysis and machine learn-ing fields have a long tradition of interaction.23–25The use of machine learning techniques to empower the ob-servations made at a local scale through terrestrial cam-paigns or an online collaborative effort has been very appealing. Machine learning algorithms allow us to generalize punctual observations and to perform pre-diction and detection tasks on unseen images by the human operators.
This is especially true in present days, where the re-visit time of satellites has hit the daily frequency limit and where the increasing success of UAV systems has popularized on-demand data acquisition (as discussed in the current article). In this context, machine learning has proven to be the right choice to facilitate the tran-sition from raw data to useful information.26,27In the remote sensing community, machine learning algo-rithms have been used in parallel to image processing and computer vision approaches, and remote sensing-specific constraints have been successfully integrated into the standard machine learning paradigms, such as the following:
Geographic consistency28,29: Images are smooth in the geographic domain and follow the first law of geography. This means that pixels that are nearby are generally similar and tend to belong to the same land cover class. Such assumption has been encoded with strategies based on spatial filters, image segmentation, or structured models. Multiscale behavior30: Consistency across scales is
also something that is inherent to remote sensing data. Similarity depends on the scale of observa-tion, and consistency in this sense has been used to improve the quality of image segmentation. Temporal consistency: Large efforts have been
provided to model temporal behavior of a region, in particular, when dealing with change detection problems31or time series analysis.32
Domain transfer: Image classification and re-trieval strongly rely on terrestrial samples, which are used to train the models. However, the sam-pling cannot be repeated at each image acquisi-tion. One strategy to address this problem is to reuse the available set of samples to classify new images (a problem known as domain adapta-tion33,34). Another strategy is to select a good rep-resentative subset of terrestrial samples in the new acquisition to minimize the acquisition cost (a problem known as active learning,35 which is also detailed below in this article).
Moreover, problems related to increasing image resolution (and therefore size) have appeared in recent literature.36
Moving toward UAVs
UAV imagery bridges the gap in scale and resolution between field imagery and satellite imagery. The ability to operate UAVs at low altitudes allows users to adapt image characteristics, that is, spatial and temporal res-olution, to the scale of the observed ground objects or to the monitored processes. Therefore, in contrast to the traditional remote sensing image analysis para-digms, a new set of computer vision and machine learning approaches must be proposed for UAV imag-ery to account for such differences in the remote sens-ing image characteristics. In other words, UAVs need vision systems to improve the quality of navigation and landing37,38 to geometrically process the massive amounts of data acquired (typically to orthorectify the single images and produce mosaics39) and, as in the current article, to run data analytic algorithms exploiting the content of the images, for example, in object detection,40,41 vegetation classification,42,43 or to facilitate rescue operations.44,45In these studies, ad-vanced machine learning algorithms such as deep autoencoders,43 kernel methods,40 or random forests (RFs)42 were used to generalize the training data to the extent of the image acquisition.
Image Machine Learning and Crowdsourcing The section ‘‘Combining Human and Machine Intelli-gence for Processing Disaster-Related Microblog Mes-sages’’ demonstrated that a hybrid human computing and machine learning approach can be used to make sense of textual big data generated during disasters. This methodology was operationalized using the AIDR platform, which focuses exclusively on text-based infor-mation shared as microblogs on Twitter. The section
‘‘Machine Learning, Remote Sensing, and UAVs’’ over-viewed machine learning methods for remote sensing in general and UAV imagery in particular.
In this section, we suggest that a hybrid solution may also be viable and indeed desired to analyze aerial imag-ery during major disasters. We present a blueprint for the development of an Aerial Clicker, which would pro-vide training data for an automatic system for aerial im-age processing. We describe an initial deployment of the Clicker and discuss what the results mean vis-a`-vis our proposed roadmap.
Aerial Clicker
We have developed a microtasking user interface to crowdsource the analysis of aerial imagery as part of the crowdsourcing platform introduced in the Intro-duction. This interface displays one aerial image at a time and invites digital volunteers to trace/outline fea-tures of interest, such as damaged shelters. One of the main objectives of the Aerial Clicker is thus to create training data for machine learning purposes. Figure 2 shows an example user task; in this case, the user is asked to find animals in the image.
Each image is shown to five different volunteers, which is a standard practice to reduce errors. By show-ing the same image to different volunteers, we observe how many individual elements (e.g., damaged shelters) each volunteer has traced in a given image. If all five volunteers each trace three features, then we can state with some confidence that there are indeed three dam-aged shelters in that image. We then select (or crop) the three traced features that cover the immediate
sur-rounding area to provide both positive and negative ex-amples for the machine learning task.
We could add a second quality assurance control by using our existing Image Clicker and ask other volun-teers to confirm that the cropped image the initial vol-unteers traced indeed belongs to the class of interest. That is, each cropped image would be shown to a group of volunteers. If a majority of these volunteers tag this image as showing a damaged shelter, then this image is used as training data for the machine learning classifier.
Piloting the Aerial Clicker
Testing new humanitarian technologies in the middle of a disaster is never ideal. So, we piloted the Aerial Clicker as part of the wildlife protection project in Namibia (as mentioned in the introduction) to deter-mine whether the crowd could use the platform to rap-idly and correctly trace features of interest that could in turn be used for machine learning purposes.
A total of 1300 very high-resolution aerial images were used for this pilot project.46Because each image was rather large (in terms of memory and the spatial distance it covered), we split each image into four mi-croimages. We thus uploaded 5200 microimages to the Aerial Clicker and invited digital volunteers to trace any animals they saw in these images. We provided an online tutorial to teach volunteers how to trace an-imals so that the results could be used for machine learning purposes. We conducted our pilot (Wildlife Challenge) over the course of 3 days in September 2014. Each microimage was shown to*5 different vol-unteers, which means we displayed 26,000 microim-ages during the 72-hour challenge.
Results of Aerial Clicker pilot
About 98% of the 26,000 images were analyzed within the first 48 hours.46Of 26,000 images analyzed by five digital volunteers, only 2390 of them included annota-tions of one or more polygons that potentially corre-sponded to animals. These 2390 annotations yielded a total of 7474 polygons spread across 1024 of the orig-inal 5200 microimages. After seeking a consensus of three of five volunteers for each potential animal gon in a microimage, we were left with 1172 such poly-gons spread across 411 microimages.
Given earlier research on the use of aerial imagery for wildlife protection, we expect that the larger ani-mals will be correctly traced more often than smaller animals by the volunteers.47In any event, the results FIG. 2. User interface of Aerial Clicker (SAVMAP
may be further skewed since volunteers were not given a complete set of examples covering the different species of animals being sought after. In addition, volunteers were not presented with negative examples, and as a re-sult, some volunteers also traced Meerkat holes, anthills, and certain terrain features as wild animals.
In this particular setting of aerial image annotation (finding wild animals), we observe that aerial images with and without animals differ only in small portions of them, which would make it challenging to adopt off-the-shelf methods for object recognition in images. This presents a very interesting challenge for computer vision and machine learning researchers as the prelim-inary results we present in the next section suggest. We envision that in other aerial image annotation contexts (e.g., finding damaged buildings or shelters), the visual differences (e.g., textures or image gradients) may be more significant and hence the object recognition algo-rithms more accurate.
Experiments
Based on the results of the Aerial Clicker pilot, we designed object classifiers for the automatic detection of animals (such as ostrich, kudu, wildebeest, zebra, and impala) against the background (such as trees, bushes, and holes on the ground). In this section, we briefly describe our approach, present the preliminary results, and discuss the links between crowdsourcing and machine learning in this context.
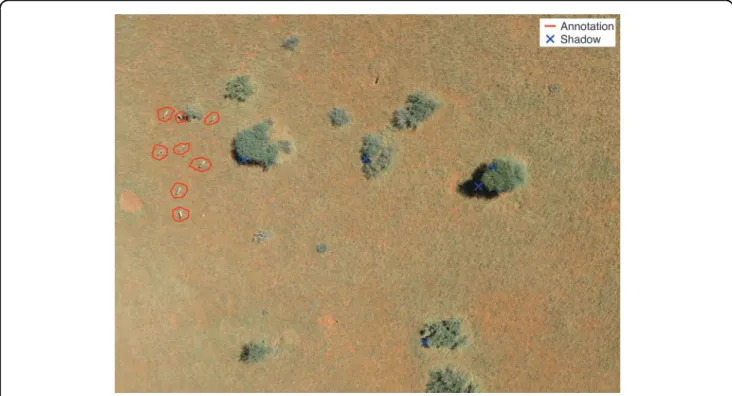
The savanna of the Kuzikus Wildlife Reserve is semi-arid and therefore has sparse vegetation and little land-forms so that each standing object, such as trees or animals, casts a shadow on the ground. In our experi-ments, we take advantage of this and try to detect the shadows and classify them according to the bodies that cast them.
We are thus interested in binary class classifica-tion of the detected shadow objects into two classes: (1) the Animal class, which includes impala, zebra, wildebeest, and other quadruped animals, which are similar in size; and (2) the Background class, which accounts for everything else such as trees, bushes, dead wood, holes, and other unidentified objects.
We used the results of the Aerial Clicker pilot to determine the class label of each detected shadow. We labeled a shadow in an image as Animal if the shadow coincided with one of the Aerial Clicker anno-tations for that particular image and as Background if otherwise.
Overview of the procedure
1. Preprocessing: To reduce noise and neglect very small details, we reduced the resolution of the im-ages. The resulting ground sampling distance was around 0.5 m, but varied from image to image. Then, we applied an averaging filter to smooth the image and an opening mask to further remove small details.
2. Segmentation: We converted the preprocessed images into binary images based on a threshold that discriminated shadow pixels in the grayscale image. We then extracted objects (i.e., shadows) from these binary images (Fig. 3).
3. Features: For each object, we computed a set of features, including four geometric indexes de-scribing the shadow and two radiometric features describing the object that casts the shadow. In ad-dition to these shadow features, we also extracted histogram of oriented gradient (HOG) features,48 which are commonly used in various image pro-cessing tasks.
FIG. 4. Animals lying on the ground were not detected (SAVMAP image).
4. Training: We used half of the labeled objects for training several machine learning classifiers such as logistic regression, naı¨ve Bayes (NB), sup-port vector machines (SVM) with a radial basis function (RBF) kernel, and RF. We used the remaining half of the labeled objects as test data. 5. Classification: We use the trained models to
clas-sify the objects in the test data.
Shadow descriptors
We computed six descriptors for every shadow object. Four of them were geometric indexes: the area of the shadow, its perimeter by area ratio, its Gravelius index (a measure of the sphericity), and its Euler num-ber (defined as EN=1h, where h was the number of holes in the object). The last two descriptors were Bool-ean variables and directly looked at the body that casted the shadow.
To do so, we considered larger shadow regions as trees’ canopies. Then, we determined the Sun’s direc-tion by matching the posidirec-tion of segmented shadows and canopies. A few isolated trees were sufficient to de-termine the Sun’s direction with enough precision for our purpose (–20), and the method proved to work with all images we used.
The first Boolean descriptor takes a value of 1 if a green patch of pixels (probably a tree) was found close to the shadow and was aligned with the Sun’s di-rection. Similarly, the second Boolean descriptor dis-criminated animals by taking the value of 1 if a white patch of pixels was found in the right direction.
Results
During the segmentation step, 28,514 object regions were extracted from the 1024 microimages annotated
by the digital volunteers. Of these 28,514 object re-gions, only 240 of them coincided with our Aerial Clicker annotations and are hence labeled as Animal (positive class), while the remaining 28,274 object re-gions were labeled as Background (negative class). The most common situation where animals were not detected was when they lay on the ground (Fig. 4) or stood parallel to the direction of the Sun (Fig. 5), in which cases their shadows were often too small to detect.
This resulted in a highly imbalanced dataset with a positive/negative class ratio of 1:118. One common ap-proach in literature to overcome this challenge is to undersample the majority class to balance the class dis-tribution.49,50Since a random undersampling approach could discard potentially useful data and cause further FIG. 6. Area under the curve–receiver operating characteristic curve (AUC-ROC).(a)Shadow;(b)Histogram of oriented gradient (HOG);(c)Shadow+HOG.
Table 1. Summary of the Classification Results Overall
accuracy Precision Recall F1-measure AUC-ROC Kappa Shade LOG 0.75 0.72 0.82 0.77 0.81 0.50 SVM 0.73 0.75 0.69 0.72 0.79 0.47 NB 0.76 0.70 0.89 0.79 0.81 0.52 RF 0.77 0.76 0.79 0.78 0.83 0.54 HOG LOG 0.75 0.75 0.76 0.75 0.81 0.50 SVM 0.80 0.81 0.79 0.80 0.89 0.60 NB 0.78 0.85 0.68 0.76 0.86 0.56 RF 0.80 0.81 0.78 0.80 0.88 0.60 Shade+HOG LOG 0.83 0.83 0.83 0.83 0.89 0.66 SVM 0.85 0.83 0.88 0.85 0.93 0.70 NB 0.84 0.83 0.84 0.84 0.91 0.68 RF 0.83 0.83 0.83 0.83 0.91 0.66
AUC-ROC, area under the curve–receiver operating characteristic; HOG, histogram of oriented gradient; LOG, logistic regression; NB, naı¨ve Bayes; RF, random forest; SVM, support vector machines.
problems, we decided to employ a stratified sampling scheme based on k-medoids clustering51 to attain a positive/negative class ratio of 1:1. As mentioned ear-lier, we used half of the positive and negative examples for training/validation and reserved the other half of the data for testing.
We experimented with various machine learning classifiers, namely logistic regression (LOG), SVM with an RBF kernel, NB, and RF. Furthermore, we eval-uated their performance using different feature sets, that is, (1) shadow features, (2) HOG features, and (3) both. We used grid search to determine the RBF kernel scale and regularization parameter in SVM training, as well as to determine the number of trees and minimum leaf size in RF training. Figure 6 plots the receiver operating characteristic (ROC) curves achieved by each classifier on each feature set. Table 1 summarizes the performance outcomes using sev-eral metrics such as ovsev-erall accuracy, precision, recall, F1-measure, and Cohen’s kappa.
According to the AUC-ROC plots, shadow features performed as well as HOG features, but best results were obtained when shadow and HOG features were used together. In terms of classifiers, all of them yielded comparable performances, with SVM and RF being marginally better than LOG and NB in most cases. We would like to note that in applying several machine learning classifiers on several feature sets, we wanted to demonstrate different aspects of the data-modeling problem in general. However, we did not focus on find-ing the optimal classifier for the problem at hand in the current study as our main goal was to present a new perspective rather than a comprehensive explora-tion of a specific problem.
Despite this fact, the classification scores summarized in Table 1 are somewhat satisfactory for the balanced dataset scenario. We achieved more than 80% precision and recall when we used shadow and HOG features to-gether with any one of the classifiers (Fig. 7). We can further ramp up these values by considering that ani-mals usually live in herds and hence detecting a few in-dividuals is sufficient to draw the user’s attention on the area. The user could then check the direct sur-roundings and quickly identify further animals that may have been missed by the classifier (Fig. 8).
In this study, we focused only on detecting animals and dealt with a binary classification problem (as this was also the original purpose of the Aerial Clicker pilot). In the future, the Aerial Clicker can task digital volunteers to trace objects in more details, such as
an-notating Trees, Bushes, and Holes in addition to the Animals. This will provide machine learning algo-rithms more information about the image content, of course, at the expense of increased human annotation. However, it could help resolve the confusions between animal shadows and holes in the ground, etc. Further-more, the classifiers can then provide the vegetation density as side information.
Conclusions
Aerial data are expected to become a big data challenge in the near future. As such, this position article proposed a solution to a future data problem within the context of disaster response. To this end, we have presented a hy-brid human and machine computing approach to make sense of large volumes of aerial data. This ap-proach extends a methodology currently used in the AIDR platform for annotating social media messages.
We piloted this approach using very high-resolution imagery for a wildlife reserve in Namibia since deploy-ing untested technologies in disaster situations is ill advised. While digital volunteers traced numerous features that were not wild animals, those traces of genuine animals are of sufficient quality to be used as training data. Other challenges that were encoun-tered are the very sparse number of examples of wild animals (positive features) for machine learning purposes and the fact that the visual differences be-tween images of animals and images of other objects may not be enough for off-the-shelf visual object rec-ognition tools.
We believe that these challenges may not be as pro-nounced in disaster contexts, especially in the after-math of category 5 disasters such as Cyclone Pam, which devastated the islands of Vanuatu in March 2015. Based on the MicroMappers proof of concept de-scribed below, the World Bank used officially the Aerial Clicker to accelerate their damage and needs assess-ments efforts in close collaboration with the Govern-ment of Vanuatu. The coauthors of this article are thus on standby to rapidly develop machine learning classifiers based on the crowdsourced tracing given that the World Bank’s UAV missions are expected to continue in possible future disasters. Our goal is ulti-mately to enable real-time machine learning for auto-mated feature detection in aerial imagery.
Acknowledgments
The authors would like to thank the SAVMAP Consor-tium (http://lasig.epfl.ch/savmap). SAVMAP is a project
FIG. 8. Detecting a few individual animals with high precision can be sufficient to draw attention to a specific area (SAVMAP image).
cofunded by Drone Adventures (http://droneadventures .org/) and the EPFL Cooperation & Development Center (http://cooperation.epfl.ch/).
Author Disclosure Statement
No competing financial interests exist. References
1. Delilah HA, Al-Khudhairy. Geo-spatial information and technologies in support of EU crisis management. Int J Digit Earth. 2010;3:16–30. 2. Carter D, Heath GW, Hovmork G, et al. Space applications for disaster
mitigation and management. Acta Astronaut. 1989;19:229–249. 3. Lemoine G, Spruyt P. The potential of aerial platforms in a ’rapid’
emer-gency response context. Joint Research Center Scientific and Technical Research Reports. 2013.
4. Ezequiel CAF, Cua M, Libatique NC, et al. Aerial imaging applications for post-disaster assessment, environmental management and infrastruc-ture development. In: 2014 International Conference on Unmanned Aircraft Systems (ICUAS), Orlando, FL: IEEE, May 27–30, 2014. pp. 274– 283.
5. Unmanned Aerial Vehicles in Humanitarian Response. 2014. Occasional Policy Paper. OCHA Policy and Studies Series. Available online at https://docs.unocha.org/sites/dms/Documents/Unmanned%20Aerial% 20Vehicles%20in%20Humanitarian%20Response%20OCHA%20July% 202014.pdf (last accessed December 10, 2015).
6. Meier P. 2012. Crowdsourcing the evaluation of post-sandy building damage using aerial imagery. Blog post on iRevolution.net 2012. Available online at http://irevolution.net/2012/11/01/crowdsourcing-sandy-building-damage/ (last accessed December 10, 2015).
7. Drone Adventures. 2014. Nature conservation mapping in Namibia. Blog post on Drone Adventures 2014. Available online at http://blog .droneadventures.org/post/94741443510/nature-conservation-mapping-in-namibia (last accessed December 10, 2015).
8. Corbane C, Saito K, Dell’Oro L, et al. A comprehensive analysis of building damage in the 12 January 2010 Mw7 Haiti earthquake using high-resolution satellite and aerial imagery photogrammetric engineering & remote sensing. Photogramm Eng Remote Sensing. 2011;77:997–1009. 9. Meier P. 2014. Results of the crowdsourced search for flight 370. Blog post
on iRevolution.net 2014. Available online at http://irevolution.net/2014/ 03/15/results-of-the-crowdsourced-flight-370-search/ (last accessed December 10, 2015).
10. Imran M, Castillo C, Lucas J, et al. AIDR: Artificial Intelligence for Disaster Response. In: Proceedings of the Companion Publication of the 23rd International Conference on World Wide Web Companion. International World Wide Web Conferences Steering Committee, Seoul, Korea, April 7–11, 2014. pp. 159–162.
11. Howe J. The rise of crowdsourcing. Wired Magazine. 2006;14:1–4. 12. Dashti S, Palen L, Heris MP, et al. Supporting disaster reconnaissance with
social media data: A design-oriented case study of the 2013 Colorado floods. In: Proceedings of the 11th International ISCRAM Conference 2014, University Park, PA, May 2014.
13. Meier P. 2013. Zooniverse: The answer to big (crisis) data? Blog post on iRevolution.net 2013. Available online at http://irevolution.net/2013/ 03/26/zooniverse-big-crisis-data/ (last accessed December 10, 2015). 14. Meier P. 2011. Crowdsourcing satellite imagery analysis for
UNHCR-Somalia: Latest results. Blog post on iRevolution.net 2011. Available online at http://irevolution.net/2011/11/09/crowdsourcing-unhcr-somalia-latest-results/ (last accessed December 10, 2015).
15. American Red Cross. 2014. OpenStreetMap damage assessment review: Typhoon Haiyan (Yolanda) interim report. Available online at https:// americanredcross.github.io/OSM-Assessment (last accessed December 10, 2015).
16. Meier P. 2014. Seeking digital volunteers to search & protect Namibia’s wildlife (using aerial imagery from UAVs). Available online at http:// newswatch.nationalgeographic.com/2014/09/15/using-uavs-to-crowdsource-the-search-for-namibias-wildlife/ (last accessed December 10, 2015).
17. Palen L. Online social media in crisis events. Educause Q. 2008;31:76–78.
18. Imran M, Castillo C, Diaz F, et al. Processing social media messages in mass emergency: A survey. ACM Computing Surveys (CSUR) 47:pp 67:1–67:38. 19. Imran M, Lykourentzou I, Castillo C. Engineering crowdsourced stream
processing systems. arXiv Preprint 2013;arXiv:1310.5463.
20. Imran M, Elbassuoni S, Castillo C, et al. Practical extraction of disaster-relevant information from social media. In: Proceedings of the 22nd International Conference on World Wide Web Companion. Interna-tional World Wide Web Conferences Steering Committee, Rio de Janeiro, Brazil, May 13–17, 2013. pp. 1021–1024.
21. Imran M, Castillo C, Lucas J, et al. Coordinating human and machine in-telligence to classify microblog communications in crises. In: Proceed-ings of the 11th International ISCRAM Conference 2014, University Park, PA, May 2014.
22. Settles B. Active Learning. In: Synthesis Lectures on Artificial Intelligence and Machine Learning. California: Morgan & Claypool Publishers, 2012. 23. Davis SM, Landgrebe D, Phillips T, et al. Remote sensing: The quantitative
approach. New York: McGraw-Hill International Book Co., 1978. 24. Richards JA, Jia X. Remote sensing digital image analysis, 4th ed. Berlin:
Springer-Verlag, 2006.
25. Camps-Valls G, Tuia D, Gomez-Chova L, et al. Remote sensing image processing, synthesis lectures on image, video, and multimedia pro-cessing. San Rafael, CA: Morgan and Claypool, 2011.
26. Tuia D. Mere´nyi E, Jia X, Gran˜a M. Foreword to the special issue ‘‘Machine learning for remote sensing data processing.’’ IEEE J Sel Topics Appl Earth Observ. 2014;7:007–1012.
27. Bioucas-Dias JM, Plaza A, Camps-Valls G, et al. Hyperspectral remote sensing data analysis and future challenges. IEEE Geosci Remote Sens Mag. 2013;1:6–36.
28. Fauvel M, Tarabalka Y, Benediktsson JA, et al. Advances in spectral-spatial classification of hyperspectral images. Proc IEEE. 2013;101:652–675. 29. Schindler K. An overview and comparison of smooth labeling methods
for land-cover classification. IEEE Trans Geosci Remote Sens. 2012;50:4534–4545.
30. Tarabalka Y, Tilton JC, Benediktsson JA, et al. A marker-based approach for the automated selection of a single segmentation from a hierar-chical set of image segmentations. IEEE JSTARS. 2012;5:262–272. 31. Bovolo F, Bruzzone L. A novel framework for the design of
change-detection systems for very high resolution remote sensing images. Proc IEEE. 2013;101:609–630.
32. Petitjean F, Inglada J, Gancarski P. Satellite image time series analysis under time warping. IEEE Trans Geosci Remote Sens. 2012;50:3081–3095. 33. Bruzzone L, Marconcini M. Toward the automatic updating of land-cover
maps by a domain-adaptation SVM classifier and a circular validation strategy. IEEE Trans Geosci Remote Sens. 2009;47:1108–1122. 34. Tuia D, Volpi M, Trolliet M, et al. Semisupervised manifold alignment of
multimodal remote sensing images. IEEE Trans Geosci Remote Sens. 2014;52:7708–7720.
35. Crawford M, Tuia D, Yang HL. Active learning: Any value for classification of remotely sensed data?. Proc IEEE. 2013;101:593–608.
36. Gueguen L, Pesaresi M, Soille P. An interactive image mining tool han-dling gigapixel images. In: Proceedings of the IEEE International Geo-science and Remote Sensing Symposium (IGARSS), Vancouver, BC: IEEE, July 24–29, 2011. pp. 1581–1584.
37. Sharp C, Shakernia O, Sastry S. A vision system for landing an unmanned aerial vehicle. In: Proceedings of the IEEE International Conference on Mechatronics and Automation, Seoul, Korea, May 21–26, 2001. pp. 1720–1727.
38. Achtelik M, Zhang T, Kuhnlenz K, et al. Visual tracking and control of a quadcopter using a stereo camera system and inertial sensors. In: Proceedings of the IEEE International Conference on Mechatronics and Automation, Changchun: IEEE, August 9–12, 2009. pp. 2863–2869. 39. Turner D, Lucieer A, Watson C. An automated technique for generating
georectified mosaics from ultra-high resolution unmanned aerial ve-hicles (UAV) imagery, based on structure from motion (SfM) point clouds. Remote Sens. 2012;4:1392–1410.
40. Moranduzzo T, Melgani F. Automatic car counting method for unmanned aerial vehicle images. IEEE Trans Geosci Remote Sens. 2014;52:1635–1647. 41. Gleason J, Nefian AV, Bouyssounousse X, et al. Vehicle detection
from aerial imagery. In: Proceedings of the IEEE International Con-ference on Robotics and Automation, Shanghai, China: 2011. pp. 2065–2070.
42. Feng Q, Liu J, Gong J. UAV remote sensing for urban vegetation mapping using random forest and texture analysis. Remote Sens. 2015;7:1074–1094. 43. Hung C, Xu Z, Sukkarieh S. Feature learning based approach for weed classification using high resolution aerial images from a digital camera mounted on a UAV. Remote Sens. 2014;6:12037–12054.
44. Mueggler E, Faessler M, Fontana F, et al. Aerial-guided navigation of a ground robot among movable obstacles. In: IEEE International Sym-posium on Safety, Security, and Rescue Robotics (SSRR), Toyako-Cho: IEEE, October 27–30, 2014. pp. 1–8.
45. Rudol P, Doherty P. Human body detection and geolocalization for UAV search and rescue missions using color and thermal imagery. In: IEEE Aerospace Conference, Big Sky, MT: IEEE, March 1–8, 2008. pp. 1–8. 46. Reinhard F, Hauptfleisch ML, Joost S; SAVMAP Consortium. 2015. Near
real-time ultrahigh-resolution imaging from unmanned aerial vehicles for sustainable land use management and biodiversity conservation in semi-arid savanna under regional and global change (SAVMAP). Zen-odo. Available online at http://dx.doi.org/10.5281/zenZen-odo.16445 (last accessed December 10, 2015).
47. Meier P. 2014. More results from our digital expedition to Namibia. Available online at https://micromappers.wordpress.com/2016/11/01/more-results-digital-expedition-namibia (last accessed December 10, 2015). 48. Dalal N, Triggs B. Histograms of oriented gradients for human. In: IEEE
Computer Science Society Conference on Computer Vision and Pattern Recognition (CVPR), San Diego, CA: IEEE, June 25, 2005. pp. 886–893. 49. Batista GEAPA, Prati RC, Monard MC. A study of the behaviour of several
methods for balancing machine learning training data. SIGKDD Explo-rations. 2004;6:20–29.
50. Batuwita R, Palade V. Efficient resampling methods for training support vector machines with imbalanced datasets. In: Proceedings of the 2010
International Conference on Neural Networks (IJCNN), Barcelona: IEEE, July 18–23, 2010. pp. 1–8.
51. Yen S-J, Lee Y-S. Cluster-based under-sampling approaches for imbal-anced data distributions. Expert Syst Appl. 2009;26:5718–5727.
Cite this article as:Ofli F, Meier P, Imran M, Castillo C, Tuia D, Rey N, Briant J, Millet P, Reinhard F, Parkan M, Joost S (2016) Combining human computing and machine learning to make sense of big (aerial) data for disaster response.Big Data4:X, xxx–xxx, DOI: 10.1089/ big.2014.0064.
Abbreviations Used
AIDR¼Artificial Intelligence for Disaster Response AUC¼area under the curve
HOG¼histogram of oriented gradient LOG¼logistic regression
NB¼naı¨ve Bayes RBF¼radial basis function
RF¼random forest
ROC¼receiver operating characteristic SVM¼support vector machines UAV¼unmanned aerial vehicle