R
eplacing a lost molar with one implant represents a biomechanical challenge. Functional forces are greater in this area, and lateral forces may lead to increased stress on components.1 Moreover, the presence of limited bone width may hinder the place-ment of a wider-diameter implant. In this case, re-habilitation may involve the placement of one or two narrow-diameter implants or one standard-diameter implant after augmentation techniques to provide ad-equate bone dimensions.1 This study tested anatomi-cally designed molar crowns supported by one or two narrow-diameter implants or one standard-diameter implant under sliding contact fatigue in water, whichhas been shown to reproduce clinical failures.2 The postulated hypothesis was that one narrow-diameter implant supporting a molar crown would result in low-er reliability compared to eithlow-er two narrow- diametlow-er implants or one standard-diameter implant.
Materials and Methods
Eighty-four Ti-6Al-4V implants (Touareg, Adin Dental Implants) were divided into three groups (Table 1) according to their width and restoration design to support a molar crown (Fig 1). Implants were embed-ded in orthodontic acrylic resin poured in a 25-mm-diameter plastic tube. Following connection of the corresponding proprietary cement-retained abut-ment (RS-3801, Adin Dental Implants) to the bearing housing, the abutment screw (RS-3400, Adin Dental Implants) was tightened according to the manufactur-er’s instructions. A first molar crown was waxed to the desired anatomy and cast in cobalt-chromium metal alloy (cobalt-chrome partial denture alloy, BEGO) with the cementation surface designed to fit either one standard-diameter implant (group 1), one narrow-diameter implant (group 2), or two narrow-narrow-diameter implants (group 3) (Figs 1g, 1h, and 1i, respectively). Crowns were then cemented (Rely-X Unicem, 3M ESPE) on the abutments.
First, mean single load–to-failure (SLF) values were obtained using a universal testing machine (INSTRON 5666). Load was applied using a 6.25-mm-diameter tungsten carbide (WC) ball on the mesiobuccal cusp (Fig 1f) at a rate of 1 mm/min in a 30-degree off-axis loading orientation. Then, based on the mean SLF values, three different profiles (mild, moderate, and aggressive) were designed for mouth-motion step-stress accelerated life testing (MMSSALT) (n = 18). aResearch Scientist, Department of Biomaterials and Biomimetics,
New York University College of Dentistry, New York, New York, USA; Associate Professor, Postgraduate Program in Dentistry, School of Dentistry, Potiguar University, Natal, Rio Grande do Norte, Brazil.
bResearch Scientist, Department of Biomaterials and Biomimetics,
New York University College of Dentistry, New York, New York, USA; Associate Professor, Postgraduate Program in Dentistry, School of Health Sciences, Unigranrio University, Duque de Caxias, Rio de Janeiro, Brazil.
cResearch Scientist, Department of Biomaterials and Biomimetics,
New York University College of Dentistry, New York, New York, USA; Assistant Professor, Department of Restorative Dentistry, School of Dentistry, Federal University of Amazonas, Manaus, Amazonas, Brazil.
dAssistant Professor, Department of Prosthodontics, and Assistant
Professor, Department of Biomaterials and Biomimetics, New York University College of Dentistry, New York, New York, USA.
eAssistant Professor, Department of Prosthodontics, New York
University College of Dentistry, New York, New York, USA.
fAssistant Professor, Department of Biomaterials and Biomimetics,
New York University College of Dentistry, New York, New York, USA. Correspondence to: Dr Amilcar C. Freitas-Júnior, E 345 24th Street, Room 804s, New York, NY 10010. Fax: 212-995-4244. Email: ac.freitas.jr@gmail.com
The reliability and failure modes of molar crowns supported by three different implant-supported designs were tested according to the following groups: group 1, one standard-diameter implant (3.75 mm); group 2, one narrow-diameter implant (3 mm); and group 3, two narrow-diameter implants (3 mm). Loads were applied as mouth-motion cycles using a step-stress accelerated life-testing method. β values for groups 1 and 3 (1.57 and 2.48, respectively) indicated that fatigue accelerated the failure of both groups, but not for group 2 (0.39). Abutment screw failure was the chief failure mode. Strength and reliability were significantly higher for groups 1 and 3 compared to group 2. Int J Prosthodont 2011;24:557–561.
A Servo-All-Electric system (TestResources 800L) was used to simulate mouth-motion (contact, load, slide, lift-off) cyclic loading under water (load orienta-tion and indenter as in SLF testing). Weibull cumula-tive damage analysis (Alta Pro 7, Reliasoft) calculated the probability of failure at a load of 200 N (two-sided 95% confidence bounds). Representative failed speci-mens were inspected using a polarized-light stereo-microscope (MZ-APO, Carl Zeiss MicroImaging) and scanning electron microscope (Model S-3500N, Hitachi).
Results
Mean SLF values were 765.70 ± 80.24 N for group 1, 673.44 ± 105.93 N for group 2, and 811.18 ± 101.83 for
group 3. β* values derived from the use-level prob-ability Weibull calculation were 1.57 (1.02 to 2.24) and 2.48 (1.61 to 3.83) for groups 1 and 3, respectively, indicating that fatigue accelerated the failure of both groups. The β value of 0.39 (0.24 to 0.62) for group 2 indicated that load dictated the failure mechanism (Table 2, Fig 2a). The Weibull parameter contour plot (Weibull modulus [m] versus characteristic strength [η = Eta]) showed m = 12.7 for group 1, m = 9.4 for group 2, and m = 14.4 for group 3 (Fig 2b). The char-acteristic strength was significantly higher (P <.05) for groups 1 (η = 469 N) and 3 (η = 466.9 N) compared to group 2 (η = 342.5 N). Groups 1 and 3 exhibited significantly higher reliability than group 2 (Table 2).
All specimens failed after MMSSALT testing (Table 3, Fig 3). Failure analysis is presented in Figs 4a to 4c. Table 1 Description of the Study Groups
Crowns (n) Implants Implant dimensions Group 1 21 Touareg ISP - 1038 3.75 × 10.0 mm Group 2 21 Touareg ISP - NP 1030 3.00 × 10.0 mm Group 3* 21 Touareg ISP - NP 1030 3.00 × 10.0 mm *Group 3 had two implants per restoration whereas groups 1 and 2 had only one.
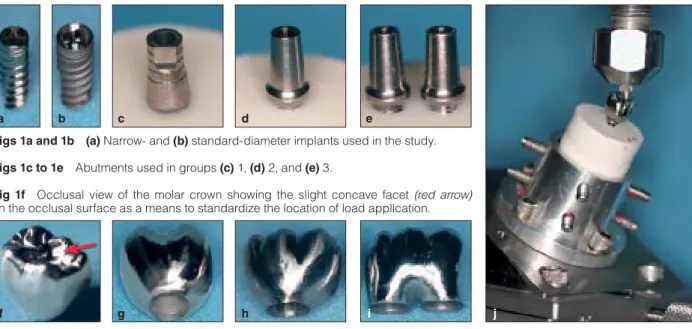
Figs 1a and 1b (a) Narrow- and (b) standard-diameter implants used in the study.
Figs 1c to 1e Abutments used in groups (c) 1, (d) 2, and (e) 3.
Fig 1f Occlusal view of the molar crown showing the slight concave facet (red arrow)
on the occlusal surface as a means to standardize the location of load application.
Figs 1g to 1i View of the abutment connection location for molar crowns in groups
(g) 1, (h) 2, and (i) 3. Fig 1j Setup for mechanical tests.
*This parameter describes failure rate changes over time (β < 1 = failure rate is decreasing over time, commonly associated with “early failures” or failures that occur due to egregious flaws; β ~ 1 = failure rate does not vary over time, associated with failures of a random nature; β > 1 = failure rate is increasing over time, associated with failures related to damage accumulation).
a f d h b c g e i j
Discussion
MMSSALT accelerated the failures of molar crowns supported by one standard-diameter implant and two narrow-diameter implants but not those supported by one narrow-diameter implant, as per β values.3 Fatigue
played little or no role in the failure of group 2 (β < 1), and hence, data were replotted according to fatigue load at failure. Weibull modulus (m) and characteristic strength were significantly higher for groups 1 and 3 compared to group 2. m is an indicator of strength reliability and the asymmetric strength distribution as Group 2
Use level line F = 18, S = 0 β = 0.39 Group 3 Use level line F = 18, S = 0 β = 2.48 Top CB-I Bottom CB-I 50 10 1 P ro ba bi lit y of f ai lu re ( 1 1.E + 6 1.E + 12 Cycles Group 2 F = 18, S = 0 Group 3 F = 18, S = 0 10 1 β 13 6 200 260 320 380 440 500 Eta (N)
Fig 2a Use-level probability Weibull calculation for the different
groups showing the probability of failure as a function of cycles. F = failure; S = survival; CB = confidence boundary.
Fig 2b Contour plot (Weibull modulus vs characteristic strength)
for group comparisons. Note the overlap between groups 1 and 3, showing no significantly different characteristics for strength, although both were significantly higher than that for group 2. F = failure; S = survival.
Table 2 Calculated Reliability for a Mission of 50,000 Cycles at a 200-N Load
Output Group 1 Group 2 Group 3
Upper 0.99 0.96 0.99
Reliability 0.99 0.89* 0.99
Lower 0.99 0.71 0.99
*Statistically significant difference.
Table 3 Failure Modes After Mechanical Testing According to Failure CriteriaUsed
Group 1 Group 2 Group 3
No. of implant/abutment/
screws (each specimen) 1 1 2
SLF Screw: 3 fractures
Abutment: 3 bendings Screw: 3 fractures Abutment: 3 bendings Screw: 2 bendings, 4 fractures Abutment: 4 bendings, 2 total fractures MMSSALT
Mild (n = 9) Screw: 9 fractures
Abutment: 9 total fractures Screw: 9 fractures Abutment: 9 total fractures Screw: 18 fractures Abutment: 12 partial and 6 total fractures Moderate (n = 6) Screw: 6 fractures
Abutment: 6 total fractures Screw: 6 fractures Abutment: 6 total fractures Screw: 1 bending, 11 fractures Abutment: 1 bending, 4 partial and 7 total fractures Severe (n = 3) Screw: 3 fractures
Abutment: 3 total fractures Screw: 3 fractures Abutment: 3 total fractures Screw: 1 bending, 5 fractures Abutment: 1 bending, 5 total fractures SLF = single load-to-fracture; MMSSALT = mouth-motion step-stress accelerated life testing.
a result of flaws within the material.4 A higher m indi-cates smaller or fewer defects (greater structural reli-ability), and a lower m is evidence of greater variability of the strength, reflecting more flaws in the system and a decrease in reliability.4 The reliability calculated
in this study indicated this relationship with a signifi-cantly lower percentage of crowns supported by one narrow-diameter implant (group 2) surviving, com-pared to both one standard-diameter implant (group 1) and two narrow-diameter implants (group 3).
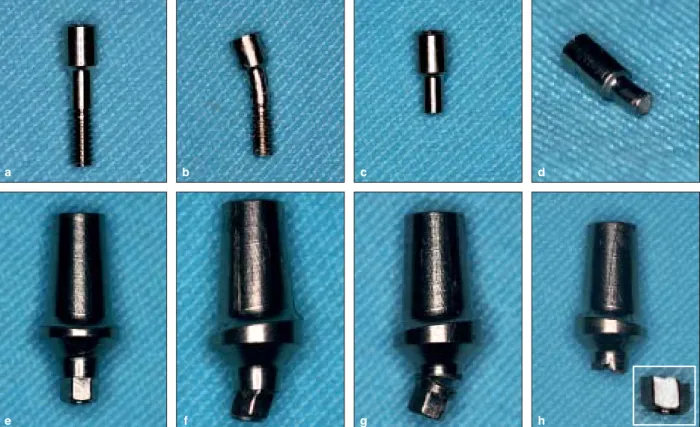
Fig 3 Failure modes of group 3 specimens after mechanical testing: (a) intact screw, (b) screw bending, (c and d) screw fracture
localized in the transition area from the smooth to the threaded surface, (e) intact abutment, (f) abutment bending, and (g and h) abutment partial and total fracture, respectively.
Fig 4a Representative scanning electron microscopic image of a screw fracture. The white arrows (beach marks) and the oval
dot-ted white line (compression curl) show typical marks indicating the direction (black arrow) of crack propagation from lingual to buccal. The red arrow shows the site of fracture origin.
Figs 4b and 4c Magnifications of abutments in (b) light-polarized and (c) scanning electron microscopes. The red arrows indicate
the screw mark held in the internal surface of the abutment. The white arrows show compression curls, also indicating the direction (black arrow) of crack propagation from lingual to buccal.
Compression curl a a c c e g b b d f h
implant to support crowns provides an alternative to clinicians in areas where bone volume is limited, cau-tion in the occlusal design of prosthetics, such as re-duction of the occlusal table and cusp inclines, can be suggested to minimize off-axis forces. However, if two narrow-diameter implants are indicated, a 12-mm space between implants is required.1 Implants also should be placed as parallel as possible to allow pas-sive fit for the cemented crown. Otherwise, angulated abutments may be used as an alternative to correct the misalignment.
Conclusion
The hypothesis that the reliability of molar crowns supported by one narrow-diameter implant was lower than that of one standard-diameter implant or two narrow-diameter implants was confirmed.
Studio for their support.
References
1. Balshi TJ, Hernandez RE, Pryszlak MC, Rangert B. A compara-tive study of one implant versus two replacing a single molar. Int J Oral Maxillofac Implants 1996;11:372–378.
2. Coelho PG, Bonfante EA, Silva NR, Rekow ED, Thompson VP. Laboratory simulation of Y-TZP all-ceramic crown clinical fail-ures. J Dent Res 2009;88:382–386.
3. Abernethy RB. Reliability and statistical analysis for predict-ing life, safety, survivability, risk, cost and warranty claims. In: Abernathy RB. The New Weibull Handbook. North Palm Beach, Florida: Dr Robert Abernethy, 2004:11–26.
4. Ritter JE. Predicting lifetimes of materials and material struc-tures. Dent Mater 1995;11:142–146.
5. Cho SC, Small PN, Elian N, Tarnow D. Screw loosening for stan-dard and wide diameter implants in partially edentulous cases: 3- to 7-year longitudinal data. Implant Dent 2004;13:245–250.
Literature Abstract
Esthetic outcomes with porcelain-fused-to-ceramic and all-ceramic single-implant crowns: A randomized clinical trial The aim of this randomized controlled trial was to compare the objective and subjective esthetic outcomes of two types of screw-retained single-implant crowns. Twenty patients were randomly assigned to two groups: For the control group, a screw-screw-retained porcelain-fused-to-metal crown was fabricated; patients in the test group received a screw-retained all-ceramic crown. Patients were followed-up with at baseline (B; 2 months after implant placement but before prosthodontic treatment), 2 weeks after crown insertion (CI), 1 year after CI (1Y), and 2 years after CI (2Y). At each follow-up appointment, the following objective measurements were recorded: mesial and distal papilla height (PH), clinical crown height at the implant site (CLi), clinical crown length at the adjacent teeth (CLt), width of keratinized mucosa at the implant site (KMi) and adjacent teeth (KMt), first bone-to-implant contact (FBIC), full-mouth plaque score (FMPS), and full-mouth bleeding score (FMBS). A pink esthetic score (PES) and white esthetic score (WES) were calculated for both study groups. In addition, nine expert clinicians not involved in the treatment and investigation were asked to visually inspect standardized intraoral photographs and to subjectively determine whether the crowns were all-ceramic or porcelain-fused-to-metal. The objective and subjective parameters between the groups at B, CI, 1Y, and 2Y and differences between each study time point were analyzed using the Mann-Whitney U test. The significance level was set at a P ≤ .05. A paired t test was used to compare the PES and WES, with the significance level set at P = .05. No implant or abutment failures were recorded during the entire length of the study. There were no statistically significant differences for PH, CLt, CLi, KMi, KMt, FMPS, FMBS, and FBIC at all time points, except FMPS at 2Y. Out of a maximum score of 20 for PES and WES, the porcelain-fused-to-metal and all-ceramic groups scored a mean value of 13.89 and 13.12, respectively, with no statistically significant differences between scores. The expert clinicians’ ability to correctly determine the crown type for both groups was not significantly different from the value that would be expected from random guessing. The authors correctly concluded that without specific esthetic parameters such as tooth morphology, interproximal papilla, and level of cervical margins, the implant crown material alone would not be sufficient to ensure an optimal esthetic outcome.
Gallucci GO, Grütter L, Nedir R, Bischof M, Belser UC. Clin Oral Implants Res 2010;22:62–69. References: 20. Reprints: Dr German O.
Gallucci, Department of Restorative Dentistry and Biomaterials Sciences, Harvard School of Dental Medicine, Harvard University, 188 Longwood Avenue, 02115 Boston, MA, USA. Email: german_gallucci@hdsm.harvard.edu—Elvin W.J. Leong, Singapore