An Explicative and Predictive Study of Employee Attrition using Tree-based
Models
Nesreen El-rayes MTSM at NJIT [email protected] Michael Smith MTSM at NJIT [email protected]Stephen Taylor (Corr. Auth.) MTSM at NJIT
Abstract
We develop tree-based models to estimate the probability of an employee leaving a firm during a job transition from a dataset of anonymously submitted resumes through Glassdoor’s online portal. Dataset construction and summary statistics are first summarized followed by a more in depth examination through four exploratory studies. Insights provided by these studies are then used to engineer features that serve as input into subsequent attrition related predictive models. We finally perform a thorough search through several dozen binary classification techniques in the cases of an original and extended feature set. We find tree-based methods including random forests and light gradient boosted trees provide the overall strongest predictive performance. Finally, we summarize ROC curves for several such models and describe future potential research directions.
Keywords— employee attrition, binary classification, retention strategy
1.
Introduction
Building and maintaining a stable, productive, collaborative, and high-quality workforce is a primary concern of the majority of corporate officers as success in this area tends to be a key contributing factor to the overall prosperity of the firm, c.f. [1] for a survey of relevant issues. Inevitably, all firms will experience employee attrition. Involuntary attrition is often the result of profitability and performance pressures, department or business line obsolescence, and mergers and acquisitions, among other factors [2, 3, 4]. In contrast, voluntary attrition is driven predominately by employee concerns [5]. Such considerations may focus around, but are not limited to, managerial direction, compensation and benefits, firm culture, firm desirability and location, promotion potential as well as non-firm specific motivations, e.g. medical conditions
or retirement.
A central objective of the majority of human resource departments is to understand the root causes behind voluntary employee attrition and develop an associated mitigation strategy. Effectively navigating such issues generally results in explicit positive monetary effects stemming from increased firm revenue and cost reductions manifested through the work product of highly performant retained employees. In addition, identifying and resolving issues found to be common to employee attrition often implicitly enhances firm culture and workplace desirably, which in turn, enables the recruitment of higher quality staff who further improve retention, firm operation, and business practices, c.f. [6, 7]. The compounding effect of the employee attrition feedback loop on overall firm success or failure provides, in our view, the essential motive to investigate the issue.
Traditionally, employee attrition and retention related questions tend to be examined by qualitative and anecdotal measures. Specifically, human resources staff typically conduct exit interviews after an employee provides a resignation notice in order to ascertain the motivations behind the decision to leave [8]. Although these conversations may be direct and candid, i.e. in the event an employee is leaving for a significantly more senior role or needs to change geographic location for family related purposes, in actuality, human resources staff encounter considerable difficulty discerning the employee’s true motivation. These circumstances impact the employee attrition data aggregation and quality assurance process by making it cumbersome, at a minimum, which leads to additional difficulties determining which attrition issues should be of primary importance for management to resolve. In addition, employee attrition data is generally highly confidential and only accessible to key stakeholders internally within a firm. These facts have been major impediments to the progression of academic research on this topic.
Recently, internet based platforms such as Glassdoor and LinkedIn, which are oriented towards working
professionals, have amassed large quantities of publicly available information from individual employee resumes including employment history, frank reviews of firm culture, desirability, and management as well as anonymous feedback. Although this data often lacks attritional motivation information at the individual employee level, when combined with aggregate firm culture and management rankings, one may glean a number of insights into the collective behavior and motivations behind individual decisions to transition to a new employer. Our major aim is precisely in this vein. More specifically, we conduct a quantitative data analysis of employee attrition motivations as well as develop predictive models that will enable human resources staff to identify employees whose firm separation may be imminent.
Several authors have studied employee attrition from a predictive modeling perspective. Early work in [?], examined logistic and probability regression model applications to voluntary employee turnover prediction. This was extended in [9, ?] where the authors advocate for decision tree based classification approaches and demonstrate associated improved model performance. In [?], the authors provide a comparison of several employee attrition classification studies on an HR Information Systems and Bureau of Labor and Statistics database. Many of these techniques were incorporated into the XGBoost ensemble model in [?]. More recently, in [?], the authors include feature engineering to improve model performance accuracy and examined tradeoffs between many traditional classification techniques including Naive Bayes, SVM, random forests, etc. on a synthetic employee churn dataset provided by IBM. Our main aim is to continue in the direction of broadening the search over classification methods and feature engineering techniques to ultimately improve classification performance.
The main contributions of this work include an extension of [10] where the authors examine employee attrition and retention issues based upon a collection of approximately five thousand anonymously submitted resumes to Glassdoor. Specifically, we examine industry job transition patterns, dependencies between company ratings provided on the Glassdoor website, and distributional related aspects of the variables contained in this dataset. We further consider how to apply modern binary classification methods to predict the likelihood of employee attrition. In particular, we examine the performance of the linear model considered in [10, 11, 12] against logistic regression, decision tree classifiers, and random forests. We then extend the feature set techniques considered in [?] to include PCA
based rating features. In addition, we expand upon the comparison work in [?, ?] by performing a thorough search through a suite of dozens of binary classification methods. These models include those listed above as well as Bayes nets, SVMs with varying kernels, nearest neighbors with varying distance functions, gradient boosted trees, etc., and determine the top performers to be tree-based models from a ROC curve perspective. Lastly, we delineate future data acquisition, analysis and model development extensions that we seek to investigate in future work.
The above mentioned binary classification techniques exhibit several commonalities which we now summarize. Binary classification is the process of assigning elements of a dataset into one of two possible groups based upon the values of their associated features. This is achieved by initially separating the full dataset into distinct training and testing subsets. Next, features defined as functions of the training data are constructed and the classifier is fit on the training set. This fitting process varies widely according to the model under consideration. Specifically, in the case of the linear or logit regression models considered below, parameters are determined by minimizing the mean squared error and maximizing the model likelihood function respectively. In decision tree and random forest models, an initial root node is selected by splitting each feature based on a threshold and examining the resulting Gini score which provides a measure of the purity of the resulting subset separation. The node and threshold corresponding to the minimum Gini index are selected as a root node and this process is then repeated. Random forests are constructed from an ensemble of decision trees fit on the training dataset which are then averaged to make a final prediction. Gradient boosted trees differ by fitting an initial decision tree and then iteratively fitting additional trees to the associated residuals. Finally, there are several common performance metrics that may be utilized to compare binary classifers. These include classification accuracy, and ROC curves which are constructed from the four possible classification outcomes. Model performance is then assessed by computing these metrics on a testing set which represents new data that was not utilized during the fitting process.
This article is organized as follows: In Section 2, we describe the content of the job transition dataset being considered and compile a number of summary statistics that motivate later model development. In Section 3, we pursue a more detailed examination of this dataset by identifying industry transition patterns, variable importance related to attrition identification, and rating variable independence. Then in Section
4, we consider several models to address the binary classification attrition problem and provide a corresponding performance comparison. Finally, in Section 5, we summarize our main findings and provide ideas for future extensions of this work.
2.
Data Description and Summary
We first turn to describing the content extracted from a collection of employee resumes that will form the basis for subsequent attrition studies. Next, we provide a variety of summary statistics of this information that are relevant for the design of predictive models. Then we discuss our data normalization process and features constructed from this original data which are utilized as inputs into these models.
2.1.
Data Source Description
We worked in conjunction with the authors of [10] to obtain a collection of 5550 examples of employee job transitions between 2007 and 2016 which were sourced from an extensive proprietary database of resumes shared anonymously though Glassdoor’s platform. A job transition is defined to be any instance of an employee listing a new role on their resume which may be associated with the current or a new employer which distinguishes between internal and external moves. Internal moves are typically significant in the sense that the employee was either changing roles or was being promoted within an organization. External moves are of interest for our attrition studies since in this situation employees leave the original firm entirely.
We summarize several salient features of the dataset construction process and expound upon details relevant to model development below; we refer the reader to [10] for a complete description of the data source.
Each employee job transition contains 45 attributes. Relevant attributes include employee specific information; namely, a binary identifier indicating if the employee remained within or left their original firm, the start and end dates of employment at the original firm, the employee’s average salary during their tenure with the original employer, and the employee’s job title. In addition, each transition includes employer related information. Specifically, employer name and metro location, the industry sector of which the employer is a member, the founding year of the firm, and the total number of employees. Finally, employer rating information is included. Particular ratings are given for the following Glassdoor created categories: overall, firm CEO, friend recommendation business outlook, career opportunities, compensation and benefits, culture and values, worklife balance, and
senior management performance. Finally, this dataset is fully populated with the exception of missing values in approximately 6% of the original and new employer founding year values, respectively; such null values are disregarded only in studies that depend upon this variable below.
2.2.
Summary Statistics, Feature Engineering
and Data Normalization
First, several summary statistics are presented in order to outline the main content of the dataset that will be further explored below. Next, we discuss our feature construction process to build inputs that will be important to latter exploratory studies and predictive model design. Finally, we describe the quantile normalization process that is utilized in order to ensure all variables are on the same scale prior to being input into the predictive models.
Of the 5550 total employee job transitions in this dataset, a total of 1429 employees remained at their present firm whereas a majority of 4121 transitioned to a new firm. This confirms information provided in [10] indicating that approximately three quarters of employees leave their employer during a job transition. We now graphically summarize several distributional aspects of attributes associated with these transitions.
Compensation, benefits, and other forms of financial remuneration typically play a critical role in an employee’s job transition decision process. In fact, an offer to substantially increase one’s salary is a common impetus for a job transition. In the left subplot of Figure 1, we plot the average annual salary distribution of the employee during their tenure at their original employer over our full dataset. Salaries ranged from $15,140 to $240,000 per year. In the right subplot of Figure 1, we
50K 100K 150K 200K Avg. Annual Salary Dist.
0 2 4 6 0 100 200 300 400 500 600
700Tenure Orig. Empl. (Years)
Figure 1. Employee average salary and tenure distribution at original employer
Table 1. Original employer job transition counts for industries with more than 50 employees in our dataset.
Industry Count Industry Count
Retail 1357 Manufact. 191
Education 766 Insurance 144
Info. Tech. 718 Media 113
Finance 590 Acct. & Legal 101
Bus. Services 369 Energy 92
Food Services 275 Travel 70
Telecom 248 Biotech 62
Health Care 208 Transportation 58
employer prior to a job transition which is similar to summary information presented in [10].
Next, in Table 1, we count the industry of the original employer of all job transitions being considered and display all such industries exceeding 50 transitions. Note that the Retail and Education industries are overrepresented which provides a further indication as to why this dataset includes a higher occurrence of lower salaries than the full national wage distribution. In addition, we have sufficient data to study employee industry transition patterns for many of the industries listed in this table which we explore in more detail in the subsequent section.
In Figure 2, we display two additional histograms related to original employer specific information. In the left subplot, we present the distribution of the original firm’s founding date. This histogram was left truncated to begin at 1750 with a minimum founding date of 1625 for the City of New York. Typically, firms with earlier founding dates are municipalities or governmental organizations. Note that we have an
1800 1900 2000
Orig. Year Founded 0 100 200 300 400 500 600 Bin Count
Orig. Empl. Founding Year
0 2 4 6
log10(Orig. Tot. Emps.)
0 100 200 300 400
Log of Orig. Num. Emp.
Figure 2. Original employer founding year and employee number distributions
effective sampling of older and modern firms with a median founding date of 1962. In addition, we consider relatively few firms that were founded within the past
twenty years in this sample as indicated by the height of the final bar of the histogram. Next, in the right subplot of Figure 2, we display the log-histogram of the number of employees at each original firm being considered. The majority of employees work at larger firms which employ between ten thousand to one million people. In particular, only a small fraction of employees work at small firms with fewer than one hundred colleagues. Finally, the largest employer is Walmart with approximately 2.2 million employees.
Next, in Figure 3, we display original employer violin plots of ratings data in nine categories presented for evaluation on Glassdoor’s website which include career opportunities, compensation and benefits, company culture, overall rating, senior management, work-life balance, outlook, CEO performance, and friend recommendation ratings. Here mean values are depicted by white circles within each form whereas standard deviations about either side of the mean are displayed by centered black bars. The general shape of each violin is determined by a symmetric display of a kernel density estimate of the probability distribution of each rating variable. Ratings with values in the
Ca
r.
Comp. Cult. Over. Mgmt. W.
L. groups 1 2 3 4 5
Orig. Comp. Ratings [0-5]
Out. CEO F riend groups 0.0 0.2 0.4 0.6 0.8 1.0
Orig. Comp. Ratings [0-1]
Figure 3. Violin plots of original employer ratings information sourced from Glassdoor reviews [0,5] range are plotted in the left subplot and those between [0,1] are plotted in the right. We note that no actual ratings fall outside these bounds; the slight graphical extensions beyond the boundaries in the plot are due to artifacts of the kernel density estimation procedure required to produce the visualization and are not representative of the true data. In addition, note that one can see management ratings tend to be lower overall than other related ratings in the left subplot. In addition, cultural ratings exhibit the greatest dispersion, whereas career ratings are comparatively concentrated. The distributions of [0,1]valued ratings vary considerably.
In particular, the CEO rating distribution is concentrated to the right of the mean largely to a high occurrence of maximum ratings in approximately 9% of the data. In contrast, company outlook ratings are right-skewed with a mean below the average score of 0.5. Both are less dispersed than the friend recommendation rating distribution that also is slightly oriented towards the positive side.
We now describe several elementary features that we construct from the original data that will be useful in the below exploratory and predictive studies. In particular, we will consider the percentage salary increase after a transition has been made. In addition, we will consider quantile normalized absolute changes in each rating category below, e.g. if an employee moved from a 75%-tile overall rating employer to an 85%-tile, we will save the 10%-ile difference as a feature. We feel that these features are partially reflective of the thought process of an employee who typically leaves an organization for higher salary and improved company culture based on the relative rather than absolute differences in these variables, and thus include them as features. We finally note that all variables are quantile normalized in our predictive model studies so as not to bias methods due to scaling effects.
3.
Exploratory Insights
Now we describe a number of findings originating from the results of an exploratory analysis of the job transition dataset which go beyond the level of summary statistics. In particular, we examine to what extent salary increases motivate job transitions. In addition, if employees decide to change industry, we study which industries they are most likely to move towards conditioned on their original industry. We then identify which variables when partitioned into employees that remained or left their firm differ the most from a distributional perspective to gain intuition on what factors should be most important for subsequent model development. Next, we investigate to what degree the nine rating categories are dependent and compute the effective dimension of these variables. Finally, we examine the relationship between firm founding year, overall original firm rating, and whether or not an employee remained with or left their original firm during a job transition.
3.1.
Job Transition Salary Changes
An opportunity to earn a greater salary is often described as a primary motivation for a job transition. We seek to investigate this from a quantitative perspective, and first note that approximately
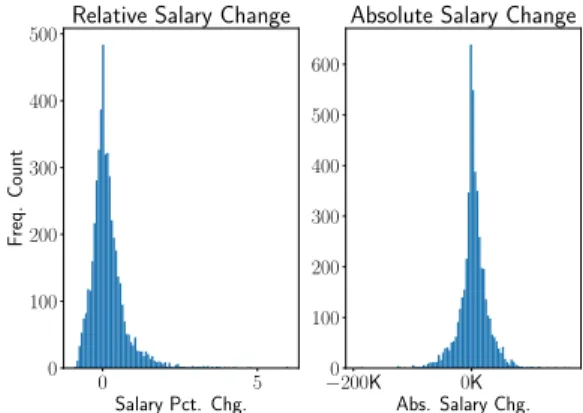
13% of transitions occurred without a change in salary. In Figure 4, we display relative (percentage increase/decrease) and absolute salary changes. First
0 5 Salary Pct. Chg. 0 100 200 300 400 500 F req. Count
Relative Salary Change
−200K 0K Abs. Salary Chg. 0 100 200 300 400 500 600
Absolute Salary Change
Figure 4. Relative and absolute salary differences after a job transition
note that this figure illustrates the need for considering features such as relative salary change since the asymmetry of the relative change salary distribution is prominent whereas this is not as clear in the absolute change plot. Second, note that there is a wide range of magnitudes of relative salary changes. In particular, approximately 5% of employees received a salary increase of more than 150%. In addition, 36% took a reduction in salary as a part of their transition.
In the extreme case, one employee transitioned from a teaching assistant to education Director at Michigan State University and received approximately a 6X salary increase. In the opposite direction, one employee transitioned from a $230,000 salary as a Managing Director in the Education industry to a Logistics Coordinator with a $43,600 annual salary.
3.2.
Industry Transition Patterns
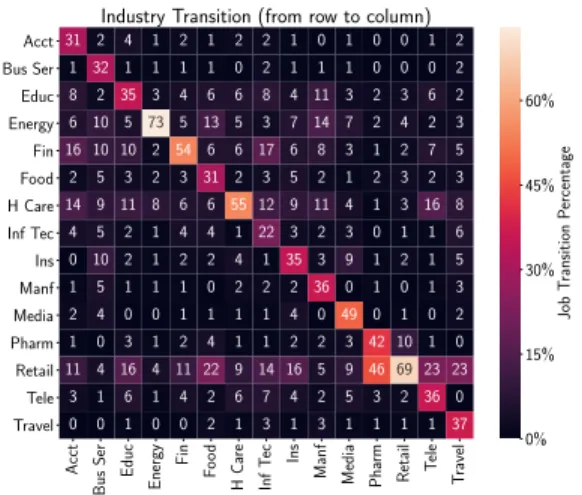
Next, we examine how employees either choose to move to a new industry or remain in that of their original firm as a consequence of their job transition. In Figure 5, we display a heatmap of the percentage of employees that started in an industry indicated by the lower column labels and transitioned into the industry in the row labels. Note that both the energy and retail industries tend to retain a considerably greater proportion of their employees than the others. An interesting example along these lines is the Pharmaceutical industry of which 46% of employees transition to the retail industry while only 42% remain; this is the only industry in which a greater percentage of employees transition to another industry rather than remain in the original. Moreover, the information technology industry has the lowest
Acct Bus Ser Educ Energy Fin F oo d H Ca re Inf T ec Ins
Manf Media Pharm Retail T
ele T ravel Acct Bus Ser Educ Energy Fin Food H Care Inf Tec Ins Manf Media Pharm Retail Tele Travel 31 2 4 1 2 1 2 2 1 0 1 0 0 1 2 1 32 1 1 1 1 0 2 1 1 1 0 0 0 2 8 2 35 3 4 6 6 8 4 11 3 2 3 6 2 6 10 5 73 5 13 5 3 7 14 7 2 4 2 3 16 10 10 2 54 6 6 17 6 8 3 1 2 7 5 2 5 3 2 3 31 2 3 5 2 1 2 3 2 3 14 9 11 8 6 6 55 12 9 11 4 1 3 16 8 4 5 2 1 4 4 1 22 3 2 3 0 1 1 6 0 10 2 1 2 2 4 1 35 3 9 1 2 1 5 1 5 1 1 1 0 2 2 2 36 0 1 0 1 3 2 4 0 0 1 1 1 1 4 0 49 0 1 0 2 1 0 3 1 2 4 1 1 2 2 3 42 10 1 0 11 4 16 4 11 22 9 14 16 5 9 4669 23 23 3 1 6 1 4 2 6 7 4 2 5 3 2 36 0 0 0 1 0 0 2 1 3 1 3 1 1 1 1 37
Industry Transition (from row to column)
0% 15% 30% 45% 60% Job T ransition P ercentage
Figure 5. Industry transition percentage: original firm industry given in columns and new/same in rows
retention rate with more than half of transitions out of this industry going to the financial, health care, retail, and education sectors. Finally, we note that the retail industry is the most popular industry to transition into overall from a different original industry.
3.3.
Attrition Variable Importance
Identification
Now, we separate the job transition dataset into a retention subset where employees remained with their current employer, and an attrition set for those who choose to find a new employer. We compare the distributions of all numerical variables available for both groups in order to identify which variables have the most distinct distributions. In Figure 6, we display the distributions of the original firm friend recommendation and worklife balance rating variables for employees who stayed with their original firm (green) or transitioned to a new one (red). In addition, we note that the cultural rating distributions exhibited a similar although less pronounced behavior.
3.4.
Firm Ratings Principal Components
When users fill out Glassdoor surveys that ultimately determine the company ratings provided in the job transition dataset, they are asked to rate a firm in the nine categories described in Section 2.1. It is natural to allows one’s overall view on the firm influence the manner in which ratings are assigned for each of these categories, i.e. they are not necessarily independent. We will conduct a principal component analysis on a quantile normalized version of the full original ratings dataset of nine categories in order to ascertain the
0.0 0.5 1.0 Friend Rating 0.0 0.5 1.0 1.5 2.0
Friend Rec. Distributions
Left Stayed 2 4 Worklife Rating 0.0 0.2 0.4 0.6 0.8 Worklife Distributions Left Stayed
Figure 6. Friend recommendation and worklife rating distribution for internal and external transitions
effective dimensionality of this information.
Specifically, letrijfori= 1, . . . , n= 5550andj= 1, . . . ,9denote thei ratings available forj categories. Consider the sample covariance estimator of the quantile normalized ratings data
ˆ Σ = 1 n−1 n X i=1 (rji −¯rj)(rij−r¯j)T, (1)
where here r¯j denotes the mean value of the j-th variable. Then, we perform an eigen-decomposition
ˆ
Σ =QΛQ−1 (2)
where here thei-th vector ofQis thei-th eigenvector of
ˆ
Σwith corresponding eigenvalueλi which is the(i, i)
entry of the diagonal matrix Λ. This decomposition holds sinceΣˆ is assumed to be positive definite, and in addition, we take an orderingλ1≥λ2≥. . .≥λ9, c. f.
[13] for an overview of principal component analysis. In the left subplot of Figure 7, we display a heatmap of the original employer ranking correlation matrix. Note that all pairs generally exhibit high correlation which demonstrates that it is necessary to account for the dependency structure of the ranking variables. In the right subplot, we display the percentage variance explained curve whose values are defined to be wi =
Pi
j=1λi/P
9
j=1λj. The first principal component
contains just under 70% of the variation of the data and is given in normalized form by
q1= [0.27,0.34,0.30,0.28,0.36,0.38,0.37,0.37,0.30]
(3) which is near a uniform weighted average of the rankings with additional weight placed on career opportunities, overall rating, friend recommendation, and senior management rankings. In addition, the
Outlo
ok
Opp
or
CEO Comp
Culture Overall Friend Mgmt Life Outlook Oppor CEO Comp Culture Overall Friend Mgmt Life 10.57 0.52 0.44 0.56 0.56 0.55 0.59 0.35 0.5710.57 0.6 0.71 0.81 0.76 0.77 0.52 0.52 0.5710.44 0.64 0.65 0.65 0.65 0.47 0.44 0.6 0.4410.52 0.65 0.6 0.54 0.5 0.56 0.71 0.64 0.5210.84 0.8 0.83 0.65 0.56 0.81 0.65 0.65 0.841 0.89 0.870.72 0.55 0.76 0.65 0.6 0.80.89 10.82 0.68 0.59 0.77 0.65 0.54 0.830.870.8210.68 0.35 0.52 0.47 0.5 0.65 0.72 0.68 0.681 Rating Corr. Matrix
0.5% 0.6% 0.8% 0.9% Co rrelation 2 4 6 8 Numbers of PCs 0.70 0.75 0.80 0.85 0.90 0.95 1.00
Cum. Var. Explained
Figure 7. Original employer ranking correlation matrix and percentage variance explained curve
percentage variance explained gradually increases to approximately 92% at five principal components and there is no clear separation between the signal and noise portions of this data. We conclude that it will be useful to include the quantile normalized ranking weighted average in our subsequent predictive studies, but we also retain all ratings variables given these percentage variance explained results.
3.5.
Attrition, Founding Year, and Overall
Rating
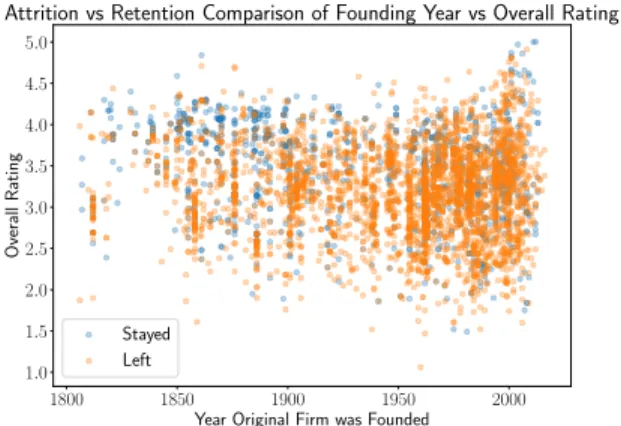
Finally, we consider an interesting relationship between the founding year of each employee’s original firm and the corresponding overall rating that they gave to the firm. In Figure 8, we display two scatter plots of the original firm founding year against the overall original firm rating for the groups of employees that stayed and left their original firm in blue and orange respectively. Note that these plots exhibit several
1800 1850 1900 1950 2000
Year Original Firm was Founded 1.0 1.5 2.0 2.5 3.0 3.5 4.0 4.5 5.0 Overall Rating
Attrition vs Retention Comparison of Founding Year vs Overall Rating
Stayed Left
Figure 8. Scatterplot of overall original firm rating vs original firm founding year
interesting features. First, if an employee gave their original firm a high rating and the original firm year
was founded prior to say 1900, then a substantial majority of such employees remained at their original firm. In addition, since most firms with founding years in this range are municipalities, this suggests government employees who are happy with their current firm are highly inclined to remain at that firm. In addition, note that the overall ratings range varies as a function of the original firm founding year. In particular, ratings generally fall within a [2.5,4.0] interval until approximately near a founding year of 1950 where they further widen to the greatest range for newer firms founded past 2000. Finally, lower overall ratings result in higher frequencies of employee attrition than higher ratings.
4.
Towards an Attrition Model
We now focus on extending beyond the prior exploratory data analysis and systematically construct a series of increasingly complex but more accurate models to predict whether an employee will remain with their original employer or leave for another firm during a job transition. We consider two datasets below consisting of the original variables considered in [10] and then an extended version which includes additional features. Initially, we consider simple linear and logistic regression as well as decision tree classifiers to establish baseline results. We then more systematically search through several dozen binary classification methods to identify which have the strongest performance from an ROC curve perspective. We find that tree-based models tend to be identified in this regard and discuss the top performers in detail.
In all models considered, we uniformly randomly sample our full dataset into an 80% training set and 20% test set. All models are trained using 5-fold cross validation on the training set and all performance results are based solely on a single evaluation of each model on the hold-out test set.
We finally note that we utilized Python bindings of open source implementations of the classification models considered below. The majority of models may be found in the scikit-learn Python package while privately maintained packages such as LightGBM for gradient boosted trees and tensorflow for neural net based classification were used directly from their source made available on GitHub. In addition, we use the Python package pandas for data wrangling tasks, scipy and numpy for model implementation, and matplotlib and seaborn for visualization.
4.1.
Linear Regression
First, we recall that in [10] the authors fit a linear model
y=βTx+, (4)
where here β = (β0, . . . , βm), x = (1, x1, . . . , xn),
with random error. The target variableyis interpreted as a probability of leaving the original employer andxi
denote normalized versions of the ratings, salary, job length, and associated control variables including the employee’s industry, job title, and original employer’s metro area.
This model is fit in the usual fashion through
ˆ
β = (xTx)−1xTy, (5)
which produces a decision function for each job transition from which we may classify each employee as more likely to remain or leave their current employer; here predicted probabilities are capped at 1 and floored at 0. We include this model for purposes of comparing to [10].
4.2.
Logistic Regression
We next extend to a logistic regression model with the same variables as the linear model which is more suitable for probability prediction and in particular, binary classification applications. Specifically, we fit the model
y= (1 + exp(−βTx))−1, (6)
where here again the targety represents the probability of leaving the firm. Note now that y ∈ [0,1]which are appropriate bounds for a probability which may be considered as an advantage over linear regression based classification. This model is fit to data through maximum likelihood estimation and we consider is as a baseline model due to its simplicity.
4.3.
Decision Tree Classifier
Next, we explore a variety of additional binary classification models utilizing only the original employer variables described above. In particular, we examined quadratic discriminant based classifers, support vector classifiers, and tree-based methods, among a number of other techniques. We found that decision trees provided the strongest predictive performance relative to model complexity. In particular, if we significantly increase model complexity, we can marginally outperform a decision tree classifer; however, it is likely such gains may not be substantive and are a result of implicit overfitting.
When constructing decision tree models, we explored trees with depths from 2 to 10 and found that depth 5 trees has the strongest overall performance from an area under their associated ROC curves point of view. A decision tree is fit to the attrition data by using a greedy technique of iteratively determining which feature and threshold minimizes prediction error at each level of the tree. This method is iteratively applied until we arrive at a level 5 depth tree, and then branches that only marginally contribute to the ROC curve performance are pruned.
4.4.
Utilizing the Full Feature Set
Now, we extend the previous methods by considering an extension of the prior dataset. In order to build an analogous dataset in practice, one would require access to an employee’s salary increase post job transition. In addition, we add in the weighted rating PCA feature described in Section 3.4 in these studies. We note that the PCA features utilized in the predictive models were constructed only using training set data.
We consider the performance of the linear and logistic classifiers and decision tree in this case as well. In addition, we perform a broader search over dozens of binary classification methods in order to determine which one has the best performance from a ROC curve perspective. In particular, we now considered an ensemble of general linear models, neural network based classifiers, support vector classifiers with a variety of kernels, nearest-neighbor classifiers, and many more. The highest performing model was a light gradient boosted tree classifer with early stopping which exhibits similarities to the random forest previously considered. Specifically, gradient boosting combines many decision trees into an ensemble model in a manner that minimizes the mean squared error of predicted vs actual target values. This process is inheritably iterative and the early stopping criteria terminates the process when the addition of further trees no longer improves the out of sample predictive performance of the model.
The root nodes of the trees composing this model tend to be associated with the compensation and benefits relative change feature and many branch nodes are rooted in other rating features, especially the overall rating, career opportunities, and friend recommendation features.
4.5.
Model Performance Comparison
We finally evaluate the performance of all binary classifiers considered by displaying their receiver operating characteristic curves. Each model assigns a probability of the employee remaining at or leaving the
firm for each job transition. To generate the ROC curve, we set a probability threshold from which prediction probabilities below this value will be assigned to the stay group and others will be assigned to the leave group. The true positive rate defined to be the total true positive predictions divided by the sum of the true positives and false negatives is plotted against the false positive rate defined to be the number of false negatives divided by the sum of true negatives and false negatives.
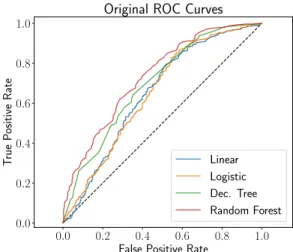
First, models trained on the original variable set described in [10] have their ROC curves displayed in Figure 9. Note that the performance of
0.0 0.2 0.4 0.6 0.8 1.0
False Positive Rate
0.0 0.2 0.4 0.6 0.8 1.0 T rue P ositive Rate
Original ROC Curves
Linear Logistic Dec. Tree Random Forest
Figure 9. ROC curves for models trained on original variables
the linear and logistic regression models is very similar. In addition, the five level decision tree has stronger overall performance, and the random forest which is an ensemble model of such trees has the greatest performance overall. However, the additional complexity of the random forest raises the point that the simpler single decision tree may be preferred in practice since gains for the random forest are marginal. Here the area under the ROC curve for the linear, decision tree and random forest is 65%, 70%, and 73%, respectively.
We next consider models evaluated on our extended feature set; specifically, we add the rating PCA feature and the relative change in the employee’s salary after a job transition. The updated ROC curves are displayed in Figure 10. Here the areas under the ROC curves are given by 67%, 58%, 73%, 75%, and 76%, which demonstrates we are able to slightly improve the performance over the prior best model in the case of the light gradient boosted tree. In addition, note that the linear regression and random forest models have very similar performance as on the original dataset whereas the logistic regression model degrades in performance.
0.0 0.2 0.4 0.6 0.8 1.0
False Positive Rate
0.0 0.2 0.4 0.6 0.8 1.0 T rue P ositive Rate
Full Feature ROC Curves
Linear Logistic Dec. Tree Light GBT
Figure 10. ROC curves for models trained on full feature set
The decision tree model also improves slightly. Both examples provide a strong indication that tree-based models provide a good framework for the design of employee attrition classification techniques.
Next, we examine feature importance in the light gradient boosted tree example by randomly permuting the values of each feature individually in the training set, refitting the model, and computing the area under the resulting ROC curve. We found that the average salary feature resulted in the greatest performance decline. The rating PCA feature decreased performance 31% of the average salary feature. Similarly, the total number of employees and old job length had 14% and 12% decreased performance when compared with the average salary feature.
Finally, we note that dozens of binary classification models were compared in this study. Of these, five strong performers include an XGBoost tree classifier, the extra trees classifier in the sci-kit learn Python package, elastic-net, l2 regularized logistic regression,
and a neural-net classifier built with tensorflow; these models have AUC values of 75%, 70%, 69%, 68%, and 68%, respectively.
5.
Conclusions and Extensions
In summary, we have obtained a dataset of employee job transitions generated from anonymously submitted resumes through Glassdoor’s online portal. We found several insights upon an initial study of this data which provided an indication that compensation, company culture, and senior management performance play major roles in influencing an employee’s job transition decision. We then further investigated aspects of this
data including generating an industry job transition table, identify which variables had the most significant changes in distribution for employees that stayed or left their current employers, and constructed ratings features based on a PCA study. We then applied several binary classification models to the employee attrition problem and found that tree-based methods tended to offer the strongest performance. In particular, in the case of the original variables specified in [10], simple decision trees offer strong performance whereas one of their extensions, random forests, provided a marginal increase at the addition of increased complexity. Finally, we added two new features including our original PCA based ratings feature and the percentage salary increase of the job transition.
We finally describe several ideas that we plan on pursing in future work. First, we would like to construct a more extensive dataset of employee job transition data that goes well beyond the 5550 data points considered in this article. In particular, we hope to work with Glassdoor and/or LinkedIn to build a larger collection of employee job transitions and associated company ratings. In addition, we would like to obtain company specific job transition information from LinkedIn which would permit more detailed attrition studies at the company and industry level to further the work of [14]. Furthermore, factors such as employee engagement and absence are known to have a strong connection with employee attrition [15, 16]. In addition, it would be of interest to obtain firm specific attrition data prior and after attrition prevention programs were commenced. The main aim would be to assess the effectiveness of such programs and identify if the programs that yielded the strongest results exhibit commonalities.
Lastly, one could then develop company specific models, assuming sufficient data exists, that may be able to further extract information related to nuanced attrition patterns for that particular company. The results may then be merged with qualitative information gathered at exit interviews which in turn can be used by human resource staff to establish an attrition prevention plan.
Acknowledgements: The authors would like to
acknowledge Andrew Chamberlain, Chief Economist at Glassdoor, for sharing the job transition dataset that served as the data source for this study. The authors would also like to acknowledge the three anonymous referees whose comments greatly improved the content and language of this proceeding.
Funding:This research did not receive any specific
grant from funding agencies in the public, commercial, or not-for-profit sectors.
Competing Interests: The authors have no
competing interests.
References
[1] P. Babington, Building the Competitive Workforce:
Investing in Human Capital for Corporate Success. Wiley, 1993.
[2] D. Datta et al., “Causes and effects of employee
downsizing: A review and synthesis,” Journal of
Management, vol. 36, no. 1, pp. 281–348, 2009.
[3] A. de G. and J. V. L., The economics of skills
obsolescence: A review, vol. 21. Research in Labor Economics, 2002.
[4] K. O’Shaughnessy and D. Flanagan, “Determinants of layoff announcements following m&as: an empirical
investigation,” Strategic Management Journal, vol. 19,
no. 10, pp. 989–999, 1998.
[5] S. Moninder et al., “An analytics apporach for
proactively combating voluntary attrition of employees,”
IEEE 12th International Conference on Data Mining Workshops, pp. 317–323, 2012.
[6] G. R. Cook, D. S. & Ferris, “Strategic human
resource management and firm effectiveness in industries
experiencing decline,” Human Resource Management,
vol. 25, no. 3, pp. 441–458, 1986.
[7] S. J. Freeman, “Organizational downsizing as
convergence or reorientation: Implications for human
resource management,”Human Resource Management,
vol. 33, no. 2, pp. 213–238, 1994.
[8] D. Giacalone, R. A. & Duhon, “Assessing intended
employee behavior in exit interviews,” The Journal of
Psychology, vol. 125, no. 1, pp. 83–90, 1991.
[9] A. D. . A. A. B., “Analyzing employees attrition
using decision trees,”Computing Information Systema &
Development Infromatics, vol. 4, no. 1, pp. 17–28, 2013. [10] M. Smart and A. Chamberlain, “Why do workers quit?
the factors that predict employee turnover,” Glassdoor
Research Report Whitepaper, pp. 1–19, 2016.
[11] J. Frierson and D. Si, “Who’s next: Evaluating attrition with machine learning algorithms and survival analysis,”
International Conference on Big Data, pp. 251–259, 2018.
[12] S. V. . V. R. Nagadevara, V., “Establishing a link between employee turnover and withdrawal behaviours:
Application of data mining techniques,” Research and
Practice in Human Resource Management, vol. 16, no. 2, pp. 81–99, 2008.
[13] J. Shlens, “A tutorial on principal component analysis,”
Systems Neurobiology Laboratory, Salk Institute for Biological Studies, 2005.
[14] N. Bennett et al., “A firm-level analysis of employee
attrition,”Group & Organization Management, vol. 18,
no. 4, pp. 1–19, 1993.
[15] V. Kumar and A. Pansari, “Measuring the benefits of
employee engagement,”MITSloan Management Review,
vol. 56, no. 4, pp. 67–72, 2015.
[16] A. Mitra et al., “A meta-analytic review of the
relationship between absence and turnover,”Journal of