6000 J Street, Tahoe Hall 3063 • Sacramento, CA 95819-6081 • T (916) 278-3888 • F (916) 278-3907 • www.csus.edu/ihelp
State Strategies to Preserve Higher-Cost Career Education
Programs in Community and Technical Colleges
WORKFORCE INVESTMENTS:
institute for higher education leadership & policy
Institute for Higher Education Leadership & Policy
N A N C Y S H U L O C K
J O D I L E W I S
Executive Summary
The Challenge of Financing High-Cost
Career and Technical Education Programs
In today’s highly-skilled economy, rewarding career pathways are available to those who acquire technical skills by enrolling in certificate and associate degree programs in a community or technical college. Such programs are often more costly to offer than liberal arts and sciences programs that prepare students to transfer to four-year institutions to pursue bachelor’s degrees, due to the need for smaller class sizes and specialized equipment and facilities. many of the higher-cost career and technical education (CTE) programs are in fields and industry sectors that are important to economic growth in most states and regions, such as nursing, allied health, various engineering technologies, and alternative energy. Consequently, it can be challenging for colleges, and the states that fund them, to maintain these programs. When hard fiscal decisions result in diminished offerings of programs that are valuable to students and communities, no one is well-served. The California Community Colleges (CCC) are facing this problem now, particularly in the aftermath of several years of budget-cutting during the recession. College officials have had to stretch fewer dollars across their program offerings in order to try to meet enrollment targets. Since colleges receive one set dollar amount per full-time-equivalent student (FTES), there is a fiscal disincentive to maintain high-cost programs. There is much anecdotal evidence, and some empirical evidence, that CTE offerings have been disproportionately reduced in recent years. This is troubling to those who recognize the value of technical education to students, to regions, and to the California economy. This policy brief reports findings of a 20-state study of strategies that may help colleges provide students with access to valuable workforce-oriented programs despite some higher costs. It is intended to help education leaders and policymakers in California continue to work toward realizing the vast potential of the CTE mission of the college system to contribute to student success.
The States
We studied policies and practices in place in 20 states (see map in Figure 5). The selected states encompass
a wide variety of size, demographics, postsecondary governance structures, and finance policies. our research included interviews with top state and system postsecondary finance and academic officials, as well as reviews of websites and official documents. We believe there is much to learn from states large and small that could be adapted to California’s circumstances. most states share with California the problem of shortages of skilled workers, growing diversification of community college student populations, and the college and career readiness challenges that accompany diversification. And most states appear to have given considerable thought to how finance mechanisms can help preserve valuable CTE/workforce programs for students even when they entail higher costs.
Findings
CTE/Workforce education is a celebrated mission. A
general theme that emerged from our research is that CTE/workforce education is a major priority. A significant portion of two-year college degrees are awarded in CTE disciplines in most of the 20 states, and the CTE/ workforce mission enjoys a high stature – on a par with or even above that of the liberal arts/transfer mission, according to many interviewees. The terms “technical education” and “technical college” are commonly used. officials in only a few of the 20 states indicated that maintaining funding for CTE/workforce programs has been more difficult than maintaining funding for programs in general, perhaps reflecting the finance strategies that are in place in many states.
Five strategies used to preserve high-cost programs.
Figure E-1 displays the five strategies that we found to be used by a majority of the 20 states that may help preserve higher-cost CTE/workforce programs. The figure contrasts those strategies with California’s policies. 1. Eleven states have postsecondary governance
structures that include colleges or systems designed to focus on technical education. While institutional governance is not an explicit finance strategy, this feature of state postsecondary governance has implications for finance by virtue of singling out the technical mission for attention and perhaps more direct access to policymakers.
WorkForCE InvESTmEnTS: STATE STrATEgIES To PrESErvE HIgHEr-CoST CArEEr EduCATIon ProgrAmS In CommunIT y And TECHnICAL CoLLEgES | I I
2. Thirteen states have some form of differential funding, whereby state funding formulas take program costs into account in calculating allocations. Among the states with differential funding, it is common for higher-cost programs to be funded at more than twice the rate of lower-cost programs. under these formulas, a college with an above average share of high-cost programs would receive more funding per student than a college with an average program mix. 3. Performance funding incorporates incentives for
student progress and success into state funding models. While not explicitly aimed to preserve high-cost programs, it can have that effect. If completions are equally rewarded across disciplines, higher-cost programs are not disadvantaged as they are with enrollment-based funding. Additionally, states have adopted metrics that recognize individual college missions, which can include job placement, wage gains, and production of degrees in high-need fields. 4. Eleven of the 20 states have authorized colleges
to charge differing amounts of tuition for different programs. Some colleges use this authority very selectively for a few programs – usually including health-related programs – and others have different tuition rates for nearly every program.
5. All but three of the 20 states assess course fees on an individual course basis to help defray costs such as labs, specialized equipment, and supplies. Such fees are assessed by California’s colleges as well, but are strictly limited by law to items that have lasting value to students beyond the duration of the course. We learned of no such restrictions in other states.
Implications for California
under the California master Plan for Higher Education, the CCC system was assigned a huge role in providing academic transfer programs. In the context of such an historic role in transfer education, the CTE/workforce mission has struggled to attain the level of attention, support, and respect that is directed to the transfer mission. Today, lawmakers and educators are well aware of the importance of the CTE/workforce mission to the state’s economy, and the Chancellor’s office is leading efforts to strengthen CTE offerings to meet the dynamic needs of regional economies.
Acknowledgements
We thank all of the officials in the 20 states we studied for their time and helpful information.
yet the state’s policies, and we believe, prevailing
educational values, are lagging the rhetoric about the value of CTE to current and prospective students.
Finance policy is powerful because it expresses values and priorities and creates incentives for institutional actions. California’s prevailing policies express strongly-held values of access, equity, and quality in serving students. We believe that there is much in the rich array of strategies in place across the states in our study that could help preserve high-cost CTE programs in ways that honor these values. Each of the five strategies has evolved differently in each state, providing a wide set of options to explore for applicability to California. But perhaps the most useful lesson comes from how other states value and communicate about CTE/ workforce education. Alongside efforts in California to improve community college transfer success, it should be possible to change the way we communicate to students and families about the value of CTE/workforce programs to students’ short- and long-term career goals.
Figure E-1
Strategies that may Preserve CTE/Workforce Programs
Strategy of States Number
(out of 20) California Approach Separate technical
institutions/system 11
All colleges have comprehensive mission differential funding
based on costs 13
Constant funding rate regardless of program Performance- or outcomes-based funding 14 Enrollment-based funding differential tuition (either for whole system or individual college discretion)
11 Same tuition for all programs
differential course
fees 17
Course materials fees limited by statute
The Issue
Public two-year colleges are addressing a vital and growing national priority to help adults of all ages earn credentials of value for workforce entry and advancement. Today’s economy requires postsecondary training for a larger share of jobs, with many rewarding career pathways available to those with technical skills earned in community college certificate and associate degree programs. yet many of these programs, while of considerable value to students, employers, and regional economies, are costly for colleges to support. This policy brief reports findings of our research into finance strategies used in other states that may help colleges provide students with access to valuable workforce-oriented programs despite some higher costs. It is intended to inform education leaders and policymakers in California as they address the challenge of financing career and technical education (CTE) offerings in the California Community Colleges (CCC).
Figure 1 shows cost differences in some instructional programs commonly offered in community colleges. In this brief, we describe five strategies used in other states to address cost differences such as those shown below, focus on three states that employ most of the strategies, and consider the implications that other states’ practices may have for California.
The California Context
over the last two years the Institute for Higher Education Leadership & Policy (IHELP) released a four-part report series, Career Opportunities,1 assessing the career
technical education mission of the CCC and offering suggestions for changes to state and system policies that would provide better support for this critical mission area. one prominent finding was the need for policies that would improve the alignment of program offerings with the needs of regional economies. The CCC, through the Doing What Matters for Jobs and the Economy
initiative,2 is moving aggressively to set regional priorities
and reallocate resources accordingly. But ever-present fiscal constraints, made worse by the great recession, have made it difficult for California’s community colleges to support high-cost programs while balancing budgets and meeting enrollment targets.
Community colleges in California are funded at a constant rate per full-time-equivalent student (FTES) and are accountable for meeting enrollment targets within their allocations. That creates a fiscal disincentive to support high-cost programs because the same dollar allocation stretches across more FTES when used for lower-cost programs. not all CTE programs are high cost, and not all liberal arts/transfer programs are low cost, but due to class size constraints and the specialized lab and equipment
Financing High-Priority Workforce Education Programs –
a Challenge for California’s Community Colleges
Figure 1
Instructional Costs Per Student Credit Hour national Averages (2011-2012)
Figure 2
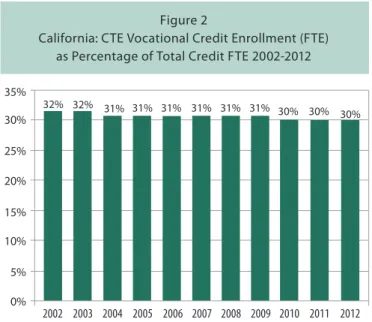
California: CTE vocational Credit Enrollment (FTE) as Percentage of Total Credit FTE 2002-2012
Humanities/Humanistic Studies $52
Biology, general $64
Engineering-related Technologies $73 Allied Health and medical Assisting Services $131 drafting/design Engineering Technologies/
Technicians $163
respiratory Care Therapy/Therapist $265
35% 30% 32% 32% 31% 31% 31% 31% 31% 31% 30% 30% 30% 25% 20% 15% 5% 10% 0% 2002 2003 2004 2005 2006 2007 2008 2009 2010 2011 2012
Source: CCC Chancellor’s office datamart, reflecting annual FTES in “vocational” credit courses
Source: national Community College Cost & Productivity Project, national Higher Education Benchmarking Institute
WorkForCE InvESTmEnTS: STATE STrATEgIES To PrESErvE HIgHEr-CoST CArEEr EduCATIon ProgrAmS In CommunIT y And TECHnICAL CoLLEgES | 2 4.5% 5.0% 4.0% 2.0% 3.0% 1.0% 0.0% 2002 2003 2004 2005 2006 2007 2008 2009 2010 2011 2012 Figure 3
Credit Enrollment (FTE) in Health Courses as Percentage of Total Credit FTE California Community Colleges, 2002-2012
Figure 4
Credit Enrollment (FTE) in Engineering and Industrial Technologies Courses as Percentage of Total Credit FTE
California Community Colleges, 2002-2012
needs of many CTE programs, cost considerations have surely played into decision making at the college level. Figures 2 to 4 show the trend, since 2002, in the share of credit enrollments (in FTES) that are classified as CTE by the CCC Chancellor’s office Taxonomy of Programs (ToP) coding system. Figure 2 shows the trend for all CTE programs – a slight decrease from 32% to 30%. While not a large drop, it has occurred during a period of increased attention to workforce development when we might have expected the share to increase.
Figures 3 and 4 look at two specific CTE program areas that are high-cost programs, as shown in Figure 1, so that we can see trends more directly reflective of cost constraints. Health courses saw an increase only up to the point of the recession in 2007 and then underwent a decline. This pattern, at a time when allied health is a strongly growing sector, suggests that colleges may be struggling to cover the costs of these programs. Figure 4 shows a steadier decline in another high-cost program area – engineering and industrial technologies, another sign that costs may be impeding program offerings in priority areas.
Scope of Study and Research Methods
The funding of workforce-related postsecondary
programs in our nation’s colleges is a complex topic.
3.9% 4.2% 4.0% 4.3% 4.5% 4.5% 4.4% 4.2% 4.0% 4.2% 4.1% 5.0% 4.0% 3.0% 2.0% 1.0% 0.0% 2002 2003 2004 2005 2006 2007 2008 2009 2010 2011 2012
Source: CCC Chancellor’s office datamart, reflecting annual FTES in courses with a two-digit ToP code of “12”
Source: CCC Chancellor’s office datamart, reflecting annual FTES in courses with a two-digit ToP code of “09”
States have evolved a variety of institutional structures and funding mechanisms that involve an array of federal, state, local, private, and nonprofit entities and funding sources. We have limited the scope of this study in two ways in order to focus on issues most likely to be applicable to CCC finance policy.
We limited our study to states' general fund
appropriations, examining how such funds are used to support workforce, or CTE, programs offered by their public postsecondary institutions (credit instruction only). We included policies regarding the collection of tuition and fees from students enrolled in those institutions because those revenues affect the allocation of state general funds.
We further limited our research to institutions and systems that are part of a state’s postsecondary sector. many states offer CTE to adults through secondary technical schools, including credit instruction leading to workforce credentials. We excluded these kinds of schools from our study because we are focused on state postsecondary finance, and most secondary technical schools are funded through k-12 finance mechanisms. nevertheless, k-12-funded CTE can be an important part of a state’s effort to help students earn postsecondary credentials. For example, Florida has a particularly
4.4% 4.3%
Financing High-Priority Workforce Education Programs –
a Challenge for California’s Community Colleges
robust set of technical schools within its k-12 system that function in close cooperation with community colleges because of the state’s unique k-20 governance structure.
As some states use the term “CTE” and others use “workforce,” we will use the combined term “CTE/ workforce” for the remainder of this report to refer to community college programs that prepare students for entry into the workforce at the certificate or associate degree level. We use the term “liberal arts/transfer” to refer to community college programs that prepare students to transfer to four-year institutions to pursue bachelor’s degrees in fields where associate degrees are not sufficient entry-level career preparation.
In choosing states for the study, we drew on expert advice as well as our own knowledge of two-year state systems. We included states from various regions of the country, of various sizes, and spanning a range of circumstances in higher education – governance structures, size and
mission of the two-year sector, funding approaches, demographics, and industry base. Figure 5 shows the 20 states we studied. We included large, diverse states (Texas, New York, and Florida), neighboring states to California (Oregon, Washington, Nevada, Arizona), and several states in the Midwest and South that have been very proactive in addressing community college student success. We believe that lessons can be learned from small states as well as large ones, particularly since most states are experiencing shortages of skilled workers, growing diversification of community college student populations, and the college and career readiness challenges that accompany diversification.
A wide variety of governance structures prevail across the 20 states, including unified systems without local governing boards (e.g., Virginia, Indiana), local governance without a central system (e.g. Nebraska, Arizona), local boards under a state system, (e.g., Washington, Kentucky), one governing board over two-year and four-year
Figure 5 States Studied OR WA NV AZ TX OK KS NE WI IL IN OH NY VA KY TN GA FL AR LA
WorkForCE InvESTmEnTS: STATE STrATEgIES To PrESErvE HIgHEr-CoST CArEEr EduCATIon ProgrAmS In CommunIT y And TECHnICAL CoLLEgES | 4
the websites of numerous colleges and technical centers. Funding arrangements are evolving in many states, so we caution that there may be some changes to the state policies as they were described to us during our interviews, although we asked respondents to review drafts to check for accuracy.
The purpose of this study was to learn about alternative financing approaches in other states in order to inform efforts underway to ensure robust CTE offerings for students in California's community colleges. Its scope does not allow for any in-depth analysis of the impact of finance strategies on the sustainability of high-cost programs. We are uncertain whether such analyses would be revealing or even worth undertaking because of the complications inherent in comparing states on both the strategies and their potential outcomes. With regard to strategies, for example, no two states’ finance approaches are the same and they have been in place for varying amounts of time. With regard to outcomes, we could not identify measures that would provide for a fair comparison across states, given variations in labor markets, economic cycles, state budget priorities, demographics, program quality, and available data.
The one outcome measure for which ostensibly comparable data are available is associate degree production by discipline.3 We did some exploratory
analysis to compare states on (1) the percent of a state’s associate degrees that were awarded in CTE fields, and (2) the percent of all CTE associate degrees that were awarded in health fields (which are mostly high-cost). But policy differences across states on the award of associate degrees for transfer students limit the validity of even these comparisons for assessing any impact of finance strategies, as do the age profiles of states as they influence the demand for health professionals. We concluded that we could not provide any valid data on the relationship between finance strategies and the vitality of CTE/ workforce offerings. Individual case studies of states before and after adoption of new finance strategies would probably stand the best chance of yielding information on the impact of finance strategies. Therefore, we focus our findings on how states are using finance policy to preserve high-cost CTE/workforce programs, and what lessons may be applicable to California.
Research Methods:
n Select states (20)n Conduct semi-structured interviews with finance
and other state and system officials
n Review details on finance policies noted by
interviewees
n Review college websites n Categorize financing strategies
n Examine IPEDS data on trends in award of
associate degrees
n Review findings for applicability to California
institutions (e.g., Arkansas, Tennessee), separate systems for technical colleges (e.g., Texas, Wisconsin), and several other models. We believe that this set of states provides a comprehensive survey of the range of finance approaches that may help states preserve high-cost CTE programs in areas of value to regional economies, and therefore of potential value to students.
Once we selected the states, we consulted the 2012
State Higher Education Finance report, published by State Higher Education Executive Officers (SHEEO), to obtain an initial list of contacts for community/ technical college finance officials in various states. We contacted those listed and either confirmed an interview with them or were redirected to other state or system officials. We spoke with 36 individuals across the 20 states – typically vice chancellors or directors of budget/ planning/business in system or statewide offices. Our semi-structured interviews included questions about governance structure, the priority of the CTE/workforce mission within the two-year sector, the severity of the funding problem, state funding models, tuition and fee policies, and other strategies used to support CTE/workforce programs. We asked for and received background materials and documents from most states with information on funding models, tuition levels, and other elements of their finance approaches. We explored
Several themes emerged from the interviews that warrant mention before proceeding to describe the specific financing strategies in use across the sample of states. First, it was clear that in nearly every state, considerable attention has been given to the issue of program cost as it affects the ability of community and technical colleges to offer high-cost programs if those programs are judged to be of value to students and communities. Most of the states have evolved multiple approaches to recognizing cost differentials in their financing strategies.
Second, the CTE/workforce mission is a much bigger part of the two-year postsecondary sector mission in most states than it is in California, at least as measured by the share of degrees awarded that are in CTE fields (see Figure 6). Certainly, CTE/workforce education involves much more than associate degree programs and liberal arts/transfer education may or may not involve the award of an associate degree to transfer students. Nevertheless, Figure 6 shows that other states have more of their two-year sector activity devoted to degree programs in CTE/workforce disciplines. The figure shows this percentage for the 20 states included in this study and for
California for the 2004-05 and 2010-11 academic years. In 2004-05 California’s CTE portion of degrees was below all states except Florida. In the more recent data, California has moved above Arizona but remains far below most of the other states. This reflects the historic importance of the community college transfer mission under the 1960 Master Plan for Higher Education, which provides that only the top one-third of high school graduates, statewide, are eligible for admission to a public university as freshmen.
Third, and admittedly a subjective observation based on the interviews, CTE seems to enjoy a higher relative status in other states than in California. In our Career Opportunities report series we concluded that CTE is often marginalized from the academic core of the community college system and does not receive the level of attention, support, and even respect accorded to the liberal arts/transfer mission. By contrast, we were struck in our interviews by the high regard for CTE/workforce programs and the emphasis those programs are given by systems and lawmakers. Here are a few specific examples:
Findings: CTE/Workforce Education is a
Celebrated Mission
Figure 6
CTE degrees as Percent of Total Associate degrees Awarded, 2004-05 and 2010-11
90%
Wisconsin Indiana O hio
Louisiana Nebrask a
GeorgiaOklahoma New York NevadaTennessee Kentucky Virginia Kansas Texas Washingt
on
Arkansas Oregon IllinoisCalifornia Arizona Florida 80% 70% 2004-2005 2010-2011 60% 50% 40% 30% 20% 10% 0%
Source: national Center for Education Statistics Integrated Postsecondary Education data System (IPEdS), reflecting degrees based on 25 two-digit Classification of Instructional Programs (CIP) codes considered CTE
WorkForCE InvESTmEnTS: STATE STrATEgIES To PrESErvE HIgHEr-CoST CArEEr EduCATIon ProgrAmS In CommunIT y And TECHnICAL CoLLEgES | 6
n Washington uses the term “professional/
technical” for its CTE/workforce portfolio in order to differentiate it from K-12 CTE programs and to emphasize the professional career pathways available to students. The State Board for Community and Technical Colleges decided years ago to build its reputation on its “professional/technical” mission because it viewed that mission as its competitive advantage over the four-year sector.4
n In Illinois, high school students are advised of both
CTE and transfer program options in community college, with at least equal emphasis on CTE, according to our interviewee.
n Indiana uses the term “CTE” only for the secondary
schools. Postsecondary programs are referred to only by their discipline names and are under the academic purview of the provost, along with all other academic programs, to signal their inclusion in the core of the institution.
n As an indication of the value placed on vocational
degrees, college faculty and staff in Kentucky
reportedly encourage students who are enrolled in workforce programs to take general education courses as they pursue certificates so they can earn associate degrees. Likewise, employers are encouraged to allow students to complete their vocational associate degrees even once they have earned entry-level skills. Two-year colleges are subject to an accountability metric called “workforce matriculation” that reports the numbers of students who transition from noncredit job training into credential programs – another signal of the priority placed on associate degrees.
n In Louisiana, where a large number of institutions
were merged into a new community and technical college system in 1998, the former technical schools were “adamant” (according to the interviewee) about retaining the term “technical” in their names, resulting in a set of “technical community colleges” within the system.
n In many of the interviews we were told that the
transfer of credits from technical programs to four-year institutions was reasonably seamless, even from institutions designated as technical colleges or institutes.
n Interviewees in several states reported that
their governors are highly focused on workforce education and, therefore, on providing appropriate support to the two-year institutions that provide it. As an example, CTE programs in Kansas received a 14% budget increase recently in a year in which the entire postsecondary budget was reduced over prior-year levels.
Fourth, we asked interviewees whether it has been a problem to maintain CTE/workforce programs that are of higher-than-average cost. Our assumption was that, if states have adopted finance mechanisms that protect high-cost programs, the problem would not be as acute as it appears to be in California. A minority of respondents reported that sustaining support for CTE programs was indeed a particularly difficult problem. By contrast, a slight majority said they had not heard that sustaining CTE/workforce programs is a problem. Others reported problems maintaining all programs, with no worse a problem for workforce/CTE. These observations from high-level finance and academic administrative officials, while just one set of possible respondents, do suggest that some other states have managed to place CTE/ workforce programs on at least an equal footing as other programs in terms of financial support and stature.
Findings: Five Strategies Used to Preserve
Higher-Cost Programs
We identified five strategies that states are using, in various combination, that may help preserve
postsecondary high-cost CTE/workforce programs. None of these strategies are in use for the CCC system. Figure 7 lists the strategies, the number of states (of the 20 we studied) where these strategies have been adopted, and the corresponding California policy. We discuss each in turn and include some specific state examples.
Technical Systems and/or Institutions
In 11 of the 20 states we studied, there are two-year postsecondary institutions that are designated as "technical" – in contrast to, and in addition to,
community colleges that are primarily oriented to liberal arts/transfer programs or to a comprehensive mission. Some of the “technical” colleges offer liberal arts/transfer programs as well, but have somewhat more emphasis on CTE/workforce programs than other two-year colleges in their states; some offer only CTE/workforce degrees and certificates; some offer only certificates. We are not including technical schools that are part of secondary systems, even if they serve adults, as our focus is on postsecondary institutions. While institutional governance is not an explicit finance strategy, we believe that this feature of state postsecondary governance has implications for finance by virtue of singling out the technical mission for attention and perhaps more direct access to policymakers. We identified three governance models for those states with separate technical
institutions, described below with brief descriptions of each state’s model.
“Community and Technical” college systems. Three states have a system of “community and technical colleges” in which the individual colleges may have more or less of their offerings in the technical area, but the governing boards oversee both the comprehensive and the technical colleges.
n The Kentucky Community and Technical College
System consists of four community colleges and 12 community and technical colleges. It was created by statute in 1997 to unify the state’s community colleges and its technical colleges under the governance of a single board of regents.
n The Louisiana Community and Technical College
System was formed in 1999 to bring together a number of institutions into a 14-college system with three types of colleges: seven community colleges; four technical community colleges; and three technical colleges. The different designations roughly reflect the balance of the liberal arts/ transfer mission with the CTE/workforce mission
Figure 7
Strategies that may Preserve CTE/Workforce Programs
Strategy of States Number
(out of 20) California Approach Separate technical
institutions/system* 11
All colleges have comprehensive mission differential funding
based on costs 13
Constant funding rate regardless of program Performance- or outcomes-based funding** 14 Enrollment-based funding; no performance- or outcomes-based funding differential tuition (either for whole system or individual college discretion)***
11 Same tuition for all programs
differential course
fees 17
Course materials fees limited by statute to items of continuing value to students outside the classroom setting
* Includes postsecondary technical colleges or institutions that are part of comprehensive community college systems, part of separate technical systems, or separate institutions not part of a system, and that receive state funding. Their offerings may be limited to postsecondary vocational certificates, or include associate degrees in vocational programs. We also include colleges with comprehensive missions that are called “technical” because of a stronger historical focus on technical education. ** Includes states where performance funding has been officially
adopted, even if not yet affecting allocations. Three additional states have plans underway for some form of performance funding. *** "differential tuition," whether called “tuition” or “fees” by the
state, is a charge that is not attached to a particular course. It can be attached to a general program, and can be applied annually, per credit hour, or per semester/quarter.
WorkForCE InvESTmEnTS: STATE STrATEgIES To PrESErvE HIgHEr-CoST CArEEr EduCATIon ProgrAmS In CommunIT y And TECHnICAL CoLLEgES | 8
as well as the history of the individual institutions. It is governed by the Board of Supervisors of the Community and Technical Colleges.
n In Washington, 34 community and technical
colleges have local governing boards, appointed by the Governor, and are organized under a State Board for Community and Technical Colleges (SBCTC). The nine-member state board, also appointed by the Governor, is responsible for all matters related to instruction and students services at the colleges, as well as financial matters such as requesting and allocating state appropriations for the colleges.
Technical college systems. Four states have technical college systems with their own governing bodies, independent of their state’s community colleges.
n Georgia has the Technical College System of Georgia,
with 24 technical colleges and one technical division at a state university, governed by the State Board of Technical and Adult Education. This system is separate from the community colleges that are part of the University System of Georgia under the Board of Regents, which are primarily transfer institutions with few technical offerings.
n Oklahoma’s 29 postsecondary career technology
centers are governed by the Career Technology State Board and are completely separate from Oklahoma’s two- and four-year postsecondary institutions. These centers, which offer certificates but not associate degrees, receive most of their funding from local tax revenue but do receive some state support. The state’s Board of Regents oversees the “Cooperative Alliance Program,” which coordinates pathways and allows transfer of credits from these career tech centers to community colleges or four-year institutions.
n Texas has 50 public community college districts
with local governing boards and no systemwide governance. A separate set of institutions, the Texas State Technical College System, consists of four technical colleges and is governed by its own board of regents. These technical colleges offer certificates and associate degrees in a wide range of career fields.
n Wisconsin has a separate Wisconsin Technical
College System with 16 districts. Five of its colleges offer collegiate transfer and liberal arts programs but such programs can be no more than 25% of institutional program offerings. In a separate system – the University of Wisconsin System – are 13 two-year colleges that offer liberal arts/transfer programs.
Technical institutions – not organized in systems. Four states have postsecondary technical institutions that are not part of a community and technical college system or a separate technical system, but have either their own local governing board or are governed along with other postsecondary institutions.
n Arkansas has 22 two-year colleges, two of which
are designated “technical” institutions. Eight of the colleges are part of one of the two university systems (University of Arkansas, Arkansas State University). All colleges have their own local governing boards, and they are all comprehensive in their program offerings.
n The Kansas Board of Regents is the governing board of
the state's six public universities and the coordinating board for all public two-year and four-year institutions, including 19 community colleges and six technical colleges. In 2007 the Kansas legislature created the Postsecondary Technical Education Authority. The Authority operates under the auspices of the Board of Regents and makes recommendations to the Regents regarding planning, coordination, and enhancements for the postsecondary technical college system.
n The Ohio Board of Regents has statutory authority for
planning and coordination of senior, community, and technical institutions in the state. Ohio’s 23 community colleges are governed by their own local boards. Three of them are designated “technical” colleges owing to their histories, but have program mixes closely resembling the other community colleges. More than 50 Ohio Technical Centers (formerly Adult Workforce Education Centers) are now also part of the postsecondary system, having moved under the purview of the Ohio Board of Regents from the Department of Education in the last few years. These centers, which offer certificates but not degrees, have articulated pathways into Associate and Bachelor’s degree programs in Ohio colleges.
Findings: Five Strategies Used to Preserve
Higher-Cost Programs
n The Tennessee Board of Regents of the State
University and Community College System exercises statutory responsibility for six senior institutions, 13 community colleges, and the 26 Tennessee Colleges of Applied Technology (TCAT). The TCATs, known also as “technology centers,” offer diplomas and certificates and are funded by the state under a different method than the 13 community colleges.
Differential Funding in State Funding
Formulas for Colleges
Thirteen of the 20 states have some form of differential funding, whereby state funding formulas take differential program costs into account in calculating need or allocations for institutions. Such formulas are often not fully funded because of limited state funds or provisions for equalizing funding across colleges or capping allocation changes between years. Even where the state contributes less than the full computed "need," however, budget allocations to colleges are affected by the mix of programs offered and the cost differences among them. In every state with differential funding, the formula only affects the allocation to the college system or to the college but does not determine how the funds, once received by a college, are allocated to the individual academic programs.
Differentiating by discipline. Each state’s differential funding approach is unique but the majority of states group academic programs into categories, by cost, usually with reference to Classification of Instructional Program (CIP) codes. For those states, the formulas reflect choices about the number of different cost categories to use and the cost factor to apply to each category. There is a wide variation in the number of cost categories used, as well as in the difference between the highest- and lowest-funded category, as shown in Figure 8. States with only a few categories generally group most technical courses into just one or two categories. The two states with a large number of categories assign costs to nearly every discipline rather than creating groups of disciplines. A few of the states take cost into account by means other than formulas with specified cost categories. For example, Wisconsin's
technical colleges are funded primarily from non-state funds with the state portion aimed to supplement and equalize local funding. A portion of the state allocation is
derived as a percent of college costs. Therefore, colleges with more costly programs receive more state funds.
Washington uses a base-plus funding model, but the base reflects allocations from previous years in which state allocations were in part based on program cost.
Assigning costs to discipline categories. States have developed different means to acquire cost data on which to base their differential funding formulas. Some states rely on cost studies that have been done elsewhere.5
Others collect actual expenditure data from their own colleges. Virginia uses both internal and external data, drawing on student/faculty ratio guidelines used in other states, recommendations from its own colleges and universities, and accreditation standards on staffing requirements. However the cost information is obtained, it is then used to various degrees of specificity to make appropriate accommodations for program cost. An
Figure 8
Structure of differential Funding models*
State Number of Categories Lowest Funding RateRatio of Highest/
Arkansas 4 1.8 georgia 5 1.7 Illinois 6 2.8 kansas 7 2.7 kentucky 52 4.4 nebraska 3 2.0 nevada 3 2.0 Texas 26 2.6** virginia 6 2.4
* It is not possible to describe every state's approach to differential funding in this way due to the unique structures of some states’ funding models. Even those in this figure have components of the funding model that cannot be reduced to a ratio.
** ratio excludes one very high cost program (Career Pilot), which is funded at nearly twice the rate of the next highest program.
WorkForCE InvESTmEnTS: STATE STrATEgIES To PrESErvE HIgHEr-CoST CArEEr EduCATIon ProgrAmS In CommunIT y And TECHnICAL CoLLEgES | 10 Figure 9
using Weights to Adjust for Program Costs
Weights Applied
to FTES Nebraska Nevada
1.0 Academic Liberal arts, math,
science, language 1.5 Technical without
expensive equipment
visual and performing arts 2.0 Technical with expensive equipment Health, trades/tech engineering Figure 10
using Class Size Standards to Adjust for Program Costs (Arkansas)
general education 22 students
Technical education 16 students
remedial/developmental 16 students Allied health - health professions 12 students
approach used by some states is to assign weights to the budgeted enrollment for each program area, usually pegged to a weight of 1.0 for general education courses, with higher weights for programs that are more costly.
Nebraska and Nevada use this approach, shown in Figure 9. A second approach computes an expected rate of student contact hours per faculty in a set of programs. This is, in effect, a student-faculty ratio and captures the different expectations for the class sizes that are appropriate for different disciplines. Arkansas
uses this approach, shown in Figure 10. Other states that use a version of differential reimbursement by credit hour for different disciplines include Illinois, Kentucky,
Texas, and Virginia.
Incorporating cost differentials in final allocations.
The differential costs, by discipline, are usually just one piece of computed program "need" – the "direct instructional" or "faculty salary" piece. The other
components of a state funding formula (e.g., for indirect
costs, equipment, facilities) may or may not take cost into account. One way that does account for cost differences in the non-instructional components of the formula is to apply a percentage to the instructional cost component for indirect and support costs. Arkansas, for example, calculates academic support at 60% of direct instruction, providing more support dollars for programs with higher instruction costs. Once all costs are computed for all disciplines, states take various approaches to using that information to determine actual budget allocations. Some states subtract local tax revenues and/or revenue from student tuition from the computed need and allocate state funds for the balance – as far as the state funding will go toward meeting the balance. Some states apply the differential funding formula only to new funds, while carrying forward the prior year’s base for each institution. Several states have devised means by which state funds are used to bring greater parity across institutional funding levels, such that the cost-based formula becomes only one benchmark for determining annual allocations.
Performance Funding
Fourteen of the 20 states have adopted some form of performance funding for their two-year colleges affecting various portions of the overall budget. In some cases the funding models have been officially approved but have not yet begun to influence budget allocations to colleges. Performance funding is under active discussion in another three of the states. Interest in basing state allocations for postsecondary education in part on outcomes has grown in recent years, as new approaches have been devised to improve on some of the ill-advised approaches in the past. Among the new approaches are metrics intended to better reflect college missions and to preserve access for disadvantaged populations whose measured outcomes have historically been below those of other student populations.6 Despite these new approaches, performance
funding remains a controversial and unsettled strategy, with states taking varying approaches to its development and implementation. Our purpose in discussing performance funding here is not to explore it in any depth, but to explain why some states view it as one strategy, among others, to preserve high-cost CTE/workforce programs.
Findings: Five Strategies Used to Preserve
Higher-Cost Programs
Completion – a level playing field. Despite the variation in approach across states, every state's performance funding system includes a measure of certificate and degree completion. Compared to straight enrollment-based funding, this approach creates a more level playing field for high-cost programs. Under enrollment-based funding with no cost differentials, a low-cost program is advantaged compared to a high-cost program because the same per-student dollar allocation will cover a greater portion of the program's cost. But a performance funding system that counts completions accords no such advantage to a low-cost program. In fact, depending on the specifications of the performance component, high-cost CTE/workforce programs could be advantaged because they may have more opportunities to register completions with the award of certificates and associate degrees. Furthermore, CTE/ workforce programs with above-average completion rates would fare better than other programs.
Aligning funding with labor market needs. Another strategy that some states use to preserve and encourage CTE/workforce programs that may cost more than other programs is to include performance factors that relate to meeting labor market needs. Some do this by including extra weights for completions in fields designated as "high-need." Some include measures of job placement and wages, although the collection of accurate data has slowed some efforts to track labor market outcomes. In Arkansas, for example, certificate and degree completion are among the mandatory measures, and among allowable optional measures are the number of credentials awarded in Science, Technology, Engineering, and Mathematics (STEM) fields and other high-demand disciplines, and the number of credential completers that obtain employment. Similarly, Nevada allows colleges to choose measures for outcomes in specific workforce areas that conform to their program priorities. Louisiana
includes measures of job placement and wages but has not yet incorporated a "pre/post" measure that would assess changes in employment status or in wages after program completion. Wisconsin's newly developed performance funding system has a number of workforce-oriented metrics including: (a) placement rate of students in jobs related to students’ programs of study; (b) number
of degrees and certificates awarded in fields determined to be high-demand by the system's governing board and the state Department of Workforce Development; (c) number of programs or courses with industry-validated curriculum; (d) the transition of adult students from basic education to skills training; and (e) workforce training provided to businesses and individuals. States have not made as much progress in adopting rigorous measures of wage gains, by program, because of the challenges of collecting the data.
Strategies tailored for workforce/CTE. Some states apply performance funding strategies differently for technical colleges or programs. Florida has two strands of performance funding for its community colleges, one of which is targeted just to incentivize the award of industry certifications in approved fields. Louisiana
has different metrics for its technical colleges, where graduation rates (used for funding the community colleges) have not been a matter of concern. Instead, the technical colleges are accountable for counts of certificates and degrees and the employment outcomes noted above. NewYork is just beginning a very small performance funding plan for both the City University of New York (CUNY) and the State University of New York (SUNY) that affects only occupational programs.
Tennessee uses performance funding to fund its community colleges but not its technology centers because the need to incentivize workforce-related outcomes is not the same for institutions whose sole purpose is to provide occupational training. One metric used for its community colleges is "job placement," defined as the number of graduates who are "eligible" for job placement who are then placed in a job.
Efforts to preserve access. It is worth noting, even though this is not a detailed discussion of performance funding, that most of the states we studied include metrics to attempt to preserve access for disadvantaged students. Examples of such metrics include the number of credentials awarded to underrepresented minorities, advancement along remedial and adult education milestones, and weighting factors for completions by Pell Grant-eligible students.
WorkForCE InvESTmEnTS: STATE STrATEgIES To PrESErvE HIgHEr-CoST CArEEr EduCATIon ProgrAmS In CommunIT y And TECHnICAL CoLLEgES | 12
Differential Tuition
Another strategy in use to preserve high-cost programs – this one used by 11 of the 20 states – is to authorize colleges to charge different rates of tuition for different programs. Not all colleges that have the authority have chosen to use it, no doubt out of fear that higher tuition rates might discourage students from enrolling in high-need programs. Those that have set differential rates of tuition do so selectively in high-cost programs where student demand and job prospects are deemed sufficient to support somewhat higher student tuition. States take different approaches to the use of differential tuition authority. The Texas legislature deregulated tuition in 2003 and gave community and technical colleges the authority to charge whatever they
want – in effect, whatever the market will bear. At the other extreme, Louisiana allows differential tuition only where the Board of Regents has approved a Center of Excellence, which requires contributions from private industry to support programs of demonstrated high need. The Nevada Board of Regents may approve requests by colleges to set higher rates, up to 50% above general tuition rates, and only in certain fields, mostly in the clinical sciences. As of the time of our interview, no Nevada colleges had yet implemented differential tuition charges. In Ohio’s community colleges, tuition rates vary across colleges but not by program; however, the technical centers charge different tuitions for different programs. Figure 11 gives some examples of how individual colleges and college systems are using their authority to set differential rates of tuition.
Figure 11
Examples of differential Tuition, by Program
Number of Tiers/Rates Programs/Disciplines Tuition Rate Arizona – Pima
district 3
general (liberal arts) $65.50 per credit hour level A (e.g. aviation tech; respiratory tech) $85.50 per credit hour level B (e.g., nursing, radiologic tech) $91.50 per credit hour
Arizona – yavapai College
rates vary by program, for multiple programs
standard $70 per credit hour
laboratory courses $78 per credit hour
CTE $87 per credit hour
market rates (e.g., digital filmmaking, nursing, radiology)
range from $105 to $145 per credit hour
Illinois – Central College
rates vary by program, for multiple programs
standard $99 per credit hour
e.g., welding, auto body, electrical maintenance,
health $124 - $173.25 per credit hour
Indiana (all colleges) 2 general $116.15 per credit hour
nursing and dental hygiene additional $62.50 per semester new york – onondaga
Community College (Suny)
3
general $4,172 per year (full-time)
“specialized program fee” for seven programs additional $100 per semester
health program fee additional $500 per semester
ohio – mid-East Career and Technology Center
Each program has a separate tuition/fee total listed
practical nursing $10,214 for 42 week program
welding $9,280 for 38 week program
heating and air conditioning $6,032 for 41 week program Texas – Lone Star
College System
rates vary by program, for multiple programs
standard $88 per credit hour
e.g., agriculture, career pilot, construction trades, health occupations
additional per credit hour, from $3 to $12
Findings: Five Strategies Used to Preserve
Higher-Cost Programs
Course Fees
A final strategy involves the use of course fees to help offset the cost of certain programs and courses. We differentiate this strategy from that of differential tuition by the structure of the charges. Course fees are assessed to students for their enrollment in individual courses. Tuition is a charge for attending a college or, in some of the cases of differential tuition rates noted above, for enrolling in a particular program. Some institutions use the term “fee” and “tuition” interchangeably to refer to the broader charges that students pay to enroll in college. Here we use “fee” only with reference to charges assessed on a course-by-course basis.
Since course fees are assessed at the individual college level, we cannot report with certainty what the practices are across the 20 states. However, our interviews and related document review revealed three states where course fees may not be assessed at all. One of those states – Virginia – has tried to develop a tuition schedule that provides adequately for instructional costs without the need for individual course fees. The other 17 states appear to rely on course fees rather heavily, and differentially across courses, to help colleges defer the costs of instruction in courses that have laboratories or require specialized equipment and supplies. We did not learn of any statutory restrictions like those facing California’s community colleges, which are allowed to assess course fees only for items of durable use outside the classroom.7
Course fees are typically listed on a college’s website. There is no practical way to summarize the spectrum of charges, but we offer a few examples here from our review of college catalogs:
n As an interesting contrast to California’s limitation
to durable materials, Indiana’s Ivy Tech Community College (which is the only community college in the state but has multiple branches) charges fees only for “consumables” but may also require students to supply their own tools and specialized equipment for some courses. One set of course materials fees applies for all campuses. Examples include automotive (from $10 to $50), culinary ($42), and principles of advanced manufacturing ($300).
n In NewYork, one community college assesses fees
ranging from $10 to $270 for various laboratory courses, another has no course fees, and a third has a limit of $100 per course.
n Regulations in Oklahoma limit course fees to “direct
cost of service” but the fees are not limited to materials. As long as the department can show that the fees do not exceed the costs of service, they may be assessed and used for lab assistants, equipment, supplies, or other purposes related to the course. One college in Oklahoma has just submitted justification to increase the lab fee for a nursing course from $250 to $530.
n One Oregon college publishes the following about
course fee policy: “Certain courses may require a fee(s) in addition to tuition. Course-specific fees are published quarterly in the Schedule of Classes. The college periodically introduces new courses, programs, and/or fees on a pilot basis to meet the needs of the community. These fees may be administratively implemented as needed during the year.” Some of the course fees listed by that college include: diesel tech laboratory fee ($60 for each course); nursing clinical fee ($300 for each course with a clinical component); EMT fee ($160 each term); and welding fee ($150 lab fee).
Additional Strategies to Support CTE/
Workforce
We identified two other strategies that are not as easily described or counted as the five strategies described earlier. Therefore, we did not include them in Figure 7, where we summarized the number of states using each strategy.
Special budget allocations. State budgets for postsecondary education typically involve a line item containing the main portion of the appropriation to a college or a system of colleges and other, smaller line items by which the governor or legislators express priorities for particular kinds of expenditures. In the interviews, we heard of a number of these kinds of special line item allocations for purposes of supporting CTE/workforce education. Since these vary from year to year and state to state we provide some examples but do not offer any definitive statements about the prevalence of this strategy.
WorkForCE InvESTmEnTS: STATE STrATEgIES To PrESErvE HIgHEr-CoST CArEEr EduCATIon ProgrAmS In CommunIT y And TECHnICAL CoLLEgES | 14 n In Illinois, community colleges apply for state
grants, in response to criteria that target particular programmatic priorities, aimed at program improvement and innovation.
n Kentucky lawmakers have established a trust fund,
called “Kentucky Workforce Investment Network System” (KY WINS). A program of the Kentucky Community & Technical College System, it provides state funds to companies that are willing to invest in their employees through a structured training program. Funds are distributed on a project basis and require a company cash match of 35 percent.
n In NewYork, grants are made to campuses for
program development and to seed implementation for emerging, high-need programs intended to become self-sustaining. Additionally, special allocations are made to support community college workforce development programs, distributed to colleges on the basis of program mix and college needs.
n In Tennessee, the state funds equipment at the
technology centers annually through line item allocations.
n In Washington, when the legislature provides
funding for new enrollment in the community and technical college system, it has tended, in recent years, to be directed specifically to cost, high-demand programs, like nursing.
Concurrent/dual enrollment. The extent to which states, systems, and individual colleges offer opportunities for high school students to enroll in college CTE/workforce courses for credit varies greatly. Summarizing these policies is well outside the scope of this project, but we believe it is worth including as a strategy that can recruit students into CTE/workforce programs and help such programs become sustainable on an enrollment basis. We learned of policies in several states that provide incentives to high schools and community colleges to enroll high school students in college courses. The most common incentive is to provide reimbursement for both sets of institutions for concurrently enrolled students. Kansas
has a particularly robust approach to encouraging dual enrollment in CTE courses. High school students may enroll in CTE courses at no charge to the student and the state reimburses the college for 100% of the Board of Regents calculated cost. In addition, if a student earns an industry-recognized credential by the time they graduate from high school, the high school receives a $1,000 award from the state.
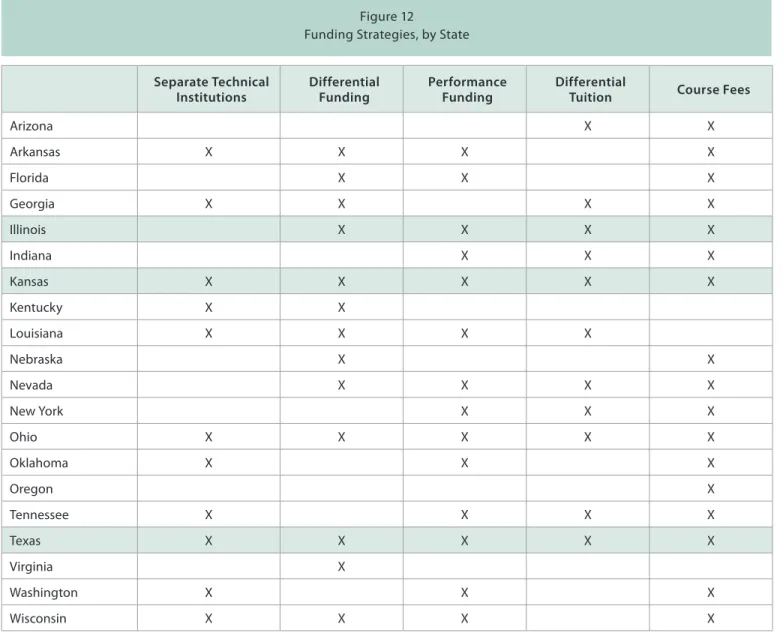
A Closer Look at Three States
We have identified five strategies in use across 20 states that may help preserve high-cost CTE/workforce programs. Figure 12 shows which of the strategies are used by each state. In the earlier sections we reviewed each strategy in turn, with examples from some states. In this section, we look at three states (highlighted in Figure 12) that we found to be among the more proactive states in taking steps to preserve high-cost CTE/workforce programs. We selected Kansas and Texas because they are two of the three states that use all five strategies. Texas, of course, is a large and highly diverse state like California. While both states have separate technical institutions, they provide a bit of a contrast because Texas has a separate system of technical colleges while the Kansas technical colleges are
not organized into a system. As a third state we selected Illinois, which is one of the larger states among the seven that have adopted four of the strategies. Illinois does not have separate technical institutions, making it an interesting contrast to both Kansas and Texas.
Kansas
Separate technical institutions. There are 19 community colleges and six technical colleges. Each has its own governing board but all are under the coordinating authority of the Kansas Board of Regents (BOR). The Kansas Technical Education Authority (TEA) was established by the Kansas Legislature in 2007. It
Figure 12
Funding Strategies, by State
Separate Technical
Institutions Differential Funding Performance Funding Differential Tuition Course Fees
Arizona X X Arkansas X X X X Florida X X X georgia X X X X Illinois X X X X Indiana X X X kansas X X X X X kentucky X X Louisiana X X X X nebraska X X nevada X X X X new york X X X ohio X X X X X oklahoma X X X oregon X Tennessee X X X X Texas X X X X X virginia X Washington X X X Wisconsin X X X X
WorkForCE InvESTmEnTS: STATE STrATEgIES To PrESErvE HIgHEr-CoST CArEEr EduCATIon ProgrAmS In CommunIT y And TECHnICAL CoLLEgES | 16
operates under the auspices of the BOR and makes recommendations to the BOR regarding coordination of, statewide planning for, and improvements to the technical college system. Its mission, as stated in TEA’s 2012-13 Strategic Priorities document, is to "drive the advancement of a robust technical education system to meet the needs of Kansas business and industry." The technical colleges are authorized only to offer the associate of applied science, whereas the community colleges offer academic associate degrees as well as applied degrees. Both offer certificates. The TEA has been granted authority to review and align programs with labor market needs. About 46% of all associate degrees awarded in 2010-11 (including applied degrees) across both sets of colleges were in vocational fields.
Differential funding. Both sets of institutions receive state funding using an enrollment-based formula that has seven tiers, or cost categories. All programs referred to as “academic” are funded at the lowest rate. The funding tiers do not take into account any factors of labor market need for programs but only program cost. The tiered cost structure is based on a national cost study done by Johnson County Community College in Kansas. The study began with a national grant and is now a self-sufficient program that serves postsecondary institutions in other states for a fee. Cost information for the study is regularly collected from throughout the nation. The seven tiers produce an "instructor rate" which is supplemented for high-cost programs by an "extraordinary cost rate" (low, moderate, or high) to cover specialized equipment, supplies, and materials. Funds are added for instructional support and institutional support at a constant rate for all programs. Once the program rate is used to compute the cost to serve students at each college, each college is assumed to raise approximately 20% of the total from tuition. Any local tax revenue is also backed out to determine the balance to be appropriated by the state.
Performance funding. In 1999 the Kansas Legislature established performance-based funding for technical colleges, community colleges, and state universities. Each institution’s receipt of new state funds is contingent upon meeting goals outlined in its Performance Agreement.8
Institutions submit a Performance Agreement for Board
approval once every three years and performance is evaluated annually. Each community and technical college chooses indicators, from a specified list, to include in its Performance Agreement. Indicators must address two goals – increasing educational attainment and meeting the needs of the Kansas economy. Indicators for the first goal include number of certificates and degrees awarded. Indicators for the second goal include percent of students employed or transferred, wages of students hired (as provided by the Kansas Department of Labor), and third-party technical credentials. Community and technical colleges must also include three indicators specific to the institution, one of which measures a non-college-ready student population.
Differential tuition. Each college sets its own tuition and higher rates of tuition, called “program fees,” are assessed by some colleges for some programs. At one community college, for example, tuition for all state residents is $86 per credit hour regardless of program. For another, the resident tuition is $120 per credit hour with extra program fees for some programs including practical nursing ($1,371), automotive service ($250), precision machining ($200), information systems ($200), and welding ($300). One technical college has in-state tuition of $95 per credit hour and annual program fees for every program, mostly in the range of $1,500 to $2,000.9
Course fees. Colleges may, and often do, charge students for supplies and laboratory costs. This information is typically published in the class schedule and is difficult to summarize here. As examples, one community college includes on its main website that “a few departments have special fees to cover the cost of labs and materials” and directs students to each program for details. Some of the programs listed as having the special fees are allied health, construction trades, cosmetology, environmental technology, and heating & air. Another college website has a “cost sheet” for each program that lists the estimated costs for required purchase of supplies. As examples, estimated costs of required supplies are $2,000 for automotive technology, $450 for hospitality/ culinary arts, $370 for dental assisting, and $300 for industrial engineering.10
A Closer Look at Three States
Texas
Separate technical institutions. Texas has 50 public community college districts with local governing boards. These districts are not organized into a college system. In addition to these institutions, there are four technical colleges comprising the Texas State Technical College System, which is governed by a board of regents. The technical college system was established in 1965. The technical colleges offer certificates and associate degrees in a wide range of career fields. The majority of degree offerings are associates of applied science. According to the Texas Education Code, “the emphasis of each Texas State Technical College System campus shall be on advanced or emerging technical programs not commonly offered by public junior colleges.”11
Differential funding. For each biennium, the Texas Legislature approves a rate per contact hour for 26 disciplines. This rate applies to community colleges, technical colleges, and state universities, although the portion of “need” as computed by these funding rates that is funded by the state varies across each set of institutions. The different state funding level is in part because the 50 community college districts are local institutions with local tax revenues, while the technical colleges are state institutions with no local funding base. For the 2012-13 biennium the lowest rate – for psychology, social services, and history – was $4.58 per contact hour. The highest was career pilot, at $21.51 per contact hour – far higher than the next highest, dental hygiene, at $11.96. Most of the other disciplines were in the range of $5.00 to $6.50 per contact hour. Cost rates are based on an annual study of public two-year college instruction and instructional administrative costs. A prorated amount of instructional administrative costs is added to each discipline’s cost per contact hour for a total discipline-based cost per contact hour.
Performance funding. In June 2013, the governor approved a new performance funding model that includes one approach for the community colleges and another for the technical colleges. Under the plan, 10% of state funding for the community colleges would
be determined by colleges’ performance in moving students through a set of “success points” including developmental education, gateway courses in English and math, credit hour attainment, credentials awarded, and transfers to a “general academic institution.” For the technical colleges, a new model is to be developed to allocate formula funding “based on the additional direct and indirect economic value provided to the state economy by their students.”12 Implementation of the
model would require identifying cohorts of graduates, transfers, and leavers and matching Unemployment Insurance (UI) wage records for employment and wage information for five years after the student graduated or left. Wages would then be compared to minimum wages.
Differential tuition. When the Texas Legislature deregulated tuition in 2003 it gave community and technical colleges freedom to set their own rates, including differential rates by program, subject to the approval of their governing boards. As an example from one technical college, general academic course tuition is $82, with an additional “designated tuition” of $46 for a total of $128 for one credit hour; “technical course” tuition is $97 for one credit hour, with the same additional “designated tuition” for a total of $143. As an example from a community college, there is a schedule for basic tuition, by numbers of credit hours, and a separate schedule of “special programs and tuition” with charges listed for 30 programs, ranging from $100 for computer maintenance technology to $11,771 for Aviation Technology - Pilot.13
Course fees. Course fees may be charged for a variety of purposes. One community college website lists lab fees for a long list of courses, ranging up to $24, a second list of insurance-related fees for clinical programs, of up to $70, and a third list of general course fees ranging from five fire protection technology courses with fees from $20 to $100, to $60 for each machining course, to $440 for each of several truck driving courses.14
WorkForCE InvESTmEnTS: STATE STrATEgIES To PrESErvE HIgHEr-CoST CArEEr EduCATIon ProgrAmS In CommunIT y And TECHnICAL CoLLEgES | 18
Illinois
No separate technical institutions. The Illinois Community College System consists of 48 community colleges organized into 39 districts, each with its own governing board. The system is coordinated by the Illinois Community College Board. All of the colleges offer academic transfer programs as well as CTE/workforce programs. The colleges award certificates, associates of applied science, and associates of arts/sciences. There are no colleges designated as “technical colleges.”
Differential funding. The majority of state funding for the community college system is appropriated using a credit-hour reimbursement model that differentiates among program costs in order to help maintain critical, but higher-cost, programs. There are six categories: baccalaureate, business, technical, health, remedial, and adult basic education. The reimbursement rates are based on end-of-year expenditures su