By
Thomas H. Cohen, J.D., Ph.D. BJS Statistician
Torts accounted for nearly two-thirds of the estimated 12,000 tort, contract, and real property cases disposed of by bench or jury trial in State courts of general jurisdiction in the Nation’s 75 largest counties in 2001.1 A tort involves one party alleging injury, damage, or financial loss stemming from the negligent or intentional acts of another party.
During 2001 over 90% of tort trials were decided by a jury, while judges adjudicated less than 10% of these cases.
Plaintiffs won in about half of all tort trials and were awarded a total of about $2.3 billion in compensatory and punitive damages. Half of all plain-tiff winners in tort jury and bench trials received damage awards of $27,000 or more. Appeals to a State intermediate appellate court or court of last resort were filed in 13% of tort trials disposed of in 2001.
These are some of the findings from a survey of tort trials in State courts of general jurisdiction. This report is the 1Courts of general jurisdiction typically handle civil disputes that are over certain monetary amounts. The exceptions are in States like California that have merged their limited and general jurisdiction courts.
Civil Justice Survey of State Courts, 2001
Tort Trials and Verdicts in
Large Counties, 2001
November 2004, NCJ 206240
• During 2001 an estimated 7,948 tort cases were disposed of by trial in State courts of general jurisdiction in the Nation’s 75 largest counties. • Juries decided over 90% of these tort cases, while judges adjudicated less than 10%.
• The 7,218 tort jury trials disposed of in 2001 represents a 23% decline from the 9,431 tort jury trials disposed of in these counties in 1992, consis-tent with data from 30 States showing decreases in the number of tort claims filed.
• In tort jury trials the overall median damage awards have declined 56% from $64,000 in 1992 to $28,000 in 2001.
• Fifty-two percent of tort trials involved a private individual suing another
individual, while 31% involved an individual suing a business. • Plaintiffs won in 52% of tort trials in 2001. This win rate has remained relatively unchanged since 1992. • About 5% of plaintiff winners in tort trials were awarded punitive damages. The median punitive damage award was $25,000.
• Litigants sought post verdict relief — amended judgment, judgment notwith-standing the verdict, new trial, or award modification — in 29% of all tort trials; 23% of these litigants seeking relief were granted relief, most frequently an award modification. • Litigants filed a notice of appeal to a State appellate court in 13% of tort trials disposed of in 2001.
Highlights
Median final damage awards in tort trials with individual plaintiff winners versus different defendant types in the Nation’s 75 largest counties, 2001
Median final damage awards Individual Business Government Hospital $0 $100,000 $200,000 $300,000 $400,000 $500,000 $600,000 Individual versus
Bureau of Justice Statistics
Bulletin
U.S. Department of Justice Office of Justice Programs
third in a series based on data
collected from the Civil Justice Survey of State Courts, 2001.2
The first report of this series provided a general overview of tort, contract, and real property cases decided by a bench or jury trial in the Nation’s 75 most populous counties in 2001. The second report focused on medical malpractice cases disposed of by trial. This third report describes the contours of tort trial litigation in the Nation’s 75 largest counties.
The sample of civil trials excluded civil matters that did not involve tort, contract, or real property cases. Federal trials, trials in counties outside the 75 most populous counties, and trials in State courts of limited jurisdic-tion were also excluded from the sample.
Types of tort trials
During 2001 State courts of general jurisdiction in the Nation’s 75 largest counties disposed of an estimated 7,948 tort trials. A prior BJS study on tort cases found that a minority (about 3%) were adjudicated by trial and that most (73%) were disposed of by settlement.3
Although tort trials account for a small percentage of tort dispositions, they are crucial to examine because they provide key information on plaintiff award compensation, punitive
damages, and case processing times. Tort cases that settle rarely include this type of information as part of the public record.
Of the estimated 7,948 tort trials disposed of in the Nation’s 75 largest counties in 2001, about half were automobile accident cases (table 1).
Premises liability and medical malprac-tice each accounted for nearly 15% of tort cases disposed of by trial. An estimated 2% of tort trials were product liability cases, in which the primary claim involved asbestos, toxic
substances, breast implants, tobacco, or other defective product matters.
Type of trial verdict
The majority of tort trials (93%) were decided by a jury, while judges adjudi-cated about 7% of tort trials (table 1).
Two percent of tort jury trials were disposed of by directed verdict, judgments notwithstanding the verdict (JNOV), or default jury trial. (For defini-tions, see page 9.) The right to a jury trial is guaranteed in most States; however, if neither the plaintiff nor the defendant makes a formal jury trial request, that right is forfeited, and the trial takes place before a judge. Juries disposed of an estimated 9 out of 10 medical malpractice (96%), automobile accident (93%), product liability (92%), and premises liability (91%) tort trial cases. At least a fifth of conversion, professional malpractice, intentional torts, and false arrest-imprisonment cases were adjudicated before judges.
Litigants
An estimated 24,904 litigants (plaintiffs and defendants) were involved in the 7,948 tort trials disposed of in the Nation’s 75 largest counties in 2001 (not shown in a table). Of these
litigants in tort trials, 11,209 were plain-tiffs, and 13,695 were defendants. Seventy-percent of tort trials were litigated by one plaintiff, while 56% involved one defendant.
2The two reports produced from the Civil Justice Survey of State Courts 2001 are Civil Trial Cases and Verdicts in Large Counties, 2001, NCJ 202803, and Medical Malpractice Trials and Verdicts in Large Counties, 2001, NCJ 203098, <http://www.ojp.usdoj.gov/bjs/civil.htm>. 3See BJS, Tort Cases in Large Counties, 1992, NCJ 153177, <http://www.ojp.usdoj.gov/bjs/ abstract/tcilc.htm>.
Note: Data for case and disposition type were available for 100.0% of the 7,948 tort trials. Detail may not sum to total because of rounding.
--No cases recorded.
*Other trial cases include trials with a directed verdict, judgments notwithstanding the verdict, and jury trials for defaulted defendants. Although these cases are typically placed in a separate category they are a form of jury trial.
5.4 12.1
82.6 4.9
390 Other or unknown tort
4.4 20.0
75.6 0.6
45 False arrest, imprisonment
7.1 46.4 46.4 0.3 27 Conversion --13.1 86.9 1.2 99 Animal attack 2.1 18.9 78.9 1.2 95 Slander/libel 1.0 32.7 66.3 1.3 102 Professional malpractice 0.9 2.9 96.2 14.5 1,156 Medical malpractice 3.5 20.3 76.3 4.7 375 Intentional tort 3.2 6.3 90.5 1.6 126 Other 3.2 --96.8 0.4 31 Asbestos 5.1 3.2 91.8 2.0 158 Product liability 2.4 6.2 91.4 16.0 1,268 Premises liability 1.5% 5.9% 92.6% 53.3% 4,235 Automobile 1.9% 7.3% 90.8% 100.0% 7,948 All tort trials
Other* Bench Jury Percent Number Case type Type of trial All tort trials
Table 1. Tort cases disposed of by trial in State courts in the Nation's 75 largest counties, 2001
Sixty-three percent of the tort jury trials with data on the nature of the jury's decision resulted in a unani-mous verdict for the plaintiff or the defendant
Note: Only includes States that permitted non-unanimous verdicts. States that required unanimous verdicts were not included. Data on the unanimity of jury verdicts were available in 64.3% of the 4,797 jury trials. 41.5 Intentional tort 57.4 Medical malpractice 62.9 Product liability 65.6 Premises liability 66.8 Automobile 63.0% All tort trials
Percent of jury verdicts that were unanimous Selected
Litigant pairings
For each tort trial, data were collected on whether the plaintiff or defendant
was an individual, government, business, or hospital (table 2). Four-fifths of tort trials involved an individual suing either another individual (52%)
or a business (31%). Individuals sued hospitals or governmental agencies in less than 15% of tort trials.
A relatively small number of tort trials involved non-individual plaintiffs. Governments and businesses were plaintiffs in an estimated 4% of all tort trials. Among bench trials non- individual plaintiffs were more
common. Governments or businesses were plaintiffs in about 10% of bench tort trials (not shown in a table).
Automobile trials versus other tort trials
Accounting for around half of all tort trials, automobile accident cases are characterized by marked differences in their litigant pairings (table 2). Nearly three-fourths of automobile accident trials involved individuals suing other individuals. In comparison, individuals sued other individuals in 28% of non-automobile accident tort trials. Individual plaintiffs were more likely to litigate against businesses (42%) or hospital defendants (18%) in trials where the primary claim did not involve an automobile accident.
Note: Data for litigant pairings were available for 99.3% of all tort trials, 99.2% of automobile trials, and 99.4% of all non-automobile tort trials. Plaintiff or defendant type for each case is whichever type appears first on this list: (1) hospital/medical company; (2) corporate/business; (3) government agencies; (4) individuals. For example, any case involving a hospital defendant is categorized as a case with a "hospital defendant" even if there were also business, individual, and government defendants in the case. Detail may not sum to total because of rounding. A “0.0” indicates a statistic of less than .05%.
--No cases recorded.
aIncludes law enforcement and other government organizations.
bIncludes insurance companies, banks, and other business organizations. cIncludes medical companies.
dIncludes bench and jury trials, trials with a directed verdict, judgments notwithstanding the verdict, and jury trials for defaulted defendants.
--0.1 --18.2 675 Hospital defendantc --2.7 0.4 42.0 1,663 Business defendantb 0.0 0.3 0.1 7.0 272 Government defendanta --0.8% 0.1% 28.4% 1,080 Individual only defendant
All other tort trials
--0.3 13 Hospital defendantc --1.5 0.0 20.5 926 Business defendantb --0.1 --3.5 149 Government defendanta --0.8% 0.2% 73.1% 3,113 Individual only defendant
Automobile tort trials
--0.0 --8.7 688 Hospital defendantc --2.1 0.2 30.6 2,590 Business defendantb 0.0 0.2 0.0 5.1 421 Government defendanta --0.8% 0.2% 52.2% 4,193 Individual only defendant
All tort trialsd
Hospitalc Businessb Governmenta Individual Number Case type Plaintiffs
Table 2. Pairings of primary litigants in tort trial cases, by case type, in State courts in the Nation's 75 largest counties, 2001
Defective products in product liability trials in the 75 largest counties, 2001
• Of the 144 product liability trials for which the type of defective product was known, 28% dealt with asbestos or other toxic substances.
• Cases involving defective vehicles such as automobiles, trucks, or airplanes accounted for about 12% of the 144 product liability trials. • Defective construction, electrical, or manufacturing equipment was involved in about 19% of the 144 product liability trials disposed of in the Nation's 75 largest counties during 2001.
• Punitive damages were awarded to plaintiff winners in 3 of 144 product liability trials (not shown in a table). • There was 1 tobacco product liability trial in the Nation's 75 largest counties in 2001. This was a jury trial involving 1 plaintiff against 4 business defen-dants. The jury ruled in favor of the defendants.
Product liability Type of defective trialsa product Number Percent
Total 144 100.0% Toxic substances 40 27.9% Asbestos 31 21.8 Other substances 9 6.1 Equipmentb 27 18.7 Home appliances 24 17.0 and itemsc Other productd 21 14.6 Vehiclee 18 12.4 Medicalf 8 5.5 Foodg 6 4.0
Note: Type of defective product was known for 144 of the 158 product liability trials. Detail may not sum to total because of rounding. aTrials include bench and jury trials, trials with a directed verdict, judgments notwithstanding the verdict, and jury trials for defaulted defendants. bIncludes construction, electrical, and manufac-turing equipment.
cIncludes home furniture, small appliances, workshop tools, yard equipment,
TV/Stereo/VCR appliances, and sporting goods. dIncludes natural gas, tobacco, and other products.
eIncludes automobiles, trucks, and other forms of transport (airplanes).
fIncludes nonprescription and prescription drugs, cosmetics, breast and other internal implants, and other medical equipment and devices.
gIncludes food in restaurants and grocery stores.
Plaintiff winners
Plaintiffs prevailed in about half of all tort trials disposed of in the Nation’s 75 largest counties during 2001 (table 3). The plaintiff win rates varied considera-bly, depending on the type of tort case litigated. Among some tort case categories such as automobile, asbes-tos, and animal attack, the estimated plaintiff win rates approached or exceeded 60%.
Plaintiffs were less successful in other kinds of tort cases. Plaintiffs prevailed in less than a third of medical malprac-tice trials and won in less than a half of premises liability, slander/libel, false arrest, and other product liability trials. Plaintiffs prevailed to a greater extent in tort trials heard by judges than juries. Judges found in favor of plaintiffs in nearly two-thirds of tort trials, while juries ruled for the plaintiffs in about half of tort trials.
Final awards
During 2001 plaintiff winners in tort jury and bench trials were awarded an estimated $2.3 billion in compensatory and punitive damages in the Nation’s 75 largest counties (table 4). The median award for plaintiff winners in tort trials was $27,000. About 19% of these plaintiff winners received
damage awards over $250,000, and an estimated 8% were awarded at least $1 million or more in damages. Damage awards for plaintiff winners in tort trials differed markedly by case type. In some tort case categories the median awards were relatively modest. For example, automobile and premises liability cases, which together accoun-ted for about three-fourths of all tort trials with a plaintiff winner, generated median awards of $16,000 and $59,000, respectively.
In other tort case categories, the median awards were considerably higher. Half the plaintiff winners in asbestos cases, for example, were awarded damages of $1.7 million or more. Since asbestos cases tended Note: Data on plaintiff winners were available for 99.9% of all tort trials.
Detail may not sum to total because of rounding. --No cases recorded.
aIncludes bench and jury trials, trials with a directed verdict, judgments notwithstanding the verdict, and jury trials for defaulted defendants.
bDoes not include jury trials that involved trials with a directed verdict, judgments notwithstanding the verdict, and jury trials for defaulted defendants.
cExcludes bifurcated trials where the plaintiff litigated only the damage claim.
65.9 44 50.2 319 50.9 383 Other or unknown tort
22.2 9 50.0 34 42.2 45 False arrest, imprisonment
23.1 13 61.5 13 46.4 28 Conversion 53.8 13 68.6 86 66.7 99 Animal attack 22.2 18 47.3 74 41.5 94 Slander/libel 43.8 32 55.2 67 52.5 99 Professional malpractice 50.0 32 26.3 1,107 26.8 1,149 Medical malpractice 68.5 73 53.7 281 56.8 366 Intentional tort 50.0 8 40.2 112 40.3 124 Other --62.1 29 60.0 30 Asbestos 50.0 8 44.7 141 44.2 154 Product liability 57.7 78 41.5 1,151 42.0 1,260 Premises liability 78.0% 250 60.2% 3,812 61.2% 4,121 Automobile 64.7% 570 50.7% 7,085 51.6% 7,798 Tort cases winners Numberc winners Numberc winners Numberc Case type Plaintiff Plaintiff Plaintiff Bench trials Jury trialsb
All tort trialsa
Table 3. Tort trial plaintiff winners in State courts in the Nation's 75 largest counties, 2001
Note: Data for final awards were available for 99.5% of all sampled tort trials. Final amount awarded includes compensatory (reduced for contributory negligence) and punitive damage awards. Award data were rounded to the nearest thousand. Detail may not sum to total because of rounding.
*The number of plaintiffs awarded damages may differ from the number calculated from the percentage of plaintiffs who successfully litigated the case (table 3). Missing award data, the fact that in some cases plaintiff winners receive nothing because of award reductions, and the inclusion of plaintiff winners in bifurcated damage trials (a group excluded from table 3) account for some of this difference.
--No cases recorded.
aExcludes bifurcated trials where the plaintiff litigated the liability claim. Bifurcated trials involving damage claims; however, have been included.
bAll tort trials include bench and jury trials, trials with a directed verdict, judgments notwithstanding the verdict, and jury trials for defaulted defendants.
15.5 39.9
106,000 374,514,000
199 Other or unknown tort
--14.6
30,000 2,185,000
19 False arrest, imprisonment
--23,000 926,000 13 Conversion --11.7 18,000 6,741,000 66 Animal attack 6.0 39.6 121,000 17,067,000 39 Slander/libel 13.9 30.6 93,000 43,108,000 51 Professional malpractice 29.7 66.1 422,000 600,746,000 311 Medical malpractice 16.3 25.4 37,000 128,428,000 214 Intentional tort 31.4 54.7 311,000 112,878,000 51 Other 59.7 90.7 1,650,000 86,275,000 19 Asbestos 39.1 64.6 450,000 199,153,000 70 Product liability 9.1 22.9 59,000 400,653,000 522 Premises liability 2.8% 8.6% $16,000 $526,435,000 2,565 Automobile 7.7% 18.8% $27,000 $2,299,957,000 4,069* All tort trialsb
$1 million or more Over 250,000 Median Total awarded to plaintiff winnersa Case type Percent of plaintiff winner cases with final awards— Final amount awarded
to plaintiff winners Tort trials
with damages
Table 4. Final award amounts for tort trials with plaintiff winners in State courts in the Nation's 75 largest counties, 2001
to involve multiple plaintiffs, few plain-tiffs received the whole award amount when successful in these trials. In medical malpractice trials the median awards ($422,000) were nearly 16 times greater than the overall median awards in tort trials. Damage verdicts of $1 million or more were awarded in about a third of medical malpractice trials. These higher award amounts are partially explained by the fact that in 9 out of 10 medical malpractice trials the plaintiffs alleged that the defendant’s negligence caused a permanent injury or death (not shown in a table).
The median final award of $28,000 in tort jury trials and $23,000 in tort bench trials did not differ statistically (not shown in a table).
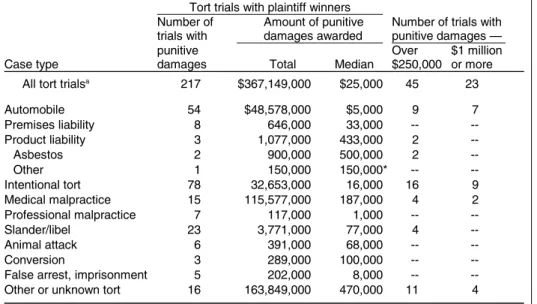
Punitive damage awards
Plaintiffs are entitled to punitive
damages when the defendant’s actions are so “willful, malicious, or fraudulent” that ordinary damages alone would not fully compensate the plaintiff for an inflicted injury. Unlike other forms of damage relief afforded to plaintiffs, punitive damages serve as a means for “punishing the defendant” and deterring others from committing similar actions (Black’s Law Dictionary).
Nearly 60% of plaintiff winners in slander/libel trials and about 36% of plaintiff winners in intentional tort trials were awarded punitive damages (table 5). Punitive damages were awarded to less than 5% of plaintiff winners in product liability trials.
Punitive damages were more likely to be awarded in bench (11%) than in jury (5%) tort trials. The median punitive damage awards in bench ($15,000) and jury ($23,000) tort trials, however, was not significantly different (not shown in a table).
Largest tort damage award
In the 2001 database the tort trial that generated the largest damage award involved a case alleging malicious prosecution. In 1999 the defendant, who was both a general manager and equity holder for an automobile outlet company, was accused of stealing millions from the company. Federal officials
responded by launching a fraud investigation into the defendant’s activities.
The defendant’s attorney advised the defendant to file a RICO suit against the automobile outlet’s owners. The RICO suit alleged that the owners were “responsible for any missing inventory” and were
“engaged in a racketeering conspir-acy.” The suit was dismissed in Federal court, and the owners then filed suit against both the defendant and the defendant’s attorney alleging “abuse of the civil process.” Soon after the owners filed suit, the defen-dant fled the country.
The trial took place before a jury in Philadelphia and lasted 7 days. In the second week of trial, the defen-dant’s attorney settled, leaving the fugitive defendant as the sole person being sued. The jury found in favor of the auto outlet’s owners and awarded $50 million in compensa-tory and $100 million in punitive damages. The defendant never appeared to contest the case and as of 2002 was still a fugitive.
Source for additional case details: The National Law Journal, February 4, 2002. Note: Data on punitive damages were available for 99.6% of all sampled tort trials
in which the plaintiff winner was awarded damages. Detail may not sum to total because of rounding. Award data were rounded to the nearest thousand. *Not median but the actual amount awarded.
--No cases recorded.
aIncludes bench and jury trials, trials with a directed verdict, judgments notwithstanding the verdict, and jury trials for defaulted defendants.
4 11
470,000 163,849,000
16 Other or unknown tort
--8,000 202,000
5 False arrest, imprisonment
--100,000 289,000 3 Conversion --68,000 391,000 6 Animal attack --4 77,000 3,771,000 23 Slander/libel --1,000 117,000 7 Professional malpractice 2 4 187,000 115,577,000 15 Medical malpractice 9 16 16,000 32,653,000 78 Intentional tort --* 150,000 150,000 1 Other --2 500,000 900,000 2 Asbestos --2 433,000 1,077,000 3 Product liability --33,000 646,000 8 Premises liability 7 9 $5,000 $48,578,000 54 Automobile 23 45 $25,000 $367,149,000 217 All tort trialsa
$1 million or more Over $250,000 Median Total punitive damages Case type
Number of trials with punitive damages — Amount of punitive
damages awarded Number of
trials with
Tort trials with plaintiff winners
Table 5. Punitive damages awarded to plaintiff winners in tort trials in State courts in the Nation's 75 largest counties, 2001
The role of contributory or comparative plaintiff negligence
A plaintiff’s own negligent actions may contribute wholly or partially to the injury sustained. Six States maintain the doctrine of contributory negli-gence.4 In these States any plaintiff negligence automatically bars recovery for damages. The remaining States use differing forms of comparative negligence in which damages are proportionally reduced according to the plaintiff’s negligence.
In States that employ contributory or comparative negligence, compensatory damages awarded to plaintiff winners were reduced in 14% of tort trials disposed of in the Nation’s 75 largest counties during 2001 (table 6). These awards were reduced 38% on average. In a third of the premises liability trials with a plaintiff winner, the compensa-tory awards were reduced due to the plaintiff’s own negligence. The average award reduction in these trials was about 42%.
Plaintiff winners tended to receive award reductions more frequently in jury than in bench trials. Sixteen percent of plaintiff winners in jury trials had their awards reduced, while in bench trials, 6% of plaintiff awards were reduced (not shown in a table).
Case processing time
Half of the estimated 7,900 tort cases disposed of by trial in the Nation’s 75 largest counties in 2001 went from filing of the complaint to final verdict or judgment within an estimated 22 months (figure 1). Among medical
malpractice and non-asbestos product liability trials, the median case process-ing times from filprocess-ing to disposition were 29 and 28 months, respectively. Asbestos product liability trials, in comparison, were processed within a median of 10 months.
Figure 1
Note: Data on whether awards were reduced for contributory or comparative negligence were available for 99.0% of sampled trials with a plaintiff winner and a known initial award amount. Detail may not sum to total because of rounding.
*Not mean but actual reduction amount. --No cases recorded.
aOnly includes plaintiffs who won an initial monetary damage award. bIncludes bench and jury trials, trials with a directed verdict, judgments notwithstanding the verdict, and jury trials for defaulted defendants.
37.4 27
13.8 199
Other or unknown tort
--19
False arrest, imprisonment
--13 Conversion 43.3 4 6.3 65 Animal attack 40.0* 1 2.5 39 Slander/libel 31.6 7 13.7 51 Professional malpractice 30.5 20 6.6 307 Medical malpractice 27.2 18 8.5 214 Intentional tort 27.6 9 19.0 49 Other --19 Asbestos 27.6 9 13.7 68 Product liability 41.5 173 33.4 518 Premises liability 36.8% 324 12.7% 2,553 Automobile 37.5% 584 14.4% 4,045
All tort trialsb
reduction Number Percent a plaintiff winnera Case type Mean percent tort trials with
Tort trials with awards reduced Number of
Table 6. Plaintiff winners with awards reduced in tort trials due to contributory or comparative negligence in State courts in the Nation's 75 largest counties, 2001
4Alabama, Maryland, South Carolina, Delaware, North Carolina, and Virginia are contributory negligence States. American Juris-prudence, 2nd edition (1989, supp. 1995), 57B, pp. 1131-49.
Median number of months to dispose of tort trials from filing to disposition, 2001
Asbestos Automobile Intentional tort
All tort trials
Premises liability Other product liability Medical malpractice
0 10 20 30 Median number of months
Tort trials in U.S. district courts, 2001
• U.S. district courts exercise jurisdiction in civil actions between private parties that involve the interpretation and application of a Federal question arising from the U.S. Constitution, or in cases where the parties reside in different States or countries and the amount in controversy exceeds $75,000, or in cases where the U.S. Government is the plaintiff or defendant. Of the 248,174 civil cases terminated in the U.S. district courts during fiscal year 2001, 14% (34,918) were tort claims. About 4% (1,234) of these tort claims were termi-nated by a jury or bench trial.
• A jury decided tort trials less often in U.S. district courts (79%) than in State courts of general jurisdiction in the Nation’s 75 largest counties during 2001 (93%).
• Plaintiffs won about half of tort trials in both U.S. district courts (51%) and State courts of general jurisdiction in the Nation’s 75 largest counties (52%). Plaintiff winners, however, were awarded less monetary damages in State courts, with a median of $27,000, compared to a median of $179,000 awarded to plaintiff winners of tort trials decided by U.S. district courts during 2001. Source: Administrative Office of the U.S. Courts, Civil Master File, fiscal year 2001. Published reports on Federal District Court data are also available from the U.S. Administrative Office of the Courts: <http://www.uscourts.gov>. See also Civil Trial Cases and Verdicts in Large Counties, 2001, BJS Bulletin, NCJ 202803, April 2004.
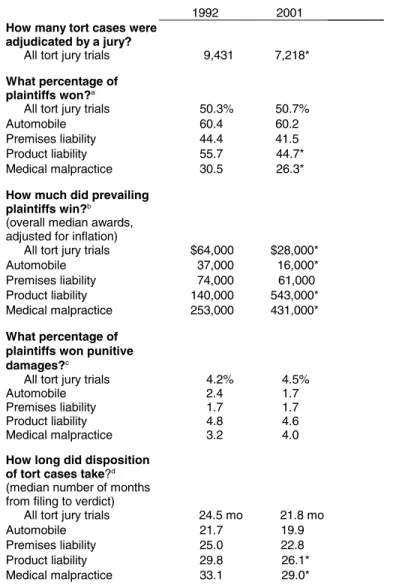
Trends in tort jury trials
• The number of tort trials decided by a jury in the Nation’s 75 largest counties declined 23%, from 9,431 trials in 1992 to 7,218 trials in 2001 (table 7). The growing use of alter-native dispute resolution (ADR) and other tort reform efforts aimed at limiting damage awards and tort litigation may provide a partial explanation for this trend. The National Center for State Courts also reports that tort filings in 30 States declined 9% from 1992 to 2001, contributing to the decrease in tort trials.5
• The plaintiff win rate in tort jury trials remained relatively stable from 1992 to 2001. During this period about half of all plaintiffs prevailed in tort jury trials. Some tort case categories witnessed declining plaintiff win rates. In 1992 nearly a third of plaintiffs prevailed in medical malpractice cases tried by a jury; by 2001 about a fourth of plaintiffs won medical malpractice jury trials. The plaintiff win rate also declined in product liability jury trials. Plaintiffs won 56% of product liability jury trials in 1992, but 45% of these trials in 2001.
• The median damage awards in tort jury trials declined from $64,000 in 1992 to $28,000 in 2001.6 The smaller damage awards imposed by juries in automobile accident trials partially explains this trend. At least half of plaintiff winners in automobile accident jury trials won $37,000 or more in damages in 1992; by 2001 the median damage award for plaintiff winners in automobile accident trials had declined to $16,000.
• Medical malpractice and product liability trials had marked increases in their median jury damage awards. In product liability jury trials, the median award amounts were at least 3 times higher in 2001 ($543,000) than in 1992 ($140,000). The median award amounts for medical malpractice jury trials nearly doubled from $253,000 in 1992 to $431,000 in 2001.
• Since 1992 the percentage of tort jury trials with punitive damage awards has remained unchanged. The reported differences in plaintiff winners receiving punitive damages between 1992 (4%) and 2001 (5%) were not statistically significant.
• In 1992 half of all tort cases proceeded from initial filing to jury verdict in nearly 25 months, while during 2001, the time was 22 months. These differences were not statisti-cally significant.
5The sources for these findings are Tort Reform Record, American Tort Reform Association, 2003, and B. Ostrom, N. Kauder, and R. LaFoun-tain, Examining the Work of State Courts, 2002: A National Perspective from the Court Statistics Project, 2003.
6The 1992 damage award amount was adjusted to account for inflation. The adjustment was calculated through the U.S. Department of Labor’s website <http://www.bls.gov/cpi/home.htm>.
Note: The number of trials includes tort jury trials adjudicated in 1992 and 2001. Bench trials, trials with a directed verdict, judgments notwithstanding the verdict, and jury trials for defaulted defendants have been excluded. Bench trials are not included because no award data were collected for bench trials in 1992. Data Sources: Civil Justice Survey of State Courts, 1992 (ICPSR 6587) and 2001 (ICPSR 3957). Data can be obtained from the University of Michigan Inter-university Consortium for Political and Social Research (ICPSR) at <http://www.icpsr.umich.edu/>. Product liability trials include both the asbestos and other product liability case categories.
Award data were rounded to the nearest thousand. *1992 - 2001 difference is significant at the 95% confidence interval.
aData on plaintiff winners were available for 99.4% of tort jury trials in 1992 and 99.9% of tort jury trials in 2001.
bData on final awards in tort jury trials were available for 97.0% of plaintiff winners in 1992 and 99.5% of plaintiff winners in 2001. cData on punitive damages in tort jury trials were available for 97.1% of plaintiff winners in 1992 and 98.4% of plaintiff winners in 2001.
dData on time to disposition were available for 79.7% of tort jury trials in 1992 and 99.9% of tort jury trials in 2001.
29.0* 33.1 Medical malpractice 26.1* 29.8 Product liability 22.8 25.0 Premises liability 19.9 21.7 Automobile 21.8 mo 24.5 mo
All tort jury trials
How long did disposition of tort cases take?d (median number of months from filing to verdict)
4.0 3.2 Medical malpractice 4.6 4.8 Product liability 1.7 1.7 Premises liability 1.7 2.4 Automobile 4.5% 4.2%
All tort jury trials
What percentage of plaintiffs won punitive damages?c 431,000* 253,000 Medical malpractice 543,000* 140,000 Product liability 61,000 74,000 Premises liability 16,000* 37,000 Automobile $28,000* $64,000
All tort jury trials (overall median awards, adjusted for inflation)
How much did prevailing plaintiffs win?b 26.3* 30.5 Medical malpractice 44.7* 55.7 Product liability 41.5 44.4 Premises liability 60.2 60.4 Automobile 50.7% 50.3%
All tort jury trials
What percentage of plaintiffs won?a
7,218* 9,431
All tort jury trials
How many tort cases were adjudicated by a jury?
2001 1992
Table 7. Comparing tort jury trials in State courts in the Nation's 75 largest counties, 1992 to 2001
Tracking post verdict motions for relief in tort trials
After a tort trial reaches verdict or judgment, litigants often file post-verdict motions seeking to modify or overturn the trial outcome. These can include motions for judgments notwith-standing the verdict (JNOV) or for an amended judgment, motions for a new trial, motions to modify the award, or motions for some “other” form of relief.
A motion for a JNOV or an amended judgment is filed when the moving party requests that the judge render a verdict in favor of one party despite the fact that the jury or judge found in favor of the other party. A motion for a new trial is filed when one party seeks to have the verdict or judgment discarded and the case tried again. A motion to modify the award occurs when one party seeks to have the damage award increased or reduced. A motion for
“other relief” typically involves attorney fees and other court costs.7
Both plaintiffs and defendants sought post verdict relief at similar rates in tort trials where plaintiffs prevailed (table 8). Plaintiffs filed motions for post verdict relief in 19% of tort trials where they won, while defendants requested post verdict relief in 23% of tort trials with a plaintiff winner.
A variety of underlying factors could drive plaintiff post verdict activity in trials in which the plaintiff received a favorable outcome. These can include pre-trial “high-low” agreements with the defendants or post-trial settlements as well as dissatisfaction with the damage awards imposed at trial. In a “high-low” agreement both parties agree on an acceptable range of damages. If the award falls outside that range, the award is adjusted to fit within the agreed upon range.
The types of post verdict relief sought most commonly by plaintiff winners in tort trials were motions for new trials or award modifications. These forms of post verdict relief accounted for nearly 6 out of 7 plaintiff post verdict motions. In tort trials where the defendant filed a subsequent motion for post verdict relief, 60% of those motions were for a new trial while 30% were for a JNOV or amended judgment.
Tort trials that the plaintiff did not win also manifested substantial post verdict activity. Plaintiffs filed motions for post verdict relief in about a quarter of tort trials that they lost. In 85% of these cases, the plaintiff requested that the court discard the verdict or judgment and grant a new trial.
In tort trials in which the plaintiff did not prevail, defendants rarely engaged in post verdict activity. Less than 5% of defendants sought post verdict relief, in the form of attorney fees and court costs, in tort trials without a plaintiff winner.
Note: Post verdict motions filed by plaintiffs or defendants include motions for judgments notwith-standing the verdict, amended judgments, new trials, award modifications, and other relief. aThe type of post verdict relief sought may not sum to 100% because the post verdict relief categories are not mutually exclusive. After a verdict is reached, parties can seek multiple forms of post verdict relief.
bFor tort trials in which plaintiffs prevailed, data on plaintiff post verdict activity were available for 99.0% of trials, and data on defendant post verdict activity were available for 98.7% of trials. cFor tort trials in which plaintiffs did not prevail, data on plaintiff post verdict activity were available for 98.6% of trials, and data on defendant post verdict activity were available for 98.7% of trials.
79.9 3.8 10.3 9.6 129 3.5 Defendants 6.6% 2.6% 84.5% 25.5% 831 22.2% Plaintiffs
Plaintiff did not prevailc
15.3 28.0 59.9 30.1 933 22.8 Defendants 19.6% 42.4% 42.0% 9.5% 766 18.7% Plaintiffs Plaintiff prevailedb relief modification trial judgment Number of all trials sought by — Other Award New amended Percent
Post verdict relief
JNOV or verdict relief sought
Percent of trials in which litigants sought post verdict reliefa Tort trials in which post
Table 8. Type of post verdict relief sought by plaintiffs or defendants in tort trials in State courts in the Nation's 75 largest counties, 2001
Note: Post verdict motions filed by plaintiffs or defendants include motions for judgments notwith-standing the verdict, amended judgments, new trials, award modifications, and other relief. aThe type of post verdict relief granted may not sum to 100% because the post verdict relief categories are not mutually exclusive.
bThe number of litigants seeking post verdict relief in table 9 differs from the number posted in table 8 because of missing or incomplete post verdict relief granted data.
cAmong tort trials where plaintiffs prevailed, data on the granting of post verdict relief were avail-able for 95.5% of the 766 trials where the plaintiff sought post verdict relief and 96.6% of the 933 trials where the defendant sought post verdict relief.
dAmong tort trials where plaintiffs did not prevail, data on the granting of post verdict relief were available for 98.1% of the 831 trials where the plaintiff sought post verdict relief and 95.5% of the 129 trials where the defendant sought post verdict relief.
70.5 7.1 17.9 7.4 32.8 124 Defendants 37.5% 6.2% 53.5% 4.2% 8.7% 816 Plaintiffs
Plaintiff did not prevaild
16.8 61.4 14.0 9.8 28.0 901 Defendants 21.0% 66.1% 8.6% 5.0% 41.6% 731 Plaintiffs Plaintiff prevailedc relief modification trial judgment relief granted soughtb granted to — Other Award New amended Percent in which Number Post verdict relief
JNOV or relief in tort trials
Percent of tort trials in which litigants sought and were granted reliefa Post verdict
Table 9. Type of post verdict relief granted to plaintiffs or defendants in tort trials in State courts in the Nation's 75 largest counties, 2001
7Paula Hannaford-Agor, 2004, Not Quite the End of the Road: Post Trial Activity in Civil Litigation, Williamsburg, VA: National Center for State Courts.
Plaintiffs were more likely to be granted post verdict relief if they won at trial (table 9). The courts granted post verdict relief to 42% of plaintiff winners seeking to have their verdict modified. The most common form of post verdict relief granted to these plaintiffs was an award modification. In comparison 9% of plaintiffs who did not prevail at trial and who subsequently filed a post verdict motion received some form of post trial relief. About half of these plaintiffs were granted a new trial and 38% received some form of “other” relief.
Post verdict relief was granted to 28% of defendants who sought to modify a favorable plaintiff verdict or judgment. In nearly two-thirds of these cases, the relief granted was in the form of an award modification and in 14% of these cases a new trial was granted.
Although less than 5% of defendants sought to modify a verdict or judgment that went against the plaintiff, nearly a third of these defendants were granted some type of post verdict relief.
Appeals in tort trials
Filing a notice of appeal to the State’s intermediate appellate court or court of last resort represents another option
for litigants seeking to overturn or modify a verdict or judgment that they believe does not comply with State law. Appeals to a State supreme or inter-mediate appellate court were filed in 13% of tort trials (not shown in a table). The appeal rate depended upon the trial outcome. Plaintiffs filed appeals in 4% of tort trials in which they prevailed and 11% of tort trials in which they lost (table 10). Defendants gave notice of appeal in 11% of tort trials with a plain-tiff winner; however, they rarely filed appeals in tort trials where the plaintiff did not receive a favorable verdict. The rate of appeals also varied substantially by case type. Defendants filed notices of appeal in about 40% of slander/libel and false arrest imprison-ment trials in which they lost. Defen-dants also gave notice of appeal in 28% of medical malpractice, 31% of professional malpractice, and 38% of product liability trials with prevailing plaintiffs. Among tort trials that the plaintiff lost, plaintiffs filed an appeal in at least 20% of product liability and slander/libel trials and in 30% or more of trials involving professional malprac-tice or conversion issues.
Methodology
Definitions of disposition types:
Jury trial A trial held before and decided by a group of laypersons selected according to the law presided over by a judge culminating in a verdict for the plaintiff(s) and/or defendant(s).
Bench trial (nonjury trial) A trial held in the absence of a jury and decided by a judge culminating in a judgment for the plaintiff(s) or defendant(s).
Directed verdict In a case in which the party with the burden of proof has failed to present a prima facie case for jury consideration, a trial judge may order the entry of a verdict without allowing the jury to consider it,
because, as a matter of law, there can be only one such verdict.
Judgment notwithstanding the verdict("JNOV" or Judgment non
obstante veredicto) A judgment
rendered in favor of one party despite the finding of a jury verdict in favor of the other party.
Jury trials for defaulted defendants
Some States make provisions for a jury to be impaneled even if the defendants in a case fail to appear and enter a defense. The purpose of a trial is typically to decide issues such as amount of damages.
Definitions of civil case types
Torts Claims arising from personal
injury or property damage caused by negligent or intentional acts of another person or business. Specific tort case types include: automobile accident; premises liability (injury caused by the dangerous condition of residential or commercial property); medical malpractice (by doctor, dentist, or medical professional); other profes-sional malpractice (such as by lawyers, engineers, and architects); product liability (injury or damage caused by defective products; injury caused by toxic substances such as asbestos); libel/slander (injury to reputation); intentional tort (vandalism, intentional Note: Tort trials appeals data were available for 99.0% of tort trials where the plaintiff
prevailed and 99.4% of tort trials where the plaintiff did not prevail. Detail may not sum to total because of rounding.
--No cases recorded.
aIncludes bench and jury trials, trials with a directed verdict, judgments notwithstanding the verdict, and jury trials for defaulted defendants.
1.2 19.9 187 27.7 6.7 195
Other or unknown tort
--4.9 24 42.1 5.2 19
False arrest, imprisonment
--38.5 15 17.0 21.8 13 Conversion --6.3 33 8.2 1.5 66 Animal attack --22.2 55 42.9 11.4 39 Slander/libel --34.0 47 31.2 5.5 54 Professional malpractice 0.5 13.8 832 27.7 10.6 306 Medical malpractice --18.4 158 15.6 2.8 213 Intentional tort 4.0 24.6 74 39.4 11.8 52 Other --16.4 12 34.2 5.7 17 Asbestos 3.5 23.4 86 38.1 10.3 70 Product liability 1.6 11.0 726 13.8 4.8 524 Premises liability 0.6% 5.8% 1,614 5.3% 2.7% 2,606 Automobile 0.8% 10.9% 3,778 11.2% 4.1% 4,105
All tort trialsa
Defendant Plaintiff tort trials Defendant Plaintiff tort trials Case type Case appealed by — Number of
Cases appealed by— Number of
Tort trials without plaintiff winners Tort trials with plaintiff winners
Table 10. Tort trials in which plaintiff or defendant gave notice of appeal in State courts in the Nation's 75 largest counties, 2001
personal injury); animal attack (the negligent supervision of a dog or other animal resulting in an attack); conver-sion (unauthorized use or control of another person’s personal property); false arrest/imprisonment (an arrest or imprisonment without the proper legal authority); and other negligent acts (negligence against another party for an act not represented by the other case categories).
Sample
The sample design for the 2001 civil trial study was similar to the ones used for the 1996 and 1992 BJS civil trial studies. The sample is a 2-stage strati-fied sample with 46 of the 75 most populous counties selected at the first stage. The 75 counties were divided into 5 strata based on 1990 civil dispo-sition data obtained through telephone interviews with court staff in the
general jurisdiction trial courts. Stratum 1 consisted of the 14 counties with the largest number of civil case disposi-tions. Every county in stratum 1 was selected with certainty. Stratum 2 consisted of 13 counties with 11 chosen for the sample. From stratum 3, 10 of the 18 counties were selected. Nine of the 26 counties in stratum 4 were included in the sample. Stratum 5 was added to the 2001 sample to replace Norfolk County, Massa-chusetts, a stratum 4 site that partici-pated in the 1992 and 1996 studies but that fell out of the 75 most populous counties in the 2000 Census. Mecklen-burg County, North Carolina, and El Paso County, Texas, were randomly selected from the 4 counties whose population increased sufficiently that they joined the ranks of the 75 most populous counties.
The second stage of the sample design involved generating lists of cases that would be coded. Prior to drawing the 2001 case sample, each participating jurisdiction was asked to identify a list of cases that had been disposed of by jury trial or bench trial between January 1, 2001, and Decem-ber 31, 2001. Trial cases were to meet the following definitional criteria for jury and bench trials as defined by the
Bureau of Justice Statistics and the National Center for State Courts: (1) A jury trial was defined as "a trial held before and decided by a jury of layper-sons and presided over by a judge culminating in a verdict for the plaintiff(s) or defendant(s)," and (2) A bench trial was defined as "a trial held in the absence of a jury and decided by a judge culminating in a judgment for the plaintiff(s) or defendant(s)."
The study plan was to obtain every jury and bench trial disposed from the court of general jurisdiction in each of the counties selected for the study. In courts where the number of trials became too great, a sample of civil trials was selected. Regardless of whether all or a sample of civil trials was collected, every medical malprac-tice or product liability case was included to oversample these case types.
At the second stage of sampling, all tort, contract, and real property cases disposed of by bench or jury verdict between January 1, 2001, and Decem-ber 31, 2001, were selected in 43 juris-dictions. In two of the remaining three jurisdictions (Cook and Philadelphia), a sample of civil trials was selected and then “weighted” to obtain an appropri-ate number of civil trials. In Bergen County some civil case files were unavailable for coding purposes. Weights were applied in Bergen County in order to account for these missing cases.
Data on 6,215 civil jury trial cases, 1,958 civil bench trial cases, and 138 other civil trial cases that met the study criteria were collected in the 46 courts. The final sample consisted of 8,311 tort, contract, and real property cases disposed of by jury or bench trial. Sampling error
Since the data in this report came from a sample, a sampling error (standard error) is associated with each reported number. In general if the difference between 2 numbers is greater than twice the standard error for that differ-ence, there is confidence that for 95
out of every 100 possible samples a real difference exists and that the apparent difference is not simply the result of using a sample rather than the entire population. All differences discussed in the text of this report were statistically significant at or above the 95-percent confidence level. Standard error estimates were generated by using a bootstrap method (jackknife) available for WESVAR PC.
Data coding
For each sampled case, a standard coding form was manually completed by on-site court staff to record informa-tion about the litigants, case type, processing time, and award amounts.
The Bureau of Justice Statistics is the statistical agency of the U.S. Department of Justice. Lawrence A. Greenfeld is director. This BJS Bulletin presents the third release of findings in a series of reports from the Civil Justice Survey of State Courts, 2001.
Thomas H. Cohen wrote this Bulletin under supervision of Steven K. Smith. Lynn Bauer provided statistical review. Data collection was supervised by the National Center for State Courts (NCSC); Paula Hannaford-Agor was the project director. Paula Hannaford-Agor and Neil LaFountain of the NCSC provided comments. Tom Hester, Devon Adams, and Tina Dorsey edited the report. Jayne Robinson prepared the report for final printing.
Note: Standard errors were calculated by using the jackknife method (JKN) generated by WESVAR PC. Award data were rounded to the nearest thousand.
22.8 mo 20.3 mo
0.6 mo 21.5 mo
to final verdict
Median months from filing
2,626,000 761,000 469,000 1,694,000 Punitive $663,000 $468,000 $49,000 $565,000 Final
Mean award to plaintiff winners
56,000 13,000 11,000 25,000 Punitive $32,000 $24,000 $2,000 $27,000 Final
Median award to plaintiff winners
53.5% 49.6%
1.0% 51.6%
with a plaintiff winner Percent of tort trials
2.2 1.6 0.1 1.9 Other 8.5 6.1 0.6 7.3 Bench trial 91.9% 89.7% 0.6% 90.8% Jury trial Percent decided by — 455 325 33 390
Other or unknown tort
61 29
8 45
False arrest, imprisonment
36 18 4 27 Conversion 126 71 14 99 Animal attack 123 66 14 95 Slander/libel 129 74 14 102 Professional malpractice 1,304 1,008 74 1,156 Medical malpractice 426 323 26 375 Intentional tort 179 137 10 158 Product liability 1,411 1,125 72 1,268 Premises liability 4,690 3,781 228 4,235 Automobile 8,677 7,219 366 7,948
Number of tort trials
Upper Lower error Estimate 95% - confidence interval standard One
Appendix A. Selected estimates, standard errors, and confidence intervals, civil trial 2001 survey
aIncludes bench and jury trials, trials with a directed verdict, judgments notwithstand-ing the verdict, and jury trials for defaulted defendants.
bIncludes only the central district of the Los Angeles County Superior Court. Los Angeles county suburban courts are not included. 17.9 28 Worcester, MA 18.2 88 Middlesex, MA 33.3 9 Honolulu, HI 34.3 70 Bexar, TX 34.8 253 Middlesex, NJ 35.4 144 Wayne, MI 36.4 22 Contra Costa, CA 36.6 41 Suffolk, MA 37.1 124 Essex, NJ 37.5 24 Essex, MA 37.9 145 Bergen, NJ 41.7 192 Allegheny, PA 41.8 340 Harris, TX 43.4 129 Los Angeles, CAb 44.3 255 New York, NY 45.8 107 Jefferson, KY 46.8 94 Oakland, MI 47.4 171 Orange, CA 48.8 43 Ventura, CA 50.0 26 Fresno, CA 50.8 65 San Bernardino, CA 51.2 84 Marion, IN 53.7 54 El Paso, TX 53.8 78 St. Louis, MO 54.3 230 Maricopa, AZ 54.5 123 Hennepin, MN 54.9 175 Dallas, TX 54.9 339 Cook, IL 55.0 151 Fairfax, VA 55.8 86 Hartford, CT 56.6 76 San Francisco, CA 56.6 500 Philadelphia, PA 57.1 77 Du Page, IL 57.4 94 Franklin, OH 58.4 178 Cuyahoga, OH 58.5 270 Dade, FL 59.3 27 Orange, FL 60.0 55 Fairfield, CT 60.7 56 Alameda, CA 60.9 46 Santa Clara, CA 64.1 117 King, WA 64.9 74 Pima, AZ 65.2 132 Palm Beach, FL 66.3 80 Mecklenburg, NC 69.0 87 Fulton, GA 69.1% 97 Milwaukee, WI winners Number County plaintiff Percent All tort trialsa
Appendix B. Tort trial winners in State courts by sampled counties, 2001
Note: Excludes cases with missing award amounts. Final amount awarded includes both compensatory (reduced for contributory negligence), costs and fees, and punitive damage awards. Award data were rounded to the nearest thousand.
--No cases recorded.
*Not a median but the actual amount awarded.
aIncludes only the central district of the Los Angeles County Superior Court. Los Angeles suburban courts are not included. 51,000 102,000 2 19,000 6,800,000 66 97 Milwaukee, WI 10,000 125,000 4 37,000 43,935,000 74 117 King, WA 14,000 942,000 10 12,000 8,437,000 83 151 Fairfax, VA 100,000 34,877,000 7 21,000 84,056,000 137 340 Harris, TX 53,000 607,000 4 11,000 2,595,000 29 54 El Paso, TX $750,000 $23,277,000 5 $19,000 $67,300,000 96 175 Dallas, TX 1,737,000 76,937,000 3 31,000 99,142,000 24 70 Bexar, TX 49,000 149,067,000 4 40,000 378,447,000 283 500 Philadelphia, PA 1,505,000 3,010,000 2 13,000 23,227,000 80 194 Allegheny, PA 6,000 4,320,000 8 15,000 20,805,000 52 94 Franklin, OH 55,000 572,000 6 16,000 20,034,000 103 178 Cuyahoga, OH 16,000 518,000 3 14,000 11,450,000 53 80 Mecklenburg, NC 700,000 7,850,000 3 300,000 145,434,000 111 256 New York, NY 17,000 55,000 3 57,000 15,406,000 87 253 Middlesex, NJ --41,000 13,304,000 45 124 Essex, NJ $86,000 $370,000 4 $27,000 $8,776,000 53 145 Bergen, NJ 5,000* 5,000 1 13,000 1,437,000 42 78 St. Louis, MO --29,000 7,096,000 55 123 Hennepin, MN --65,000 26,551,000 46 144 Wayne, MI --61,000 8,769,000 42 94 Oakland, MI --8,000 169,000 5 28 Worcester, MA 2,750,000* 2,750,000 1 51,000 5,600,000 15 41 Suffolk, MA --41,000 19,005,000 16 88 Middlesex, MA --42,000 10,720,000 9 24 Essex, MA 11,000 100,000 4 16,000 7,487,000 46 107 Jefferson, KY $5,000 $510,000 3 $13,000 $2,726,000 43 84 Marion, IN 150,000* 150,000 1 8,000 5,358,000 44 77 Du Page, IL 4,000 11,000 3 76,000 152,823,000 185 339 Cook, IL 500,000* 500,000 1 550,000 1,585,000 3 9 Honolulu, HI 53,000 171,000 4 6,000 6,313,000 60 87 Fulton, GA 2,500,000 5,000,000 2 42,000 21,642,000 84 132 Palm Beach, FL --78,000 9,272,000 16 27 Orange, FL 175,000 850,000 4 88,000 136,098,000 145 270 Dade, FL 150,000 629,000 3 18,000 8,049,000 48 86 Hartford, CT --18,000 2,134,000 33 55 Fairfield, CT $53,000 $105,000 2 $30,000 $1,677,000 21 43 Ventura, CA 250,000* 250,000 1 24,000 7,515,000 28 46 Santa Clara, CA --80,000 143,533,000 43 76 San Francisco, CA 14,000 3,032,000 4 135,000 38,852,000 33 65 San Bernardino, CA 50,000 235,000 5 42,000 101,670,000 81 171 Orange, CA 102,000 1,805,000 4 69,000 21,508,000 56 130 Los Angeles, CAa 50,000* 50,000 1 75,000 6,293,000 13 26 Fresno, CA 15,000* 15,000 1 108,000 2,766,000 8 22 Contra Costa, CA 350,000 951,000 3 64,000 47,809,000 33 56 Alameda, CA 6,000 28,000 5 26,000 5,405,000 48 74 Pima, AZ $10,000 $175,000 4 $14,000 $25,322,000 124 230 Maricopa, AZ award awards winners award awards award winners tort trials County Median Total of all of plaintiff Median Total of all of plaintiff number of Number Number Total
Punitive damages awarded to plaintiff winners Final amount awarded to plaintiff winners