• No results found

The behavior of electricity prices at the German intraday market

N/A
N/A
Protected

Academic year: 2021

Share "The behavior of electricity prices at the German intraday market"

Copied!
67
0
0

Loading.... (view fulltext now)

Full text

Figure

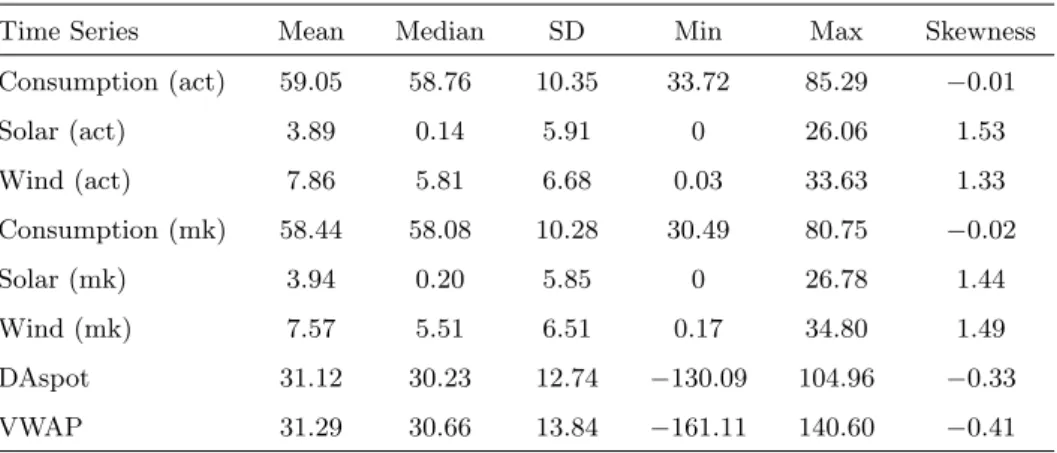
Table 1: Summary statistics. Actual and forecasted time series for consumption, solar and wind energy in GW
Figure 1: Total load consumption as accumulation of solar infeed (yellow), wind infeed (green) and residual laod (brown) on a day with low (left) and high (right) renewable infeed.
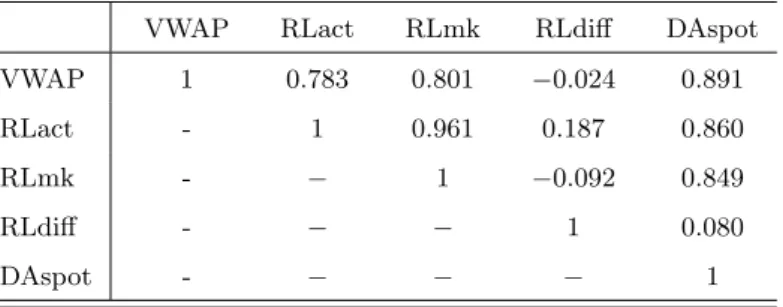
Table 2: Correlation of variables.
Figure 2: Daily VWAP curves from 2014-01-01 to 2016-12-31. Colors indicate price level.
+7

References

Related documents