Rowan University Rowan University
Rowan Digital Works
Rowan Digital Works
Theses and Dissertations9-29-2020
Evaluating the effectiveness of the pedestrian safety intervention
Evaluating the effectiveness of the pedestrian safety intervention
program: Behavioral and observational approach
program: Behavioral and observational approach
Deep Patel Rowan University
Follow this and additional works at: https://rdw.rowan.edu/etd Part of the Transportation Engineering Commons
Let us know how access to this document benefits you -
share your thoughts on our feedback form.
Recommended Citation Recommended Citation
Patel, Deep, "Evaluating the effectiveness of the pedestrian safety intervention program: Behavioral and observational approach" (2020). Theses and Dissertations. 2847.
https://rdw.rowan.edu/etd/2847
This Thesis is brought to you for free and open access by Rowan Digital Works. It has been accepted for inclusion in Theses and Dissertations by an authorized administrator of Rowan Digital Works. For more information, please contact [email protected].
EVALUATING THE EFFECTIVENESS OF THE PEDESTRIAN SAFETY INTERVENTION PROGRAM: BEHAVIORAL AND OBSERVATIONAL
APPROACH
By Deep Patel
A Thesis
Submitted to the
Department of Civil and Environmental Engineering College of Engineering
In partial fulfillment of the requirement For the degree of
Master of Science in Civil Engineering at
Rowan University August 24, 2020
Dedications
I would like to dedicate this work to my parents, my thesis chair professor Mohammad Jalayer, Ph.D., my friends, and all the people who have supported me in my academic career.
iv
Acknowledgments
I would like to thank my adviser Dr. Mohammad Jalayer, assistant professor in the department of civil and environmental engineering, for the opportunity he had offered me to work with him. His keen transportation understandings have assisted me for the developing both my career and me as a person. He has been a great advisor, and always worked with me to make this research complete on time.
I am grateful to all faculties that I had the pleasure to work with during this project. A special thanks to my thesis committee: Dr. Yusuf Mehtafrom Civil and Environmental Engineering Department, Rowan University andDr. Rouzbeh Nazari from Civil, Construction, and Environmental Engineering Department, the University of Alabama at Birmingham for their insightful comments, time, support, and assistance.
I would also like to thank my family and friends for their continuous support throughout my graduate career. Many thanks to all the students who worked alongside me and were behind the completion of this research. I wish them good luck in their future endeavors.
Finally, I would like to thank the North Jersey Transportation Planning Authority (NJTPA) for their continued support, assistance, and for research grant, which made this research possible. I would also like to extend a special thanks to Mr. Keith Hamas (NJTPA), Dr. Patrick Szary (CAIT, Rutgers), Mr. Thomas Hillman (CAIT, Rutgers), Mr. Christopher Wyce, (BCSR, Rutgers), and Mr. Nima Khaki (Rowan University) for their contribution in this project.
v
Abstract
Deep Patel
EVALUATING THE EFFECTIVENESS OF THE PEDESTRIAN SAFETY INTERVENTION PROGRAM: BEHAVIORAL AND OBSERVATIONAL
APPROACH 2018-2020
Mohammad Jalayer, Ph.D., Master of Science in Civil Engineering
Pedestrians are considered the most vulnerable road users. In the United States, according to the National Highway Traffic Safety Administration, there were 6,075 pedestrian fatalities and more than 85,000 pedestrian injuries as a result of traffic crashes in 2017. This study provides national and state pedestrian fatality statistics, a systematic literature review of pedestrian injury severity, as well as observational (video-based) and behavioral (survey-based) evaluation of the Street-Smart NJ pedestrian safety
intervention campaign. The Street-Smart NJ program is a public education, awareness, and behavioral change campaign program that aims to improve pedestrian safety by increasing awareness of pedestrian safety risks and improving compliance with
pedestrian and motorist laws. To evaluate this program, before and after campaign data was collected, and several statistical analyses were performed. In terms of the behavioral study, significant improvements were found in pedestrian behaviors (i.e., crossing against the signal or outside the crosswalk) and driver behaviors (e.g., drivers not stopping for pedestrians in crosswalk) after the Street-Smart NJ campaign was reported. The
observational study also showed significant improvements in pedestrian behaviors (i.e., crossing against the signal or outside the crosswalk) and driver behaviors (e.g., drivers not stopping for pedestrians in crosswalk) in most of the study communities following the Street-Smart NJ campaign.
vi Table of Contents Abstract ... v List of Figures ... ix List of Tables ... xi Chapter 1: Introduction ... 1 1.1 Background ... 1 1.2 Research Hypothesis ... 3 1.3 Objectives ... 3 1.4 Organization of Dissertation ... 4
Chapter 2: Pedestrian Injury Severity: A Review of Literature on Contributing Factors and Safety Countermeasures ... 6
2.1 Introduction ... 6
2.2 Discussion and Summary of Prior Works ... 13
2.2.1 Pedestrian Characteristics. ... 15
2.2.2 Driver Characteristics ... 15
2.2.3 Vehicle Characteristics. ... 16
2.2.4 Temporal or Environmental Characteristics. ... 16
2.2.5 Roadway Characteristics ... 17
2.3 Conclusion ... 19
Chapter 3: Evaluating the Effectiveness of Street Smart Safety Campaign: Observational Pedestrian Safety Analysis ... 21
3.1 Introduction ... 21
3.2 Method and Data ... 23
3.2.1 Site Selection. ... 23
vii
Table of Contents (Continued)
3.2.3 Study Locations. ... 29
3.2.4 Statistical Analysis ... 39
3.3 Results and Observations ... 41
Chapter 4: Evaluating the Effectiveness of the Street Smart New Jersey Campaign: Behavioral Pedestrian Safety Analysis ... 49
4.1 Introduction ... 49
4.2 Method and Data ... 50
4.2.1 Site Selection. ... 50
4.2.2 Survey Design. ... 52
4.2.3 Statistical Analysis. ... 55
4.3 Results and Discussion ... 57
4.3.1 Demographics ... 58
4.3.2 Mode Share. ... 59
4.3.3 Pedestrian Safety Observations. ... 60
4.3.4 Pedestrian Safety Behaviors. ... 62
4.3.5 Pedestrian Safety Knowledge. ... 64
4.3.6 Campaign Exposure. ... 66
4.3.7 Enforcement Awareness. ... 68
Chapter 5. Summary of Results and Future Work ... 71
5.1 Summary of Results ... 71
5.1.1 Observational Study. ... 71
5.1.2 Behavioral Study. ... 72
5.2 Future Work ... 73
viii
Table of Contents (Continued)
Appendix A: Hourly Observed Non-Compliance for Each Study Locations ... 80 Appendix B: Survey Questionnaire ... 88
ix
List of Figures
Figure Page
Figure 1. Total crash fatalities in the United States (2000-2018) ... 2
Figure 2. Pedestrian fatalities in New Jersey (2000-2018) ... 2
Figure 3. Graphical Messages Used in the Street Smart NJ Campaign to Change Driver and Pedestrian Behaviors. (NJTPA, 2019) ... 22
Figure 4. A Map of Observational Study Locations ... 24
Figure 5. Unsafe Crossing and Crossing against the Signal (Proxy 1) ... 26
Figure 6. Turning Vehicle Fails to Stop for Pedestrian (Proxy 2) ... 26
Figure 7. Failure to Stop before Right Turn at Red Signal or Stop Sign (Proxy 3) ... 27
Figure 8. Running Red Light Signal or Stop Sign (Proxy 4) ... 28
Figure 9. Intersection of Queen Anne Road and State Street and Camera Views in Teaneck, NJ... 30
Figure 10. Intersection of Memorial Drive and Springwood Avenue and Camera Views in Asbury Park, NJ ... 32
Figure 11. Intersection of Midland Avenue and Van Winkle Avenue and Camera Views in Garfield, NJ ... 33
Figure 12. Intersection of Raymond Boulevard and Mulberry Street and Camera Views in Newark, NJ ... 34
Figure 13. Intersection of Speedwell Avenue and Franklin Road and Camera Views in Morris Plains, NJ ... 35
Figure 14. Intersection of Nassau Street and Vandeventer Avenue and Camera Views in Princeton, NJ ... 36
Figure 15. Intersection of Glen Road onto Park Avenue and Camera Views in Rutherford, NJ ... 37
Figure 16. Intersection of Main Street and Eleanor Place and Camera Views in Woodbridge, NJ ... 38
Figure 17. Messages used in the Street Smart NJ campaign (NJTPA, 2019) ... 50
x
List of Figures (Continued)
Figure Page
Figure 19. Sample of flyer used in direct mail advertising method ... 52 Figure 20. Pre- and post-campaign response comparison for Pedestrian Safety
Observation (Pedestrian) ... 61 Figure 21. Pre- and post-campaign response comparison for Pedestrian Safety
Observation (Driver) ... 62 Figure 22. Pre- and post-campaign response comparison for Pedestrian Safety
Self-Behavior (Pedestrian)... 63 Figure 23. Pre- and post-campaign response comparison for Pedestrian Safety
xi
List of Tables
Table Page
Table 1. Studies identifying significant factors contributing to pedestrian injury severity
...14
Table 2. Pre- and Post-Campaign Data Collection Sites ...29
Table 3. Change in Counts and Rates of Non-Compliant Behaviors from the Pre- to Post-Campaign ...43
Table 4. Change in Counts and Rates of Non-Compliant Behaviors from the Pre- to Post-Campaign ...45
Table 5. Statistically Significant Change in Rate of Non-Compliant Behaviors Based on Intersection Traffic Control ...46
Table 6. Change in Rates of Non-Compliant Behaviors from the Pre- to Post-Campaign for All Intersections ...47
Table 7. Example of Required Sample Size for Different Confidence Intervals and Margins of Errors ...55
Table 8. Survey Responses by Recruitment Method ...58
Table 9. Survey Response for Transportation Mode ...60
Table 10. Results of Pedestrian Safety Observation ...61
Table 11. Results of Pedestrian Safety Self-Behavior Participants ...63
Table 12. Results of Knowledge of Pedestrian Traffic Signals ...65
Table 13. Results of Knowledge of Pedestrian Safety Law Enforcements ...66
Table 14. Results of Exposure to Highway Safety Campaign Messaging ...67
Table 15. Results of Exposure to Street Smart NJ Campaign Messages ...68
Table 16. Results of Exposure to Police Efforts to Enforce Pedestrian Safety Law Results of Exposure to Police Efforts to Enforce Pedestrian Safety Law ...69
Table 17. Results of Self-Reported Opinion about the Police Efforts to Enforce Pedestrian Safety Laws ...70
Table 18.Results of Self-Reported Opinion about the Police Efforts to Enforce Drivers Safety Laws ...70
1
Chapter 1 Introduction 1.1 Background
A person walking for any distance as part of their journey is considered a pedestrian (WHO, 2010). According to the Bureau of Transportation Statistics, 35 percent of the U.S. population takes walking trips as part of their daily routine. (BOTS, 2018). Moreover, based on the National Household Travel Survey (NHTS), in 2017, approximately 10.5 percent out of 371 billion annual person trips in the United States were walking trips (NHTS, 2017). In detail, 47.5 percent of walking trips were for recreational and social purposes, 29.5 percent were for shopping and errands, 10.6 percent were for church and school visits, and the remaining 13.4 percent were for other miscellaneous tasks (USDOT, 2018).
Pedestrian deaths on roadways have been continually increasing across the nation, raising concerns among the government and citizens alike. According to the National Highway Traffic Safety Administration (NHTSA) statistics for 2017, 6,075
pedestrians were killed, and more than 85,000 were injured. (NHTSA, 2017). The report also stated that, on average, a pedestrian was killed every two hours and injured every eight minutes in traffic crashes. Figure 1 illustrates the trend of pedestrian fatalities in the United States for the years 2000-2018. Overall, traffic fatality rates have declined over the last two decades, while the proportion of pedestrian fatalities has increased (GHSA, 2018).As a result, pedestrians are more likely than other road users to incur fatal and severe injuries.
2
Figure 1. Total crash fatalities in the United States (2000-2018)
Motor vehicle crashes involving pedestrians are also a major roadway safety concern in New Jersey. New Jersey ranks second in the nation for the percentage of pedestrian fatalities among all traffic fatalities, with nearly 30 percent of all fatalities associated with pedestrian crashes (NHTSA, 2017). Figure 2 depicts the trends of pedestrian fatalities in the state of New Jersey (from 2000 to 2018).
3
Furthermore, with the increasing usage of automobiles in the upcoming years, pedestrians and other non-motorized road users are expected to become more
vulnerable to traffic crashes (Zegeer and Bushell, 2012). Over the past several years, many safety countermeasures have been developed and implemented by state
departments of transportation and local agencies across the nation, with the aim of reducing the frequency and severity of pedestrian-related crashes. These
countermeasures include implementation of the 4Es (Engineering, Education, Enforcement, and Emergency Response). In response to the high rate of pedestrian fatalities in New Jersey, the Federal Highway Administration (FHWA) designated New Jersey a pedestrian safety focus state. The North Jersey Transportation and Planning Authority (NJTPA) developed and started a Street Smart NJ campaign in 2013. The main goal of the Street Smart NJ public education campaign, as an educational safety program, is to enhance pedestrian safety by increasing awareness of safety risks and improving compliance with pedestrian and motorist laws.
1.2 Research Hypothesis
A Street Smart NJ pedestrian safety campaign can be a useful educational and awareness methodology to improve non-compliance behaviors of pedestrians and drivers at the campaign locations
1.3 Objectives
The primary objective of this study is to evaluate the effectiveness of the pedestrian safety educational campaign in reducing risky behaviors among drivers and pedestrians. To achieve this goal, observational and behavioral studies were conducted to
4
gauge the effectiveness of the program with respect to behavioral changes. A web-based survey was designed and distributed to eight communities (i.e., Asbury Park, Morris Plains, Garfield, Newark, Princeton, Rutherford, Teaneck, and Woodbridge) across New Jersey. Video data also was captured at multiple intersections to record the behaviors of both drivers and pedestrians. Furthermore, several statistical analyses were also
performed to identify any statistically significant changes before and after the Street Smart NJ campaign.
1.4 Organization of Dissertation
This study is organized into five chapters, as follows:
Chapter 2 provides a systematic literature review on identifying the contributing factors to pedestrian crashes and appropriate safety countermeasures. A brief discussion describing the novelty of the study, data year, and region specifics, methodology, and the results are provided in this chapter. Further, to better understand the impact of
confounding contributing factors on pedestrian injury severity, the study clustered the factors into several groups such as pedestrian characteristics, driver characteristics, vehicle characteristics, environmental and temporal characteristics, and roadway
characteristics, among others. This review provides valuable information for practitioners and researchers to understand the factors impacting pedestrian injuries.
Chapter 3 reports the outcomes of the conducted observational study in eight New Jersey communities (i.e., Asbury Park, Morris Plains, Garfield, Newark, Princeton, Rutherford, Teaneck, and Woodbridge) to gauge the effectiveness of the Street Smart NJ pedestrian safety campaign by comparing the rates of non-compliant pedestrian and
5
driver behaviors before and after the campaign. The studied non-compliant behaviors include unsafe crossing and crossing against a signal, failing to stop before turning at a red light or stop sign, failing to stop for pedestrians when turning, and running the red-light signal or stop sign.
Chapter 4 discusses the results of pre- and post-campaign surveys, which were conducted in seven New Jersey communities (i.e., Asbury Park, Garfield, Morris Plains, Newark, Princeton, Rutherford, and Woodbridge). The survey evaluates the success of the campaign in changing behaviors among both pedestrians and drivers, how the campaign has shaped public awareness and attitudes about pedestrian safety, and which campaign activities are most effective. The effectiveness of the campaign was explored by comparing the pre- and post-campaign data collected by various methods, including in-person flyer distribution, direct mail advertisements, social media
advertisements, and intercept surveys using tablet devices in 2018-2019.
Chapter 5 summarizes the findings of the observation and behavioral studies conducted for gauging the effectiveness of the Street Smart NJ campaign. Furthermore, this chapter acknowledges limitations and makes recommendations for future study.
6
Chapter 2
Pedestrian Injury Severity: A Review of Literature on Contributing Factors and Safety Countermeasures
2.1 Introduction
Motor vehicle crashes involving pedestrians are a major roadway safety concern in the United States and across the globe. While overall traffic fatality rates have
declined over the last two decades, the proportion of pedestrian crashes has substantially increased over the past few years (IIHS, 2018). According to the Governors Highway Safety Association (GHSA), 6,227 pedestrian fatalities occurred in the United States in 2018. Compared to 2017, a four percent increase in pedestrian deaths was reported in the United States (GHSA, 2018). Over the past years, numerous studies have been conducted to identify the factors associated with pedestrian crashes and develop safety
countermeasures.
Zajac and Ivan (2003) analyzed the effect of area type and roadway conditions on the injury severity of pedestrian crashes. Ordered probit model analysis was performed on the pedestrian crash data from Connecticut for the years 1989 to 1998. The results indicated that older pedestrians (64 years of age and older), pedestrians under the
influence of alcohol, drivers under the influence of alcohol, road width, and vehicle type significantly impacted the pedestrian injury severity. Lee and Abdel-Aty (2005)
examined the vehicle-pedestrian crashes occurring at intersections in Florida for the years 1999-2002, using an ordered probit model. The results of this study indicated several factors that contributed to the injury severity of pedestrians, including older pedestrians,
7
pedestrians under the influence of alcohol, adverse weather, dark lighting conditions, and large vehicles.
Siddiqui et al. (2006) examined the impact of light conditions and crossing
locations, along with other variables, on the severity of pedestrian injuries in Florida. The study showed that pedestrian crashes at midblock locations during dark light conditions without streetlights increases the odds of fatal injuries. Additionally, the study also determined that the odds of fatal injuries to elderly pedestrians (64 years and above) is 68 percent higher than other age groups, 60 percent higher when struck by a driver driving under the influence of alcohol, 40 percent higher for pedestrians under the influence of alcohol than sober pedestrians, and 42 percent higher for foggy weather when keeping other factors constant. Eluru et al. (2008) conducted an injury severity analysis of
pedestrian crashes using a mixed generalized ordered response logit model. The findings suggested that older-aged pedestrians, the higher speed limit (greater than 50 mph) on the roadway, intersections without traffic signals, and dark condition (12:00 a.m. – 6:00 a.m.) significantly contributed to the injury severity levels.
Taking advantage of the mixed logit model, Kim et al. (2010) analyzed pedestrian injury severity using the police-reported crash data from North Carolina for the years 1997 to 2000. The results indicated that increasing pedestrian age, vehicle size, roadway speed, and driving under the influence of alcohol increase the probability of fatal injuries in pedestrians. Maybury et al. (2010) analyzed five years (2002-2006) of motor vehicle crashes across the U.S. involving pedestrians from the National Trauma Data Bank. Multivariable logistic regression was used to determine the effects of various factors influencing pedestrian injury severity. The results demonstrated that such factors as race
8
played a role (i.e., African Americans and Hispanics had higher odds of mortality
compared to other race categories). Moudon et al. (2011) used pedestrian-motor-vehicles collision data (2000-2004) for the city streets and state routes in Kings County,
Washington, to evaluate pedestrian injury severity. Binary logistic regression was performed to predict the risk of pedestrian fatal and severe injuries. Younger (5 years or fewer) and older-aged (more than 65 years) pedestrians, the involvement of more than two pedestrians in the crash, vehicle moving in straight direction, and driver under the influence of alcohol were the significant factors contributing to the pedestrian injury severity.
Rifaat et al. (2011) assessed the effect of street patterns on the severity of pedestrian-related crashes. A multinomial logit model was developed using three years (2003-2005) of pedestrian crashes in the city of Calgary, Canada. The study showed that the modern loops and lollipops designs increase injury severity among vulnerable road users, including pedestrians. Tarko and Azam (2011) performed an ordered probit model analysis of factors influencing pedestrian injury severity by linking crash data and medical records. According to this study, factors such as male pedestrians, older
pedestrians, rural roads, and mid-block crossing increase the likelihood of severe crashes. Jang et al. (2013) examined the severity of pedestrian-involved crashes in the city of San Francisco using an ordered probit model. The finding of this study demonstrated that young and elderly pedestrians, consumption of alcohol by pedestrian and drivers, using a cell phone while crossing, large vehicles (pickups, trucks, and buses), nighttime
conditions, rainy weather conditions, and weekends were the noteworthy factors increasing the severity of pedestrian injuries.
9
Mohammed et al. (2013) conducted a pedestrian injury severity analysis using two datasets (Montreal City, Canada, from 2003 to 2006, and New York City, from 2002 to 2006). The authors used ordered probit and multinomial logit models to conduct the analysis. The results of the study demonstrated that dark lighting conditions, arterials, prevalence of mixed land use, and heavy vehicles increase the chance of fatal injuries. Tefft (2013) predicted severe injuries and fatalities for pedestrian-vehicle crashes using a multivariant logit regression. It should be noted that the authors added the weights to the crash data to minimize the oversampling of the killed or severely injured pedestrians. With respect to impact speed, findings showed that the risk of severe or fatal injury is lower at low speed (i.e., below 20 mph), and increases with the increase in speed. Furthermore, older pedestrians have a higher risk of injury severity compared to young (below15 years of age) pedestrians. Islan and Jones (2014) examined the injury severity of crashes in which pedestrians were at fault. A mixed logit model was performed on the police reported crash database (2006-2010) for the state of Alabama. The results show that pedestrians below 12 years of age, two-lane roadways, and dark lighting conditions were the significant factors that contributed to the severity of pedestrian injuries for both rural and urban locations. Das and Sun (2015) used the multiple correspondence analysis method to determine the significant contributing factors and their relationship with respect to pedestrian injury severity, using eight years (2004-2011) of vehicle-pedestrian crashes in Louisiana. According to the results, pedestrian deaths were most likely to occur on two-lane roadways and at night with no lighting.
Haleem et al. (2015) used three years (2008-2010) of pedestrian crash data from the state of Florida to identify the significant factors affecting the pedestrian crash injury
10
severity considering intersection traffic control (signalized and unsignalized
intersections). Using a mixed logit model, the authors confirmed that middle-aged and elderly pedestrians, vehicle type (i.e., vans), dark lighting conditions, a pedestrian walking along the roadway, and a high speed limit significantly contributed to the pedestrian injury severity at unsignalized intersections. With respect to signalized intersections, rainy weather, elderly pedestrians, high annual average daily traffic, high speed limit, dark lighting conditions, and a high percentage of trucks were associated with more severe crashes. Khattak and Tung (2015) investigated the impact of several factors on the severity of pedestrian injuries reported in highway-rail grade crossings between 2007 and 2010. Ordered probit analysis predicted variables that affect the severity of pedestrian injuries, including female pedestrians, adverse weather conditions, and no flashing light signals.
Pour-Rouholamin and Zhou (2016) examined the confounding factors that influence the injury severity of pedestrians in single-pedestrian and single-vehicle crashes. The study conducted ordered-response models using four years (2010-2013) of pedestrian crash data from the state of Illinois. According to the results, factors such as older pedestrian, adult drivers, pedestrians not wearing color-contrasting clothes,
nighttime conditions, drivers under the influence of alcohol, multilane highways, divided highways, and heavy vehicles are associated with the probability of severe injuries. Guo et al. (2017) assessed the effect of neighborhood environment and demographics on pedestrian injury severity. A mixed-effects logistic model was developed to examine the crashes, from 2011 to 2014, involving pedestrians in Florida. Findings of the study showed that low-income areas have more unsafe behaviors, resulting in increased
11
pedestrian injury severity. Additionally, factors that increased the probability of
sustaining severe injuries were as follows: older pedestrians by 0.09, intersections with no light by 0.17, distracted drivers by 0.13, at pedestrian crossings by 0.11, pedestrians under the influence of alcohol by 0.69, no traffic light by 0.07.
Uddin and Ahmed (2018) examined the contributing factors affecting the pedestrian injury severity in Ohio. Fixed and random parameter ordered probit models were performed on the Highway Safety Information System (HSIS) database from 2009 to 2013. Outcomes of the study stated that older pedestrians (65 years and above), young drivers (below 24 years of age), vehicle type (i.e., trucks), dark-unlighted roadways, speed limit above 40 mph, six-lane roadways, and drivers under the influence of alcohol increased the severity of pedestrian injuries. In another study, Chen and Fan (2019) developed a multinomial logit model to explore and classify the important contributing factors associated with pedestrian-vehicle crash injury severity. The study used the North Carolina crash data (between 2005 and 2012) obtained from the HSIS database. The finding of the marginal effect demonstrated significant factors that increased the
likelihood of fatal injuries for middle-aged and older pedestrians by 0.06 and 0.22, during the weekend by 0.02, for vehicle type (i.e., heavy trucks) by 0.22, at curve roadway sections by 0.03, higher speed limit by 0.12, during the dark- lighting conditions by 0.09 and during dusk and dawn lighting conditions by 0.10. Liu et al. (2019) introduced an integrated spatiotemporal modeling tactic to separate the pedestrian injury severity from other motor vehicle crashes. A geographically- and temporally-weighted ordinal logistic regression was performed on pedestrian-motor vehicle crash data (2007-2014) in North Carolina. The results showed that an increase in the injury severity of pedestrians was
12
significantly influenced by factors including pedestrians under the influence of alcohol, pedestrian’s age, driver’s age (teenagers 20-year-old or younger and adults between 20 to 30 years age), driver’s gender, the involvement of alcohol in drivers, no streetlights, vehicle type (SUV, bus or truck), and time of crashes.
Mokhtarimousavi (2019) analyzed pedestrian-involved crashes in California using five years (2010 to 2014) of crashes. To estimate the factors significantly impacting the pedestrian injury severity during the daytime and nighttime conditions, a support vector machine (SVM) and multinomial logit (MNL) estimation was used and compared. For the daytime condition, parked vehicles have 0.073 lower probability for fatal injuries, dusk-dawn weather conditions increased the injury severity by 0.053, rural freeways showed 0.110 higher probability of causing fatal injury, and drivers under the influence of alcohol during dark with no street light condition significantly increased the property damage only crashes (PDO). While for the nighttime condition, rainy weather decreases the probability of severe injuries by 0.352, head-on collision estimated a decrease in chances of fatal crash by 0.132, and pedestrian crossing a crosswalk at an intersection showed an increase in injury severity by 0.064. Sun et al. (2019) used 10 years (2006-2015) of the Louisiana Department of Transportation and Development (LADOTD) highway crash data to identify the main factors in pedestrian crash severity. This study segmentized the pedestrian crashes with the Latent Class Clusters (LLC) model and then used the multinomial logit (MNL) models to determine the contributing factors. Results of this study showed that older pedestrians, alcohol and drug involvement in pedestrians, adverse weather conditions, winter season, the timing between 6 p.m. and midnight, the involvement of high speed, rural area, dark-lighted condition, dark-unlighted condition,
13
and non-intersection location significantly increase the likelihood of pedestrian injury severity.
2.2 Discussion and Summary of Prior Works
To better understand factors influencing pedestrian injury severity, this section summarizes the outcomes of the selected studies by clustering the significant factors observed. Table 1. shows the list of the papers and the characteristics that showed a significant impact on pedestrian injury severity. It should be noted that the significance results of all the characteristics are highly influenced by raw data and the analysis method performed, depending on the scope of their work.
14
Table 1
Studies identifying significant factors contributing to pedestrian injury severity
(Note: “X” denotes the significant factors identified by each study with respect to their objective and raw data set)
Studies Year Pedestrian Characteristics Driver Characteristics Vehicle Characteristics Temporal and Environmental Characteristics Roadway Characteristics
Zajac and Ivan 2003 X X - - -
Lee and Abdel-Aty 2005 X - - X -
Siddiqui et al. 2006 X X - X - Eluru et al. 2008 X - - X X Kim et al. 2008 X X X X - Kim et al. 2010 X X X - - Maybury et al. 2010 X - - - - Kwigizile et al. 2011 - - - X - Moudon et al. 2011 X X X - -
Tarko and Azam 2011 X - - - X
Zahabi et al. 2011 - X X - -
Dai 2012 X - - X -
Abdul Aziz et al. 2013 - - - X -
Jang et al. 2013 X X X X -
Mohamed et al. 2013 - - X X X
Tefft 2013 X - - - X
Islam and Jones 2014 - - - - X
Yasmin et al. 2014 - - - X -
Das and sun 2015 - - - X X
Haleem et al. 2015 X - X X X
Khattak and Tung 2015 - - - X -
Pour-Rouholamin and
Zhou 2016 X X X X -
Guo et al. 2017 X X - - X
Salon and McLntyre 2018 - X - - -
Uddin and Ahmed 2018 X X X - X
Chen and Fan 2019 X - X X X
Liu et al. 2019 X X X - -
Mokhtarimousavi 2019 - X X X -
15
2.2.1 Pedestrian characteristics. Factors such as pedestrian age, gender, and the influence of alcohol are the factors significantly contributing to pedestrian injury severity. Older pedestrians (over age 65 years) increase the probability of fatal or severe injuries in motor vehicle crashes involving pedestrians (Haleem et al., 2015; Pour-Rouholamin and Zhou, 2016; Tefft, 2013; Tarko and Azam, 2011; Moudon et al., 2011; Jang et al., 2013; Sun et al., 2019; Chen and Fan, 2019; Uddin and Ahmed, 2018; Eluru et al., 2018; Siddiqui et al., 2006; Lee and Abdel-Aty, 2005; Zajac and Ivan, 2003; Kim et al., 2010; Kim et al., 2008; Guo et al.). Numerous studies (Jang et al., 2013; Sun et al., 2019; Siddiqui et al., 2006; Lee and Abdel-Aty, 2005; Liu et al., 2019; Zajac and Ivan, 2003) have stated that the likelihood of injury severity increases for the pedestrian under the influence of alcohol or drugs. Furthermore, some studies (Tarko and Azam, 2011; Khttak and Tung, 2015) have identified gender as a significant factor in pedestrian injury
severity.
2.2.2 Driver characteristics. Factors such as driver’s age, driver’s gender, driver’s disability, and driving under the influence of alcohol were the significant factors associated with the pedestrian crashes. Several studies (Pour-Rouholamin and Zhou, 2016; Moudon et al., 2011; Jang et al., 2013; Mokhtarimousavi, 2019; Liu et al., 2019; Sun et al., 2019; Uddin and Ahmed, 2018; Salon and Mclntyre, 2018; Kim et al., 2008; Siddiqui et al., 2006; Kim et al., 2010; Kwingzile et al., 2011; Zajac and Ivan, 2003; Guo et al., 2017) have indicated that the drivers’ consumption of alcohol has a significant impact on the injury severity level of pedestrians. A study conducted by Siddiqui et al. (2006) reported that crashes in which drivers have physical disabilities significantly impact pedestrian injury severity. This may be due to longer reaction time requirements
16
(Siddiqui et al., 2006). Pour-Rouholamin and Zhou (2016) investigated the effect of drivers' age on pedestrian injury severity. The results showed that adult drivers (younger than 24 years) resulted in severe injuries to pedestrians, and older drivers (65 years old and above) are prone to causing in no/possible injuries. This finding is also consistent with the studies of Uddin and Ahmed (2018) and Kim et al. (2008).
2.2.3 Vehicle characteristics.The type of vehicle was identified as a significant contributing factor in pedestrian injury severity. A number of studies (Haleem et al.,2015; Jang et al., 2013; Mokhtarimousavi 2019; Pour-Rouholamin and Zhou, 2016; Liu et al., 2019; Chen and Fan, 2019; Mohammed et al., 2013; Uddin and Ahmed, 2018; Kim et al., 2010; and Kim et al., 2008) depicted that pedestrians struck by trucks or buses have a higher probability of fatal and severe injury. In terms of the vehicle movement, several studies showed that a vehicle going in a straight direction has a significant influence on the injury severity of pedestrians during the crash (Zahabi et al., 2011; Moudon et al., 2011; Jang et al., 2013).
2.2.4 Temporal or environmental characteristics.Factors like seasons, weekdays or weekends, lighting conditions, weather conditions, and time of day were determined as significant factors involved in pedestrian crashes. In terms of weather, the majority of studies stated that adverse weather condition increases the severity level of pedestrian injuries (Mokhtarimousavi, 2019; Haleem et al., 2015; Jang et al., 2013; Yasmin et al., 2014; Khattak and Tung, 2015; Sun et al., 2019; Siddiqui et al., 2006; Lee and Abdel-Aty, 2005). Similarly, various studies also stated that dark lighting conditions increase the likelihood of fatal or severe pedestrian injuries (Haleem et al., 2015;
17
et al., 2019; Chen and Fan, 2019; Kim et al., 2008; Siddiqui et al., 2006; Lee and Abdel-Aty, 2005). Further, in terms of the season, a study conducted by Sun et al. (2019) reported that the likelihood of having fatal and severe injuries during the winter is higher compared to the rest of the year. Similarly, another study reported that during the spring season, there are fewer chances of higher injury severity for pedestrians (Yasmin et al., 2014). Per the weekdays and weekends as a significant contributing factor, the results of several studies (Eulur et al., 2008; Jang et al., 2013; Chen and Fan, 2019; Kwigizile et al., 2011) showed that on weekends, the probability of fatal injury increases compared to weekdays. With respect to the time of day, which is generally categorized as daytime (6:00 a.m. to 6:00 p.m.), evening (6 p.m. to 12:00 a.m.), and nighttime (12:00 a.m. to 6:00 a.m.), the results showed that nighttime conditions significantly increased the pedestrian injury severity (Eluru et al., 2008; Jang et al., 2013; Das and Sun, 2015; Kim et al., 2008; Aziz et al., 2013; Pour-Rouholamin and Zhou 2016).
2.2.5 Roadway characteristics.In terms of the roadway characteristics, several attributes, such as posted speed limit, roadway type, roadway functional class, surface condition, and road width were observed as significant factors contributing to pedestrian crashes. The results showed that road segments with a higher speed limit increased the probability of pedestrian injury severity level (Haleem et al., 2015; Tefft, 2013; Chen and Fan, 2019; Uddin and Ahmed, 2018; Eluru et al., 2008; Guo et al., 2017).
It should be noted that, in addition to the above-categorized factors, there are several other factors, such as traffic volume, land use mixtures, street patterns, traffic control devices, visibility, pedestrian location, and crash type that significantly impact pedestrian injury severity.
18
An extensive literature review was also carried out to explore the studies that evaluated the factors affecting pedestrian behaviors and evaluating pedestrian safety programs. Zhao et al. (2019) explored the pedestrian crossing behavior at an
un-signalized crosswalk, considering gap size, crossing distance, platoon size, waiting time, traffic volume, and position of pedestrians. The results showed that gap size and crossing distance profoundly influenced pedestrian crossing behavior. Oxley et al. (2005)
examined the relationship between the age of pedestrians and the risk of their crossing decisions. Pedestrians aged 75 years and older made more made dangerous crossing decisions than the other age groups.
Several other studies have also focused on countermeasure development to mitigate risky behaviors. Although several engineering countermeasures (e.g., traffic signs, traffic signal controls, pavement markings, and roadway geometry) can be employed to enhance pedestrian safety, the behavior of pedestrians and drivers plays a vital role in mitigating crash risk (Lin et al., 2019; Shi et al., 2019; Chen and Fan, 2019; Kang 2019). Educational programs and public outreach efforts provide an opportunity for motorists and pedestrians to address observed or documented high-risk behaviors, such as speeding and improper crossing. Zhang et al. (2013) explored the effectiveness of a university-based pedestrian safety education program, called “USF Bull Walk and Bike campaign,” by surveying pedestrians, drivers, and bicyclists. The outcome showed that drivers’ yielding behavior increased from 6.6 to 12.8 percent following this program. In another study, Twisk et al. (2014) highlighted the effectiveness of a road safety education (RSE) program based on self-reported behavior of young teenagers. The results
19
Another study by Hoye and Laureshyn (2019) investigated the effect of the “SeeMe campaign” on pedestrian and motorist behavior in Norway. The results revealed a 14 percent increase in the motorist yielding behavior at pedestrian crossings.
2.3 Conclusion
Contributing factors influencing the pedestrian injuries severity have been explored with a systematic literature review that focuses only on the 21st - century
publications that used raw data from the regions of the United States and Canada. The results of this study draw attention to the majorities of factors that significantly impacted the severity level of pedestrian injuries. Factors such as pedestrian age, pedestrian under the influence of alcohol, a driver under the influence of alcohol, type of vehicle, weather conditions, lighting conditions, and roadway speed limit all affected pedestrian injury severity. Additionally, several studies have recommended implementing the 4Es of safety (Engineering, Enforcement, Education, and Emergency response) to reduce the severity of pedestrian injuries.
Additionally, the literature review also shows that providing education, outreach campaigns, and training are all essential strategies in increasing motorist and pedestrian awareness and behavior. To be specific, programs on speeding awareness, such as “Click it or Ticket” and “Drive Sober or Get Pulled Over” were remarkably effective in
changing driver behaviors (NHTSA, 2019). However numerous bicycle and pedestrian safety campaigns that have been conducted in New Mexico, Florida, Maine,
20
study tries to address and provide a method for evaluating pedestrian safety campaigns, focusing on education and enforcement countermeasures.
21
Chapter 3
Evaluating the Effectiveness of Street Smart Safety Campaign: Observational Pedestrian Safety Analysis
3.1 Introduction
Motor vehicle crashes involving pedestrians are a major roadway safety concern across the United States. While the overall traffic fatality rates have declined over the last two decades, the proportion of pedestrian fatalities has increased, resulting in pedestrians remaining the most vulnerable roadway users (GHSA, 2019). As a result, the Federal Highway Administration (FHWA) designated New Jersey a pedestrian focus state and Newark a pedestrian safety focus city. In response, the North Jersey Transportation Planning Authority (NJTPA) collaborated with public, private, and non-profit partners in 2013 to form a “Street Smart NJ” program that was piloted in five communities. The Street Smart NJ program is a public education, awareness, and behavioral change campaign program that was built on initial successes and expanded to more than 140 municipalities throughout the state with the help of a growing network of partners, including NJ TRANSIT, New Jersey Division of Highway Traffic Safety, and the Transportation Management Associations (NJTPA, 2019). The ultimate goal of this program is to improve pedestrian safety by increasing awareness of pedestrian safety risks and improving compliance with pedestrian and motorist laws. It should be noted that the NJTPA also periodically evaluates the effectiveness of the Street Smart NJ campaign to analyze the behavioral change and awareness of pedestrian safety law intended by the campaign. By using messages such as “Obey the Speed Limit,” “Stop for
22
Pedestrians,” “Use Crosswalk,” “Heads Up, Phones Down,” and “Wait for the Walk,” the campaign uses public outreach to educate motorists and pedestrians on the importance of obeying traffic rules. The safety campaign promotes educational materials through paid advertising, earned media, signage, and social media.
Figure 3. Graphical Messages Used in the Street Smart NJ Campaign to Change Driver and Pedestrian Behaviors. (NJTPA, 2019)
23
This chapter provides the results of an observational study to compare the rates of unsafe pedestrian and driver behaviors before and after the NJTPA pedestrian safety education and enforcement campaign, called “Street Smart NJ,” in several communities across the state of New Jersey. The behaviors, including unsafe crossing and crossing against a signal, failing to stop for pedestrians when turning, failing to stop before turning at a red light or stop sign, and running the red light or stop sign were compared and measured in eight communities in 2018-2019.
3.2 Method and Data
3.2.1 Site selection. The goal of selecting sites for the Street Smart NJ campaign and observational study was to identify locations that could benefit from an improvement in driver and pedestrian behavior and may exhibit measurable
changes as a result of the campaign. Historical crash data is one of the key criteria for site selection, since locations with a high number of previous crashes are likely to continue to have the highest number of future pedestrian crashes, in the absence of intervention. Additional considerations for site selection may include different community types (e.g., urban and suburban) and diverse geographic coverage of the region. It was also essential for locations to have large enough traffic and pedestrian flow in order to provide sufficient data for comparison, and the communities had to express an interest in participating in the Street Smart NJ campaign. Notably, the state’s eight Transportation Management Associations (TMA’s) are critical partners in selecting and leading local campaigns. In this study, eight geographically and
demographically diverse communities in northern, central, and southern New Jersey were selected for further analysis. These campaign communities include Teaneck, Asbury
24
Park, Garfield, Morris Plains, Newark, Princeton, Rutherford, and Woodbridge as shown in Figure 5.
Figure 4. A Map of Observational Study Locations
3.2.2 Data collection. The primary objective of the observational study was to determine if the campaign is effective in mitigating non-compliant behaviors performed
25
by drivers and pedestrians, resulting in enhanced safety for pedestrians at the study locations. Given the fact that crashes are not frequent events, it is more effective to observe the occurrence of risky non-compliant behaviors by motorists and pedestrians which can serve as proxy measures for safety. Safety improvement, by proxy, happens when there is a reduction in the occurrence of non-compliant behaviors. Therefore, the data collection efforts include conducting observations at the study locations to document the behaviors of pedestrians and drivers+ both pre- and post-campaign. This requires identifying the necessary data type, the field collection method, and how to process the raw data to provide a useful dataset for analysis purposes. Conducting observational evaluations for each proxy measure requires two types of data to be collected: 1) counts of non-compliant behavior event occurrences, and 2) total counts of pedestrians or drivers exposed at the intersection who had a chance either to comply with or violate the traffic rules. Using these two types of data, it is possible to measure a rate of non-compliance at each location for each proxy behavior of interest. This rate is very important for
comparing the pre- and post-campaign datasets to identify if there is a statistically significant change in driver and pedestrian behavior. In this study, four core proxy behaviors to measure the impact of its Street Smart NJ campaign messaging were considered. These proxy behaviors allowed the evaluators to observe the non-compliant behavior and determine the relevant measure of exposure in each substantive area of focus for the Street Smart NJ campaign.
3.2.2.1 Proxy 1: Unsafe crossing and crossing against the signal. A pedestrian crossing more than half of the street outside of the crosswalk or begins crossing the street while the signal indicates “Don’t Walk.” The measure of exposure is the overall number
26 of pedestrians crossing the street (Figure 6).
Figure 5. Unsafe Crossing and Crossing against the Signal (Proxy 1)
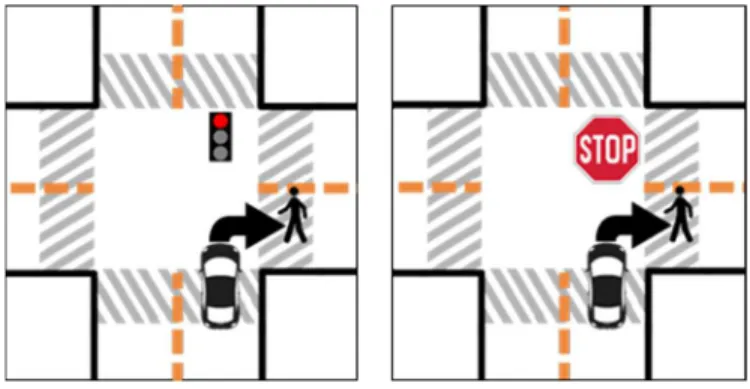
3.2.2.2 Proxy 2: Turning vehicle fails to stop for pedestrian.A vehicle making a left or right turn at a green signal or an unsigned intersection approach fails to stop for a pedestrian crossing parallel to the approach. The measure of exposure is the overall number of left or right turning vehicles when pedestrians are present so that turning vehicles have an opportunity to properly stop for pedestrians (Figure 7).
27
3.2.2.3 Proxy 3: Failure to stop before right turn at red signal or stop sign. A right-turning vehicle fails to make a complete stop and stay stopped for pedestrians before making a right turn on red. The measure of exposure is the overall number of right-turning vehicles that approach the stop bar on a red signal because all cars should stop before proceeding, whether or not a pedestrian is present. For unsignalized
intersections, this proxy is a right turn vehicle fails to make a complete stop for pedestrians before making a right turn at a stop sign. The measure of exposure is the overall number of right-turning vehicles that approach the stop sign (Figure 8).
Figure 7.Failure to Stop before Right Turn at Red Signal or Stop Sign (Proxy 3)
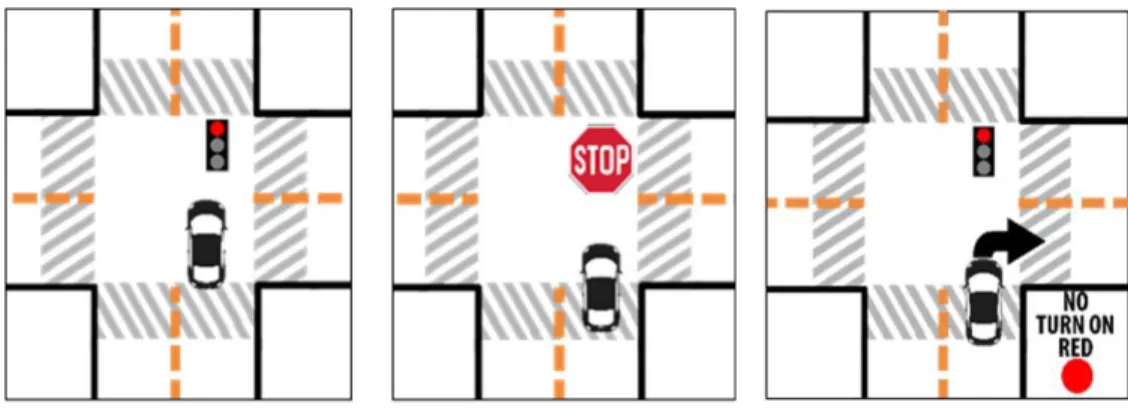
3.2.2.4 Proxy 4: Running red light signal or stop sign. A vehicle passing an intersection when the traffic signal is red. The measure of exposure is the sum of vehicles that enter the intersection, regardless of traffic signal color. For unsignalized
28
at the stop sign. The measure of exposure is the sum of vehicles that enter the intersection (Figure 9).
Figure 8. Running Red Light Signal or Stop Sign (Proxy 4)
To evaluate the safety proxy behaviors of community members before and after the Street Smart NJ campaign, four non-compliant behaviors and four measures of exposure for multiple intersections approach at each study site were observed and recorded. The video data enabled the extraction of behaviors of interest and represented the information in a manner that could be used for further analysis. The use of video cameras allowed the compilation of a comprehensive record of all vehicle and pedestrian movements at the study locations during the data collection period. Table 2 shows the pre- and post-campaign data collection locations.
29 Table 2
Pre- and Post-Campaign Data Collection Sites Community and
Intersection Pre-Campaign Post-Campaign
Teaneck ‒ State Street and Queen Anne Road
Tuesday, May 1, 2018 10 a.m. to 2 p.m.
Tuesday, June 26, 2018 10 a.m. to 2 p.m. Asbury Park ‒ Memorial
Drive and Springwood Avenue
Tuesday, August 14, 2018
10 a.m. to 1 p.m. Tuesday, October 23, 2018 10 a.m. to 1 p.m. Garfield ‒ Midland Avenue
and Van Winkle Avenue Tuesday, August 21, 2018 9 a.m. to 1 p.m. Wednesday, November 7, 2018 9 a.m. to 1 p.m. Newark ‒ Raymond
Boulevard and Mulberry Street
Thursday, September 20, 2018
9 a.m. to 1 p.m. Thursday, November 29, 2018 9 a.m. to 1 p.m. Morris Plains ‒ Speedwell
Avenue and Franklin Road Tuesday, October 2, 2018 7 a.m. to 11 a.m. Monday, November 12, 2018 7 a.m. to 11 a.m. Princeton ‒ Nassau Street and
Washington Road Monday, October 8, 2018 10 a.m. to 1 p.m. Monday, November 26, 2018 10 a.m. to 1 p.m. Rutherford ‒ Park Avenue and
Glen Road
Monday, October 15, 2018 9 a.m. to 1 p.m.
Monday, December 3, 2018 9 a.m. to 1 p.m.
Woodbridge – Main Street
and Eleanor Place Thursday, March 7, 2019 9:30 a.m. to 1:30 p.m. Thursday, May 9, 2019 9:30 a.m. to 1:30 p.m.
3.2.3 Study locations. In this study, eight geographically and demographically diverse communities in northern, central, and southern New Jersey were selected for further analysis as follows:
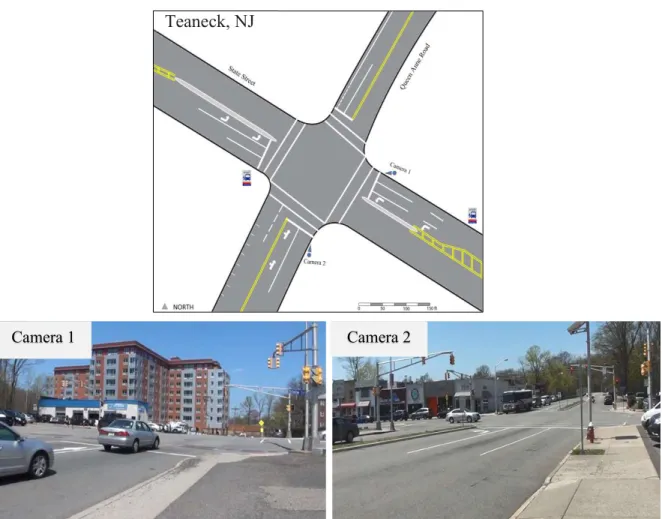
3.2.3.1 Bergen County, Township of Teaneck–State Street and Queen Anne Road. The Township of Teaneck has an estimated population of 40,284 and encompasses an area of six square miles. (U.S Census Bureau, 2019A) The intersection of State Street and Queen Anne Road is located approximately a half-mile from Benjamin Franklin Middle School and in the geographic center of the township. Three blocks to the south is Milton A. Votee Park, and Windsor Park is two blocks to the west of the intersection. Towards the north of Queen Anne Road, there is a Yeshivat He’Atid, a private middle school, which increases pedestrian activity in this area during its regular hours of
30
operation. The intersection features small buildings that house businesses facing the sidewalk to the south and automotive service businesses to the north. A traffic signal controls the movement of pedestrians and drivers at the intersection. It should be noted that the cameras were positioned on the east and south corners of the intersection to record all pedestrian and vehicle movements (Figure 10).
Figure 9. Intersection of Queen Anne Road and State Street and Camera Views in
Teaneck, NJ
Teaneck, NJ
31
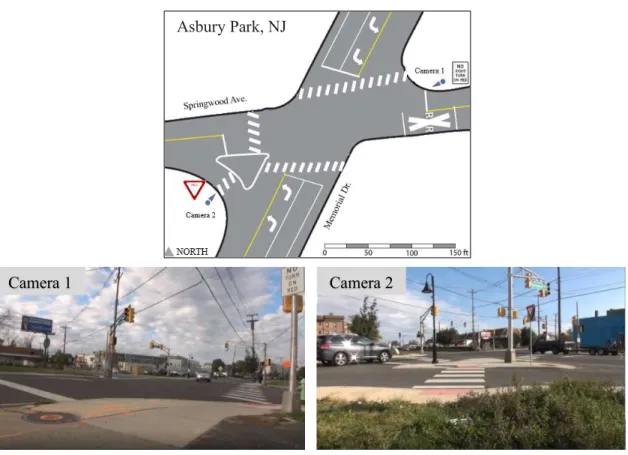
3.2.3.2 Monmouth County, City of Asbury Park–Memorial Drive and
Springwood Avenue. The City of Asbury Park has a population of 15,408 and a land area of 1.42 square miles (U.S Census Bureau, 2019B). The intersection of Memorial Drive and Springwood Avenue is situated near the Asbury Park Train Station, and there are train tracks parallel to Memorial Drive. The intersection is approximately one mile west of the shoreline and a block away from Wesley Lake. The intersection is located
approximately a half-mile from Asbury Park Middle School in the southern part of the township and has several residential apartments and a shopping center near it. A traffic signal controls the intersection, and crosswalks are present at three intersection approaches. The cameras were positioned on the southwest and northeast corners of the intersection in order to record all pedestrian and vehicle movements (Figure 11).
32
Figure 10. Intersection of Memorial Drive and Springwood Avenue and Camera Views in Asbury Park, NJ
3.2.3.3 Bergen County, City of Garfield – Midland Avenue and Van Winkle Avenue. The City of Garfield is 2.10 square miles with a population of 31,802 (U.S Census Bureau, 2019C). The T-intersection of Midland Avenue and Van Winkle Avenue is located a mile from Garfield High School in the southern part of the city. A rail track runs parallel to Midland Avenue to the west and intersects Van Winkle Avenue. The intersection has only residential apartments on its east side, and there is a pharmacy, shopping center, and residential apartments to the west. The intersection is a half-mile east of the Passaic River. The cameras were installed on the west and north corners of the intersection in order to record all pedestrian and vehicle movements (Figure 12).
Asbury Park, NJ
33
Figure 11. Intersection of Midland Avenue and Van Winkle Avenue and Camera Views
in Garfield, NJ
3.2.3.4 Essex County, City of Newark – Raymond Boulevard and Mulberry Street. The City of Newark is New Jersey’s largest city, with 282,015 residents spread across 24.19 square miles (U.S Census Bureau, 2019D). The intersection of Raymond Boulevard and Mulberry Street is located 0.3 miles from Military Park in the geographic central part of the city. The Passaic River is to the east of the intersection. The U.S. Social Security Administration, PSE&G, One Newark Center and the Seton Hall Law School are all located at this intersection The intersection is located 0.4 miles from the Newark Penn Station. As a result, this intersection experiences a high volume of
Camera 1 Camera 2
34
pedestrians. Cameras were positioned on two corners of the intersection to record the movements of pedestrians and drivers (Figure 13).
Figure 12. Intersection of Raymond Boulevard and Mulberry Street and Camera Views
in Newark, NJ
3.2.3.5 Morris County, – Borough of Morris Plains – Speedwell Avenue and Franklin Road. The Borough of Morris Plains is 2.56 square miles with a population of 6,255 (U.S Census Bureau, 2019E). The intersection of Speedwell Avenue and Littleton Road is located approximately a quarter mile from the Morris Plains 9/11 Memorial Park and Alfred Vail Elementary School is a half-mile south. Two blocks to the west is the Morris Plains library. Running to the north, Speedwell Avenue turns into Granniss
Newark, NJ
35
Avenue. The Morris Plains train station is at the intersection, which generates increased pedestrian and traffic volume during early morning hours. The cameras were positioned on the northeast and southeast corners of the intersection in order to record all
pedestrian and vehicle movements (Figure 14).
Figure 13. Intersection of Speedwell Avenue and Franklin Road and Camera Views in
Morris Plains, NJ
3.2.3.6 Mercer County, Municipality of Princeton – Washington Road/
Vandeventer Ave and Nassau Street. The Municipality of Princeton is 1.84 square miles and has 31,187 residents (U.S Census Bureau, 2019F). The intersection of Washington
Morris Plains, NJ
36
Road/Vandeventer Avenue and Nassau Street is located at the heart of Princeton’s central business district and next to the Princeton Garden Theatre and the Princeton United Methodist Church. It is approximately 0.2 miles from Palmer Square, a popular plaza with a collection of shops, restaurants, offices, and residential spaces. The intersection connects Princeton University to the plaza on Nassau Street and surrounding
neighborhoods on Vandeventer Avenue, which increases the pedestrian volume during the university’s working hours. Figure 15 shows the locations of cameras on the
southwest and northeast corners of the intersection in order to capture all movements.
Figure 14. Intersection of Nassau Street and Vandeventer Avenue and Camera Views in
Princeton, NJ
Camera 1 Camera 2
37
3.2.3.7 Bergen County, Borough of Rutherford – Glen Road onto Park Avenue. The Borough of Rutherford is 2.81 square miles and has 18,303 residents. (U.S Census Bureau, 2019G). The intersection of Glen Road and Park Avenue is located next to a Dunkin Donuts, the Park Avenue Pet Center, Goffin’s Hallmark Shop, and many other locally owned businesses. Continuing to the north is a rotary connecting Erie Avenue and Park Avenue. When traveling south on Park Avenue, there are various parks for people to enjoy. The locations of cameras on the southwest corners of the T-intersection is shown in Figure 16.
Figure 15. Intersection of Glen Road onto Park Avenue and Camera Views in
Rutherford, NJ
Camera 1 Camera 2
38
3.2.3.8 Middlesex County, Township of Woodbridge – Main Street and Eleanor Place. The township of Woodbridge is 23.2 square miles and has 100,145 residents (U.S Census Bureau, 2019H). The 3-way T-intersection of Main Street and Eleanor Place is located near the Woodbridge Municipal Court, which is in the epicenter of the
commercial area of Woodbridge. It is 0.2 miles away from the Woodbridge railway station. The intersection has no traffic signal and is controlled by a stop sign on Eleanor Place. Figure 17 illustrates the location of cameras on the south and east corners of the intersection.
Figure 16. Intersection of Main Street and Eleanor Place and Camera Views in
Woodbridge, NJ
Woodbridge, NJ
39
3.2.4 Statistical analysis. To determine the effectiveness of the Street Smart NJ campaign in changing behavior, the behaviors of pedestrians and drivers before and after the campaign (pre- and post-campaign) were compared. The assumption is that each individual who drives or walks through the intersection makes a decision to obey or disobey traffic regulations, with some probability that is independent of the behavior of other drivers and pedestrians. Given this assumption, each driver or pedestrian that has an opportunity to be involved in unsafe, non-compliant behavior will either decide to
comply with traffic regulations or not, following a Bernoulli (binary) process.
In this project, when a driver or pedestrian does not comply with a specific traffic regulation captured in the proxy variables, it is considered a Bernoulli success, whereas a Bernoulli failure occurs when a safe, compliant behavior is observed. In this situation, the success rate specifies how often people engage in unsafe behaviors. In a total population of drivers and pedestrians, the number of successes follows a binomial distribution and the proportion of successes out of the total population of motorists and pedestrians follows an approximately normal distribution, which was used for hypothesis testing and quantifying the magnitude of the effect. As discussed earlier, by counting non-compliant and compliant behavior events, it is possible to measure the proportion of
non-compliance for drivers or pedestrians. More specifically, for each proxy, two different rates of non-compliance, including the rate of non-compliant behavior in the pre-campaign data and rate of non-compliant behavior in the post-pre-campaign data, were calculated.
40
To test whether a change in the rate of non-compliant behavior is significant, statistical calculations verify whether or not it is possible to reject the null hypothesis that the behavior did not change. The fundamental equation to conduct the test is as follows:
Ζ = 𝜌 − 𝜌 𝜌(1 − 𝜌)(𝑛1 +𝑛1) 𝜌 =Χ − Χ 𝑛 − 𝑛 𝜌 =Χ 𝑛 𝜌 =Χ 𝑛
where, Χ is the number of non-compliant events in pre-campaign data; Χ is the number of non-compliant events in post-campaign data; 𝑛 is a measure of exposure to
pre-campaign data; 𝑛 is a measure of exposure to post-campaign data; 𝜌 is probability that a person did not comply with the regulations in pre-campaign data; 𝜌 is probability that a person did not comply with the rules in post-campaign data; and 𝜌 is a pooled sample proportion or combined average of probabilities.
The estimate of the change in the rate of non-compliance is the difference (𝜌2− 𝜌1). A negative value indicates a decrease in the proportion of the drivers and pedestrians engaging in unsafe behaviors, representing an improvement in traffic safety. The null hypothesis indicates that the rate of non-compliance in the pre-campaign is equal to or less than the post-campaign (H0: 𝜌 ≤ 𝜌 ) and the alternative hypothesis indicates that the rate of non-compliance in the pre-campaign is greater than the post-campaign (H1: 𝜌 > 𝜌 ). It should be noted that the researchers most often use significance
41
values of 0.01, 0.05, or 0.10, corresponding to 99 percent, 95 percent, and 90 percent confidence level, respectively. In this study, we considered a significant level of 95 percent. 3.3 Results and Observations
Considering the statistical methods described in previous sections, the
significance in the change of each proxy at each location was measured. Table 3 presents a summary of the results with the observed change in the rate of non-compliant behaviors, 𝜌 − 𝜌 , and the P-value associated with this change. For a change to be statistically significant at the 95 percent level (α = 0.05), the P-value must be less than 0.05.
It is worth mentioning that more than three hours of video data was collected at each site, allowing the sample sizes to be large enough to prove that the changes in behavior appear to be systematic, rather than simple random variations, especially at the urban intersections. Appendix A represents the hourly distribution non-compliance behavior for each study location. Furthermore, to be sure of the magnitude of the changes in behavior, it is best to look at the upper and lower bounds of confidence intervals, because the true change may be more or less than the observed change, due to random variation. As the study team evaluated the change in rates rather than a simple normally distributed variable, confidence intervals were more accurate than the analysis of
hypothesis testing.
The results of this study demonstrate that there was an overall decrease in dangerous behaviors following the campaigns and many of these reductions were statistically significant (Table 3). Negative values are favorable results, as they show reductions in unsafe behaviors, which is the goal of the Street Smart NJ campaign.
42
Positive values indicate increases in unsafe behaviors following the campaign.
Additionally, some of the increases can be associated with other influential factors, such as weather conditions and day of the week.
43
Table 3
Change in Counts and Rates of Non-Compliant Behaviors from the Pre- to Post-Campaign
Community Proxy
Pre-Campaign Post-Campaign Change
Non-Compliant Sample n1
Rate
(p1) Compliant Non- Sample n2 Rate (p2) %
Rate Difference (p2-p1) Lower 95.0% CI Upper 95.0% CI
P-Value Signification Test
Teaneck
1 112 472 0.237 86 253 0.340 43.3% 0.103 0.034 0.173 0.998 Insignificant Increase
2 57 167 0.341 32 152 0.211 -38.3% -0.131 -0.225 -0.032 0.005 Significant Reduction
3 N/A N/A N/A N/A N/A N/A N/A N/A N/A N/A N/A N/A
4 47 5343 0.009 26 4931 0.005 -40.1% -0.004 -0.007 0.000 0.017 Significant Reduction Asbury Park 1 126 142 0.887 65 161 0.404 -54.5% -0.484 -0.568 -0.384 0.000 Significant Reduction 2 26 58 0.448 13 51 0.255 -43.1% -0.193 -0.355 -0.013 0.018 Significant Reduction 3 18 54 0.333 5 50 0.100 -70.0% -0.233 -0.378 -0.075 0.002 Significant Reduction 4 11 3336 0.003 7 2909 0.002 -27.0% -0.001 -0.004 0.002 0.256 Insignificant Reduction Garfield 1 44 106 0.415 33 91 0.363 -12.6% -0.052 -0.184 0.083 0.226 Insignificant Reduction 2 13 41 0.317 13 37 0.351 10.8% 0.034 -0.168 0.236 0.626 Insignificant Increase 3 129 160 0.806 71 241 0.295 -63.5% -0.512 -0.588 -0.421 0.000 Significant Reduction 4 59 3393 0.017 20 3646 0.005 -68.5% -0.012 -0.017 -0.007 0.000 Significant Reduction Newark 1 629 2083 0.302 239 1762 0.136 -55.1% -0.166 -0.191 -0.141 0.000 Significant Reduction 2 398 844 0.472 222 826 0.269 -43.0% -0.203 -0.247 -0.157 0.000 Significant Reduction 3 97 376 0.258 48 372 0.129 -50.0% -0.129 -0.184 -0.073 0.000 Significant Reduction 4 61 6066 0.010 28 6147 0.005 -54.7% -0.006 -0.009 -0.002 0.000 Significant Reduction
44
Community Proxy
Pre-Campaign Post-Campaign Change
Non-Compliant Sample n1
Rate
(p1) CompliantNon- Sample n2 Rate (p2) %
Rate Difference (p2-p1) Lower 95.0% CI Upper 95.0% CI
P-Value Signification Test
Morris Plains 1 50 134 0.373 31 111 0.279 -25.2% -0.094 -0.207 0.025 0.060 Insignificant Reduction 2 10 27 0.370 15 42 0.357 -3.6% -0.013 -0.240 0.203 0.456 Insignificant Reduction 3 29 58 0.500 5 18 0.278 -44.4% -0.222 -0.419 0.040 0.049 Significant Reduction 4 303 7030 0.043 94 5577 0.017 -60.9% -0.026 -0.032 -0.020 0.000 Significant Reduction Princeton 1 410 1758 0.233 312 965 0.323 38.6% 0.090 0.055 0.126 1.000 Insignificant Increase 2 51 287 0.178 17 179 0.095 -46.6% -0.083 -0.142 -0.017 0.007 Significant Reduction
3 N/A N/A N/A N/A N/A N/A N/A N/A N/A N/A N/A N/A
4 129 2670 0.048 54 2692 0.020 -58.5% -0.028 -0.038 -0.019 0.000 Significant Reduction Rutherford 1 56 364 0.154 66 466 0.142 -7.9% -0.012 -0.062 0.036 0.311 Insignificant Reduction 2 24 112 0.214 23 153 0.150 -29.8% -0.064 -0.161 0.029 0.089 Insignificant Reduction 3 159 184 0.864 154 207 0.744 -13.9% -0.120 -0.196 -0.041 0.001 Significant Reduction 4 159 184 0.864 154 207 0.744 -13.9% -0.120 -0.196 -0.041 0.001 Significant Reduction Woodbridge 1 57 138 0.413 61 150 0.407 -1.5% -0.006 -0.119 0.106 0.456 Insignificant Reduction 2 63 126 0.500 24 108 0.222 -55.6% -0.278 -0.387 -0.155 0.000 Significant Reduction 3 22 83 0.265 7 98 0.071 -73.1% -0.194 -0.304 -0.086 0.000 Significant Reduction 4 63 147 0.429 42 143 0.294 -31.5% -0.135 -0.241 -0.024 0.008 Significant Reduction
Note: Proxy 1: Unsafe Crossing and Crossing against the Signal, Proxy 2: Turning Vehicle Fails to Stop for Pedestrian, Proxy 3: Failure to Stop before Right Turn at Red Signal or Stop Sign, and Proxy 4: Running Red Light Signal or Stop Sign; “No Turn on Red” signs are placed at the intersection, so Proxy 3 was not measured for Princeton and Teaneck