Received November 23rd, 2015, Revised September 2nd, 2017, Accepted for publication January 16th, 2018. Copyright © 2018 Published by ITB Journal Publisher, ISSN: 2337-5787, DOI: 10.5614/itbj.ict.res.appl.2018.12.1.4
Research Methodology for Analysis of E-Commerce User
Activity Based on User Interest using Web Usage Mining
Saucha Diwandari1,*, Adhistya Erna Permanasari2 & Indriana Hidayah2
1
Informatics Study Program, Faculty of Information Technology and Electrical, Universitas Teknologi Yogyakarta, Jl. Siliwangi, Yogyakarta 55285, Indonesia 2
Department of Electrical Engineering and Information Technology, Faculty of Engineering, Universitas Gadjah Mada, Bulaksumur, Yogyakarta 55281, Indonesia
*E-mail: [email protected]
Abstract. Visitor interaction with e-commerce websites generates large amounts of clickstream data stored in web access logs. From a business standpoint, clickstream data can be used as a means of finding information on user interest. In this paper, the authors propose a method to find user interest in products offered on e-commerce websites based on web usage mining of clickstream data. In this study, user interest was investigated using the PIE approach coupled with clustering and classification techniques. The experimental results showed that the method is able to assist in analyzing visitor behavior and user interest in e-commerce products by identifying those products that prompt visitor interest.
Keywords: clickstream; e-commerce; user interest; web usage mining; data mining; classification; web access log.
1
Introduction
Internet is a major global distribution channel for products, services, managerial and professional work fields. It provides a platform for services and the World Wide Web, better known as ‘the Web’. Through websites everyone can easily obtain or exchange information about whatever they are interested in. This has been a key driver of the growth of e-commerce. E-commerce is a digital environment that enables commercial transactions to take place between organizations and individuals. Some benefits of e-commerce are low cost, user access convenience, safety and reliability, and not being limited to space and time.
The benefits and ease invite many users who use e-commerce as a means of purchasing goods or services. With the increasing number of e-commerce users, many organizations are receiving excessive information at different levels. The flood of information is inversely proportional to the usefulness of the information obtained. This was the motivation behind the emergence of web mining, which is data mining applied to websites. Web mining aims to find useful information or knowledge from web hyperlink structures, page content and usage data [1].
Useful information from usage data can be obtained through a number of web usage mining (WUM) techniques. WUM aims to record, model and analyze behavior patterns and profiles of visitors who interact with a website. In the literature study conducted for this research, it was identified that WUM, especially in relation to e-commerce, has been used by researchers to achieve various goals. Liao, et al. [2] conducted an analysis of customer behavior on the Carrefour website to attract more customers by expanding the features of the website and increase product bundling information in order to offer more choices to customers. Analysis of customer behavior was also carried out by Carmona [3] to improve the design of e-commerce website www.OrOliveSur. com. Thorleuchter, et al. [4] conducted an investigation into predicting profitable new customers based on textual information from customer’s websites within a B2B scope. In another study, Thorleuchter, et al. [5] conducted the identification of success factors of e-commerce and their impact on the success of trade transactions between companies.
E-commerce technology allows adjustments that change the goods or services offered according to visitor preferences or behavior previously shown. In e-commerce business competition, any information related to consumer behavior is something valuable to merchants [6]. To attract more customers, e-commerce companies diversify their products and increase the number of categories of the products. Some websites of large e-commerce organizations are visited by more than one million customers per day [7]. As a result, certain challenges arise for the e-commerce organizations in finding user interest as well as conducting effective campaigns for the right products to the intended target.
In this paper, the authors propose a method to find user interest particularly regarding products offered on e-commerce websites based on click-stream data using a web usage mining approach. In the proposed method, click-stream data of the users are collected in real time and a method to calculate user interest is applied. This paper is organized as follows: Section 2 presents a literature review related to research that has been done on click-stream data mining. In Section 3, the integration method is described and the formula to calculate user interest and the related algorithms are presented. In Section 4, the experimental study is presented. Section 5 is the last section of this paper, containing conclusions and suggestions for future research directions.
2
Related Work
Recorded internet user actions are known as stream data [8]. A click-stream captures every gesture made by a visitor and these gestures have the potential to provide a description of the visitor’s habits. The recorded data include user activities such as browsing, product purchasing or clicking on an
ad banner. Click-stream data are one of the most useful resources for researchers and practitioners who are trying to understand the behavior of individuals in making choices [7].
Click-streams can be used to determine user interest. In recent years, click-stream data mining has become very important in web data analysis. Based on click-stream data mining, Chiang, et al. [9] conducted a research on building click preference index models with a time factor (CPIT) in which the purpose is to distinguish between various types of user behavior and predict return visits. Nottorf [10] developed a binary logit model to show consumer clickstreams on multiple online advertising channels. Chen, et al. [11] introduced a combination of a click preference index (CPI) and preference drifts to propose a model of behavioral preference (BP).
To measure user interest, some characteristics of user behavior have been examined, for example product rating [12,13], purchasing records [14], page discussed sequence [15], page detention time [16-19], page browsing frequency [20,21], and contextual information [22]. More specifically, White, et al. [22] conducted a study on the effectiveness of five different types of contextual information sources to perform modeling of user interest. The five contextual information sources used were: social, historic, task, collection and user interaction. Park, et al. [15] conducted a research to identify user interest based on the order of user page visits.
Zheng, et al. [16] conducted research to identify user interest based on the order of user page visits. Li, et al. [20] proposed a more comprehensive evaluation method that describes user interest based on the time spent on each page and the frequency of visits. As one of the most important techniques in web usage mining, classification has been widely applied for various purposes, such as assigning visitor profiles to a particular class or category. Jalali, et al. [23] proposed a new approach for the automatic classification of navigation patterns of web visitors and prediction of visitor demand in the future. Yu, et al. [24] classified two types of visitors, i.e. visitors with and without interest in purchasing products. Furthermore, Chitra, et al. [25] conducted a comparison between the SVM algorithm. The results of this study indicated that the transductive SVM algorithm has better accuracy compared to a decision tree algorithm.
3
Methodology for Analysis of e-Commerce User Activity
3.1
Description of the Methodology
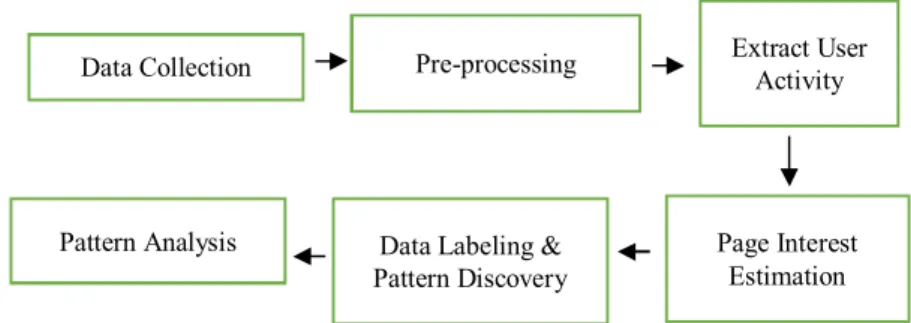
User activity is an important element of user analysis [26]. Some studies have utilized user activity when interacting with a website as recorded in click-stream data to discover visitor interest. One of the main indicators of visitor interest identified by the researchers was the duration or time spent on a web page [19,20,25,27]. A visitor activity model can be built based on the time spent by a visitor on the website’s pages to find user interest, especially for products offered on e-commerce websites, by using techniques from web usage mining. The methodology is presented in Figure 1. The workflow of the methodology is as follows:
1. Data collection. The data are derived from the client’s log file. 2. Pre-processing. Unnecessary data from web crawl robots are cleared. 3. Extract user activity data. The data are transformed into a format that is
required to perform user interest measurement.
4. Page interest estimation. User interest is measured by using this method’s approach.
5. Data-set labeling and pattern discovery. These two stages are used to discover patterns in user activity based on user interest.
6. Patterns analysis. The patterns found in the discovery phase are learned to determine visitor interest in products offered.
Figure 1 Methodology for user activity analysis in e-commerce.
3.2
Definition of User Interest
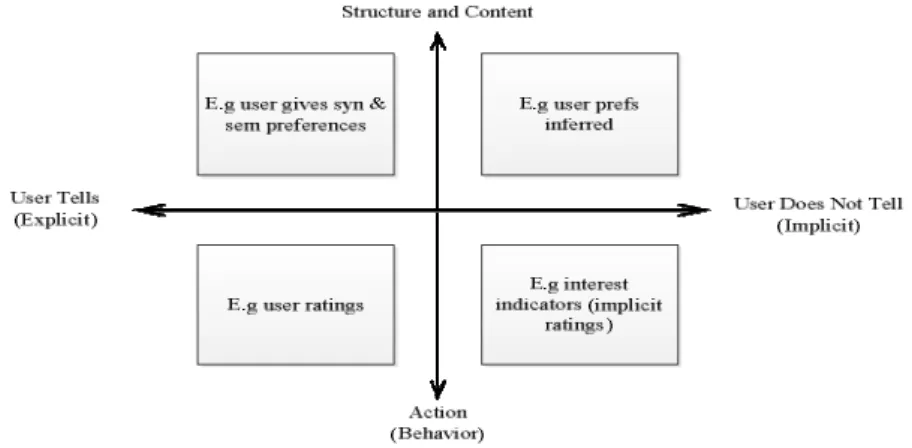
To determine user interest on e-commerce websites can be conducted through an analysis of the users’ browsing behavior. Claypool, et al. [27] applied indicator interest categories as shown in Figure 2. The horizontal axis of Figure 2 represents explicit or implicit interest indicators. The vertical axis represents whether the interest indicators are derived from the structure or the content of a
Data Collection Pre-processing Extract User
Activity
Page Interest Estimation Data Labeling &
Pattern Discovery Pattern Analysis
website, or from the actions of the visitors. Li, et al. [20] developed the PIE method to build an accurate visitor profile without disturbing the visitor or involving the visitor’s personal information.
Figure 2 Interest indicator categories.
Their method was developed with the assumption that visitor interest is shown by the reference length, i.e. the time spent on accessed pages, and the frequency of visits, i.e. the number of visits, while the period of time between the first and the last visit is also an important factor. In this study, the PIE approach was used to identify user interest. From the above point of view, the pages of interest of a user can be estimated by
:
Interesti = RLi’ . (1 + CF . Frei’ + CR . VTi’) (1) where 1≤ i ≤ m, and m is the total numbers of pages accessed by the visitor.
Fre’ = j Fre m j Frei 1 max (2) RL’=
j
j m j i i Bytes CT RL Bytes CT RL . max . 1 (3) te LogStartDa LogEndDate Firstdate LastDate VT VT VTi i i i log ' (4)where RL is the overall time spent on a page by the user during a specified time period as recorded in the access log. Bytes is the size of the page and Fre is the
number of visits. CF and CR are the weight coefficients with a value weight of 1, where a CT coefficient of 1 stands for .html files. A number of studies have utilized the PIE approach for various objectives [28-31].
3.3
Web Usage Mining Approach
3.3.1
Data Set Labeling and Pattern Discovery
To determine user interest, particularly in products offered on e-commerce websites, web usage mining techniques can be implemented. There are two main techniques in web usage mining, namely density-based clustering and classification with SVM [32-33]. There are several WUM techniques that utilize clustering by forming a usage cluster with the K-means algorithm. In contrast to Guerbas, et al. [34], the present study used density-based clustering because this approach can detect the presence of outliers – unlike other clustering algorithms such as K-means – and because it is not necessary to know the number of clusters to be formed beforehand. Outliers are close to a wrong result, so detecting and removing outliers is important [35]. To find out what gives the best cluster result is done by trial-and-error using the K-means method with density-based clustering through the MakeDensityBasedClusterer algorithm using the Weka tool.
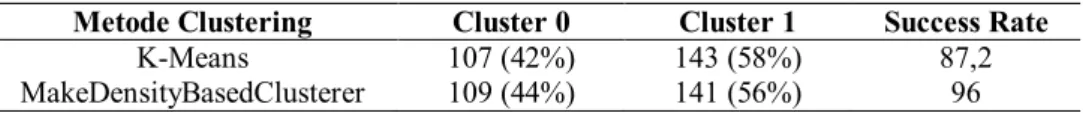
Table 1 Comparison of K-means and density-based clustering.
Metode Clustering Cluster 0 Cluster 1 Success Rate
K-Means 107 (42%) 143 (58%) 87,2
MakeDensityBasedClusterer 109 (44%) 141 (56%) 96 Referring to the research done by Guerbas, et al. [34] and the result of the experiments they conducted, the result presented in Table 1 shows that density-based clustering had a better success rate compared to K-means. Therefore, this research used density-based clustering to perform data labeling. After conducting data labeling, the next process is the pattern discovery process through classification techniques to label the product pages visited by a user as ‘interested’ or ‘uninterested’. Density-based clustering available in Weka is used to perform data labeling. After the process of labeling the data, pattern discovery is performed using SVM classification. SVM is a data classification technique with a training process. The benefit of this method is that it appropriately classifies the data into two classes and provides a small generalization error. SVM is an appropriate method to solve the problem of high dimensionality within the limitations of the existing data sample [36]. To optimize the SVM training process, various optimization techniques have been developed that basically do iterative searching to find the maximum solution of the objective function. However, these techniques require the data to be stored
in memory in the form of a kernel matrix [36]. This results in increased complexity of the training data along with the size of the matrix so that the use of this technique is limited by the amount of data that can be processed. For larger datasets, a technique based on a working-set method is implemented. A method that is widely used in the current SVM is decomposition, for example sequential minimal optimization (SMO), which works on the working-set principle. A working set is a collection of variables that are optimized for the current iteration. The working principle of SMO is to optimize a global problem by using a small portion of data at a time. Below is the algorithm of the decomposition method [37]:
1. Determine a feasible initial value of
1 which is feasible, set k=1 (
1is a vector containing all
values). e Q T T 2 1 max (5) n i C t s..0
i , 1... 0
T y then stop.If not, then determine working set B
i, j 2. Complete sub-problem
B : B T k N BN B B BB T B B Q e Q 2 ( ) 1 min (6) Refer to 0
t C,tB , k N T N T B T B y y
3. 1 k. N k N
Set
k
k
1
;
proceed to the second step.For measuring the accuracy of the SMO algorithm we used k-fold cross validation. This is a validation technique that randomly distributes training data into k parts with the same ratio after which each part will be classified to predict the error rate [37]. Below are the k-fold cross validation steps:
1. Adjust k fold = 10.
2. Partition the dataset 10 fold.
For each k experiment use 9 folds for training and 1 fold for testing. 3. Figure 3 is an illustration of 10-fold cross validation.
Total number of examples Experiment 1 Experiment 2 Experiment 3 Experiment k ……….. Experiment 10 Test examples
Figure 3 Ten-fold cross validation.
4. Do SMO classification 10 times and calculate total error and the correct and error percentages for each partition.
5. Calculate average accuracy and error.
To calculate the percentage error for each k partition, the following forumula can be used:
=
(7)
To calculate the average of error rate, the following equation can be used:
= ∑ (8)
3.3.2
Pattern Analysis
Pattern analysis is needed to filter rules or interesting patterns from a set by eliminating unrelated rules or patterns. Commonly used techniques to analyze patterns are visualization techniques, OLAP and knowledge querying, and usability analysis. Visualization techniques are useful in helping to analyze identified patterns [39]. A variety of tools for visualization and presentation are used to present data in 2D and 3D. These tools provide an interactive display to show, compare and draw graphs, tables and diagrams.
4
Experiment and Analysis
In this section, the proposed methodology is used to conduct an evaluation of the e-commerce website Komputermurahjogja.com and identify visitor interest in products offered on this website by using clickstream data.
4.1
Data Collection and Pre-processing
Log data collection was done from September 16, 2014 to November 16, 2014 from the e-commerce website Komputermurahjogja.com. In total 637,890 lines of log data were obtained. The data collection in this study was conducted by using clickstream data at the client level, as proposed by Helmy [40]. User events obtained at the client level were page load, page focus, mouse move, and mouse scroll. The mouse move and mouse scroll events are indicators of visitor interest [41]. All the user events were recorded using JavaScript in real time and stored in a custom log table (CLT).
The log data were obtained by recording visitor activity. The log data taken were: visitor id, session id, referrer, accessed page, user event, date, time, visitor IP address, and user agent. Visitor id is obtained when a visitor accesses the website for the first time. Each visitor has a different visitor id, which remains unchanged when the visitor browses different web pages. Referrer is the webpage previously accessed by the visitor. User event records visitor behavior while browsing. Examples of visitor behavior are: load, unload, focus, mouse move and mouse scroll. Date and time represent a series of processes when a visitor accesses a web page. Visitor IP address is the visitor’s computer address used to access the web page. User agent is the browser that the visitor uses to access a web page. Table 2 is the format of the client log file.
Having collected the data, the next step was to perform data pre-processing. Pre-processing consists of five phases. The first phase is to conduct cleaning of unnecessary data contained in the CLT. Data left by web crawler robots such as Googlebot, Bingbot, Soguo Web and others, were removed from the CLT table. Web crawler robots only possess an event load but leave no browser name in the CLT. The total number of web crawler robots found was 804. The second phase was to identify the page to determine which pages were accessed by visitors in the Computer and Gadget categories. In the Computer category, the sub-categories used in this experiment were:
1. All-in-one PCs: Acer, Dell, Asus, HP and Lenovo
2. Desktop PCs: Acer, Asus, FastaWorld, HP, Lenovo and Rakitan
3. Notebooks: Acer, Asus, Axioo, Dell, MSI, HP, Samsung, Toshiba and Lenovo.
Table 2 Client log file format [32].
Field Meaning
1410926140537 Session identification
http://komputermurahjogja.com/p
eripherals/mainboard/ URL of the first request (original referrer) http://komputermurahjogja.com/p
eripherals/mainboard/index.php URL requested just before (referrer)
http://komputermurahjogja.co m/?term=&s=lga+775&post_type =product&taxonomy=product_ca t
URL of current request
mousemove Mouse event
s=lga+775 Item search by user
GET Method of request (method)
114.141.57.76 User proxy IP 108.162.208.32 User client IP Mozilla/5.0 (Windows NT 6.1; rv:33.0) Gecko/20100101 Firefox/33.0 User agent
Windows Firefox Browser and OS
2014-09-16 22:55:50 Date and time of the request
In the Gadget category, the sub-categories used in this experiment were:
1. Smartphones: Acer, Advan, Axioo, Evercoss, Lenovo, Oppo, VGEN, LG, Blackberry, Xiomi, Sony, Nokia, Samsung, Smartfren, Mito, Advan and iPhone
2. Tablets: Acer, Asus, Axioo, Samsung, Lenovo, Advan, Iconia, Yoga and Evercoss
The result of page identification showed that the Dell brand in the All-in-one PCs category and the Fasta World and HP brands in the Desktop PCs sub-category were not visited by the users of the website.
The third phase was to determine the page size of each page by using the tools.pingdom.com online tool. The fourth phase was to identify session id to determine the IP client of each user, which is also part of the fifth phase of the pre-processing stage. Visitors are identified through the IP client used. The result of the session id identification conducted was a total of 139 visitors having accessed pages in the Computer category and 108 visitors having accessed pages in the Gadget category. The fifth phase conducted in the pre-processing stage was to calculate browsing time and to determine the frequency of visits by the visitors to each page in a predetermined category.
4.2
User Interest Measurement by Page Interest Estimation
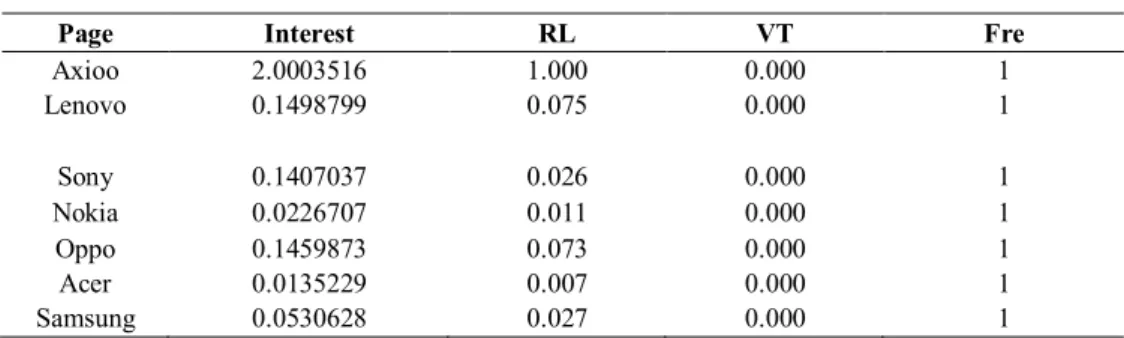
A number of data have been obtained from the pre-processing stage, namely the visitor’s IP address, page size, browsing time and frequency. The interest of a visitor in a page is determined through page interest estimation. Table 3 is a sample of page interest estimation for the Gadget category.Table 3 Example of page estimation data for the gadget category.
User: 103.22.201.232 (Mozilla/5.0 (Windows NT 5.1; rv:33.0) Gecko/20100101 Firefox/33.0)
Page Interest RL VT Fre
Axioo 2.0003516 1.000 0.000 1 Lenovo 0.1498799 0.075 0.000 1 Sony 0.1407037 0.026 0.000 1 Nokia 0.0226707 0.011 0.000 1 Oppo 0.1459873 0.073 0.000 1 Acer 0.0135229 0.007 0.000 1 Samsung 0.0530628 0.027 0.000 1
4.3
Data Labeling and Pattern Discovery
A clustering technique using MakeDensityBasedClusterer is used in the proposed method to provide the class labels for a number of traffic data. The cluster centroid is used as the determinant of class labels. The results of the clustering process were as follows: in the Computer category 116 pages were labeled as ‘uninterested’ and 159 data were labeled as ‘interested’. In the Gadget category 66 pages were labeled as ‘uninterested’ and 89 data were labeled as ‘interested’. The result from the classification process can be seen in Table 4.
Table 4 Result of classification with SMO algorithm. Sub-category Success Rate (%)
All in One PC 64
Notebook 95,6
Smartphones 68
Tablet 83,33
The classification results in the Computer category showed that the classifier formed from the SMO algorithm had varying accuracy scores. For the All-in-one PC category, the accuracy rate was 64%, while for the Notebook sub-category it was 95.6%. The classification results for the Gadgets sub-category also showed that the classifier formed from the SMO algorithm had varying accuracy scores. For the Smartphone sub-category, the accuracy was 68%,
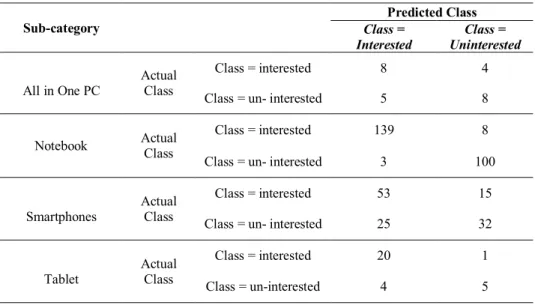
while in the Tablet sub-category it was 83.33%. Table 5 shows the number of instances classified based on their class.
Table 5 Confusion matrix. Sub-category Predicted Class Class = Interested Class = Uninterested All in One PC Actual Class Class = interested 8 4
Class = un- interested 5 8
Notebook Actual
Class
Class = interested 139 8
Class = un- interested 3 100
Smartphones
Actual Class
Class = interested 53 15
Class = un- interested 25 32
Tablet Actual Class Class = interested 20 1 Class = un-interested 4 5
4.4
Pattern Analysis
After traffic data processing conducted through the clustering method to provide the data labeling and classification of the traffic data into two classes, namely ‘interested’ and ‘uninterested’, the next step is pattern analysis. From the pattern analysis several products demanded by the visitors were found. In the Computer and Gadget categories it was shown that the Acer, Samsung, Lenovo, and Asus brands were in demand. Visitor interest was shown by several parameters, namely: frequency of visits, amount of time a visitor spent when accessing a page (RL), and the period between the first and the last visit of the visitor (VT). The frequency of visits made by visitors and the duration of time spent by visitors in interacting with the website are indicators that are highly influential in determining products of interest.
5
Conclusion and Future Work
Along with the development of the Internet, the World Wide Web is still growing explosively. Visitor interaction with e-commerce websites generates large amounts of clickstream data stored in web access logs. From a business standpoint, clickstream data can be used as a means to identify information about user interest. This paper presented a methodology to identify user interest in products offered on e-commerce website Komputermurahjogja.com based on
user clickstream data using web usage mining. Based on the experimental results, products that visitors are interested in can be successfully identified, using the proposed method, which can be further exploited by the owner of an e-commerce website to help to pursue product sales strategies for each category. In future research, user interest indicators other than time and frequency will be added and other classification algorithms will be examined.
Reference
[1] Liu, B., Web Data Mining Exploring Hyperlinks, Contents, and Usage Data, Springer Berlin Heidelberg, 2011.
[2] Liao, S-H., Chen, Y-J. & Lin, Y-T., Mining Customer Knowledge to Implement Online Shopping and Home Delivery for Hypermarkets, Expert Syst. Appl., 38(4), pp. 3982-3991, 2011.
[3] Carmona C.J., Ramírez-Gallego, S., Torres, F., Bernal, E., Del Jesus, M. J. & García, S., Web Usage Mining to Improve the Design of an e-Commerce Website: OrOliveSur.com, Expert Syst. Appl., 39(12), pp. 11243-11249, 2012.
[4] Thorleuchter, D., Poel, D. van den, & Prinzie, A., Analyzing Existing Customers’ Websites to Improve the Customer Acquisition Process as Well as the Profitability Prediction in B-to-B Marketing, Expert Syst. Appl., 39(3), pp. 2597-2605, 2012.
[5] Thorleuchter, D. & Poel, D. van den, Using Webcrawling of Publicly Available Websites to Assess E-Commerce Relationships, presented at the Annual SRII Global Conference, SRII, pp. 402-410, 2012.
[6] Srivastava, J., Cooley, R., Deshpande, M. & Tan, P., Web Usage Mining: Discovery and Applications of Usage Patterns from Web Data, 2000. [7] Su, Q. & Chen, L., A Method for Discovering Clusters of E-Commerce
Interest Patterns Using Click-Stream Data, Electron. Commer. Res. Appl., 14(1), pp. 1-13, 2015.
[8] Bucklin, R.E. & Sismeiro, C., Click Here for Internet Insight: Advances in Clickstream Data Analysis in Marketing, J. Interact. Mark., 3(1), pp. 35-48, 2009.
[9] Chiang, R-D., Wang, Y-H. & Chu, H-C., Prediction of Members’ Return Visit Rates Using a Time Factor, Electron. Commer. Res. Appl., 12(5), pp. 362-371, 2013.
[10] Nottorf, F., Modeling the Clickstream Across Multiple Online Advertising Channels Using a Binary Logit With Bayesian Mixture of Normals, Electron. Commer. Res. Appl., 13(1), pp. 45-55, 2014.
[11] Chen, C-H., Chiang, R-D., Wang, Y-H. & Chu, H-C., Combing Customer Profiles for Members’ Return Visit Rate Predictions, Int. J. Innov. Comput. Inf. Control, 9(2), pp. 503-523, 2013.
[12] Zhao, X., Niu, Z. & Chen, W., Interest before Liking: Two-step Recommendation Approaches, Knowl.-Based Syst., 48, pp. 46-56, 2013. [13] Cleger-Tamayo, S., Fernández-Luna, J-M. & Huete, J-F., Top-N News
Recommendations in Digital Newspapers, Knowl.-Based Syst., 27, pp. 180-189, 2012.
[14] Park, Y-J. & Chang, K-N., Individual and Group Behavior-Based Customer Profile Model for Personalized Product Recommendation, Expert Syst. Appl., 36(2), Part 1, pp. 1932-1939, 2009.
[15] Park, S., Suresh, N.C. & Jeong, B-K., Sequence-Based Clustering for Web Usage Mining: A New Experimental Framework and ANN-Enhanced K-Means Algorithm, Data Knowl. Eng., 65(3), pp. 512-543, 2008.
[16] Zheng, L., Cui, S., Yue, D. & Zhao, X., User Interest Modeling Based on Browsing Behavior, presented at the ICACTE 2010-2010 3rd International Conference on Advanced Computer Theory and Engineering, Proceedings, 5, pp. V5455-V5458, 2010.
[17] Kim, Y. S. & Yum, B-J., Recommender system Based on click Stream Data Using Association Rule Mining, Expert Syst. Appl., 38(10), pp. 13320-13327, 2011.
[18] Pazzani, M. & Billsus, D., Learning and Revising User Profiles: The Identification of Interesting Web Sites, Mach. Learn., 27(3), pp. 313-331, 1997.
[19] Chan, P.K., Constructing Web User Profiles: A Non-invasive Learning Approach, International Workshop on Web Usage Analysis and User Profiling, San Diego, CA, USA, pp. 39-55, 1999.
[20] Li, Y., Feng, B-Q. & Wang, F., Page Interest Estimation Based on the User’s Browsing Behavior, presented at the 2009 2nd International Conference on Information and Computing Science, ICIC 2009, 1, pp. 258-261, 2009.
[21] Lee, C-H. & Fu, Y-H., Web Usage Mining Based on Clustering of Browsing Features, 8th International Conference on Intelligent System Design and Applications, 1, pp. 281-286, 2008.
[22] White, R.W., Bailey, P. & Chen, L., Predicting User Interests from Contextual Information, presented at the Proceedings-32nd Annual International ACM SIGIR Conference on Research and Development in Information Retrieval, SIGIR, pp. 363-370, 2009.
[23] Jalali, M., Mustapha, N., Sulaiman, M.N. & Mamat, A., WebPUM: A Web-Based Recommendation System to Predict User Future Movements, Expert Syst. Appl., 37(9), pp. 6201-6212, 2010.
[24] Yu, J-X., Ou, Y., Zhang,C. & Zhang, S., Identifying Interesting Visitors Through Web Log Classification, IEEE Intell. Syst., 20(3), pp. 55-60, 2005.
[25] Chitra, S. & Kalpana, B., Identifying Interesting Visitors Through Transductive Support Vector Machine Web Log Classifier, Int. Rev. Comput. Softw., 9(2), pp. 390-395, 2014.
[26] Zeng, J., Zhang, S. & Wu, C., A Framework for WWW user Activity Analysis Based on User Interest, Knowl.-Based Syst., 21(8), pp. 905-910, 2008.
[27] Claypool, M., Le, P., Wased, M. & Brown, D., Implicit Interest Indicators, presented at the International Conference on Intelligent User Interfaces, Proceedings IUI, pp. 33-40, 2001.
[28] Y, Li. & Feng, B-Q., Page Interest Estimation Model Considering User Interest Drift, presented at the Proceedings of 4th International Conference on Computer Science and Education, ICCSE, pp. 1893-1896, 2009
[29] Tavakolian, R. & Moghadam Charkari, N., A Novel Web Recommender System Considering Users’ Need Evolution, 5th Int. Symp. Telecommun. IST 2010, pp. 738-743, 2010.
[30] Su, F., Liu, Y., Zhou, L. & Ye, M., Information fusion of Crossing Network Communities Based on Analyzing Interests, presented at the Proceedings IEEE 5th International Conference on Bio-Inspired Computing: Theories and Applications, BIC-TA, pp. 835-839, 2010. [31] Bari, P. & Chaven, P., Page Interest Estimation using Apriori Algorithm,
in International Journal of Advanced Research in Computer Engineering & Technology, 2(6), pp.1955-1959, 2013.
[32] Diwandari, S., Permanasari, A. E., & Hidayah, I., Performance Analysis of Naïve Bayes, PART and SMO for Classification of Page Interest in Web Usage Mining, in International Seminar on Intelligent Technology and Its Applications (ISITIA), pp. 39-44, 2015.
[33] Perkowitz, M. & Etzioni, O., Adaptive Web sites: Automatically Synthesizing Web Pages, presented at the Proceedings of the National Conference on Artificial Intelligence, pp. 727-732. 1998.
[34] Guerbas, A., Omar A., Omar Z & Mohamad N., Effective Web Log Mining and Online Navigational Pattern Prediction, Knowl.-Based Syst.,
49, pp. 50-62, 2013.
[35] Zhuang, W. & Zhang, Y., Identifying Erroneous Data Using Outlier Detection Techniques, in Ocean Biodiversity Informatics, Hamburg, Germany, 37, pp. 187-192, 2007
[36] Cortes, C. & Vapnik, V., Support-vector Networks, Mach. Learn., 20(3), pp. 273-297, 1995.
[37] Lin, C-J., Optimization, Support Vector Machines, and Machine Learning, 2005.
[38] Suharjito, S., Diana, D. & Herianto, H., Implementation of Classification Technique in Web Usage Mining of Banking Company, in 2016
International Seminar on Intelligent Technology and Its Applications (ISITIA), pp. 211-218, 2016
[39] Mehak, Kumar, M. & Aggarwal, N., Web Usage Mining: An Analysis, J. Emerg. Technol. Web Intell., 5(3), pp. 240-246, 2013.
[40] Helmy, H., Online Shop Visitor Access Patterns Using a Weighted Graph Web Usage Mining (Case study : Koi Online shop), Thesis, Universitas Gadjah Mada, Yogyakarta, Indonesia, 2013.
[41] Kim, H-R. & Chan, P. K., Implicit Indicators for Interesting Web Pages, presented at the WEBIST 2005-1st International Conference on Web Information Systems and Technologies, Proceedings, pp. 270-277, 2005.
![Table 2 Client log file format [32].](https://thumb-us.123doks.com/thumbv2/123dok_us/467083.2555059/10.892.168.705.178.535/table-client-log-file-format.webp)