A STOCHASTIC INTERFACE MODEL FOR THE FRACTURE OF BARS
Sándor Nagy and Ferenc Kun
Department of Theorectical Physics
University of Debrecen, H-4010 Debrecen P. O. Box:5, Hungary
ABSTRACT
We study the breaking of an elastic bar under quasistatic and dynamic loading conditions by means of a stochastic interface model. The bar is composed of two rigid blocks glued together by a thin elastic interface which can break when the bar is bent. The progressive damage and fracture of the interface is analyzed subjecting the specimen to three point bending performed quasistatically and by impact loading. We show that ahead the interface crack a process zone is formed where the local failure mechanism is percolation in a gradient field. The crack propagates in bursts whose size distribution shows a universal power law behavior. The largest burst has a power law dependence on the strength of disorder. The process zone proved to shrink with increasing deformation making the crack tip sharper as the crack advances. Analyzing the impact loading of the specimen, we demonstrate that the perforation of the specimen occurs analogously to continuous phase transitions when increasing the energy of impact. We determine the critical exponents of the transition and reveal the consequences for the ballistic loading of solids.
Introduction
The fracture of heterogeneous materials is an important scientific and technological problem which has attracted an intensive research during the past years [1,2]. The interaction of the heterogeneous stress field with the disordered microstructure of the material makes the fracture process difficult to handle theoretically, hence, most of the theoretical approaches rely on large scale computer simulations of discrete models [1-11]. Under quasistatic loading the damage of disordered materials proceeds by microcrack nucleation, crack growth and arrest giving rise to a noisy response of the material before catastrophic failure [3]. This crackling noise can be recorded in the form of acoustic signals whose analysis provides important information about the microscopic damage process [3,13].
One of the most important theoretical approaches to the failure of heterogeneous materials are the fiber bundle models (FBM) in the framework of which the material is discretised in terms of elastic fibers of finite strength, where disorder is captured by the distribution of of strength values. In spite of their simplicities, FBM-s capture the most important ingredients of material failure and also served as the starting point of the development of more complex micromechanical model [3,4,5,6,7,11]. In this paper we study the dynamic fracture of a solid bar by means of a stochastic interface model. In the usual Charpy impact test, the notched specimen is clamped at the ends and the hammer hits it in the middle resulting in a dynamic three point bending [14]. Under such boundary and loading conditions, the damage localizes to a relatively thin layer of the specimen giving rise to a single growing crack starting from the notch. Depending on the energy of the hit, the crack can either terminate and the specimen suffers only partial failure, or it runs to the opposite boundary breaking the specimen into two pieces. For brittle specimens the onset of a crack propagation occurs in a catastrophic manner preceded by a relatively small deformation [14]. In ductile specimens however stable crack propagation occurs which is sensitive to the details of the loading conditions. Experiments and theoretical calculations showed that the stable crack propagation is not a smooth process, it is accompanied by fluctuations which can be recorded by various experimental techniques such as acoustic emission. In ferromagnetic materials like steel the dynamic propagation of cracks gives rise to sudden changes of the magnetic field which can generate electric current in a coil [15]. This so-called magnetic noise provides additional information on the dynamics of crack propagation compared to the usual acoustic emission measurements [15].
Analysing the structure of magnetic emission (ME) spectra, recently, it was found experimentally that the cracking of a bar under three point bending proceeds in bursts which are characterized by power law distributions [15]. The experiments showed that the exponents of the power laws are sensitive to the type of fracture, i.e. ductile materials are characterized by higher exponents than the brittle ones [15]. Motivated by the experimental findings, we study the damage process of a bar
under three point bending focusing on the bursts of microscopic breaking events, on the spatial distribution of damage and on the occurence of full perforation of the specimen. In order to simplify the calculations, we model the bar as two rigid blocks coupled together by an elastic interface. Deformation and damage of the bar is concentrated in the interface, while the two blocks remain intact. We determine how the strength of disorder and the inhomogeneous stress field determine the damage process of the interface.
The model
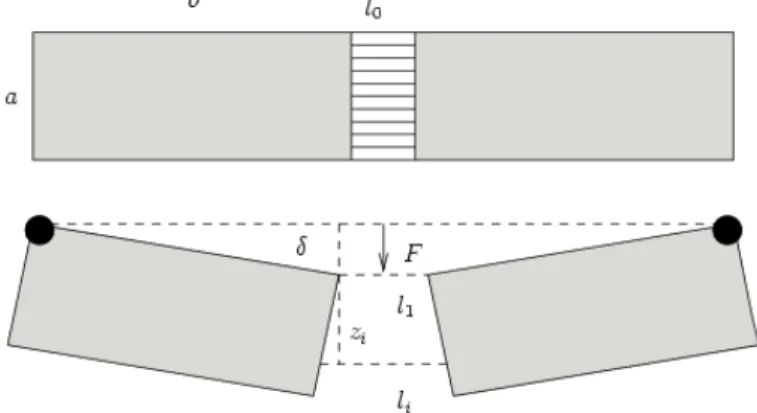
We construct a simple model to study the loading of an elastic bar of rectangular shape by an external force exerted perpendicular to the longer side of the bar in the middle. For simplicity we assume that the deformation and damage of the bar is concentrated in a relatively thin layer in the middle. Hence, in the model the bar is composed of two rigid blocks of side lengths
a
andb
which are glued together by an elastic interface of width l0, where l0<<b holds, see Fig. 1.Fig 1: The geometric layout of the model. The two rigid blocks of side length a and b are glued together by an interface of width l0which is discretized in terms of elastic fibers. The specimen suffers deflection
δ
under the action of the external force F exerted in the middle of the bar.The interface region can deform and suffer breaking under deflection of the specimen while the two rigid blocks remain intact. Bending of the specimen is performed such that the two blocks undergo rigid rotation about their outer upper corner concentrating the deformation in the interface layer. We discretise the interface region in terms of elastic fibers of number N and length
l
0 which are placed equidistantly between the two blocks. The fibers do not have bending rigidity, they can undergo only stretching deformation characterized by the same value of the Young modulusE
. During the bending of the specimen, the fibers can support only a finite deformation, i.e. if the local deformationε
i of fiber i exceeds a threshold valuec i
ε
the fiber breaks and a microcrack nucleates in the interface. The disordered properties of the material are represented by the randomness of the breaking thresholdsε
ic which are independent identically distributed random variables with a probability densityp
(
ε
c)
and cumulative distribution=
∫
c
dx
x
p
P
ε
c ε 0(
)
)
(
. The rigidity of the two rotating blocks implies that the macroscopic deformation of the specimen can be characterized by a single variableδ
which denotes the deflection of the middle of the bar from the original position, see Fig. 1.It can be seen in Fig. 1 that under bending of the specimen the interface opens resulting in an increasing elongation of fibers from top to bottom. The actual length of fiber
l
i can be expressed as a function ofδ
as1
1
2
0−
−
+
=
N
i
b
a
l
l
iδ
, (1)where
l
1=
l
0+
2
(
b
−
b
2−
δ
2)
is the length of the fiber index i=1 at the top of the bar. It follows that also the elongationi
l
∆
and the longitudinal strain of fibers increase linearly as a function of their position i,
1
1
2
2
2
2 2−
−
+
−
−
=
∆
N
i
b
a
b
b
l
iδ
δ
.
0l
l
i i∆
=
ε
(2)The torque of the external force F acting in the middle of the bar with respect to the clamping points is equilibrated by the torque of the force exerted by the elongated fibers of the interface. During the deformation process, those fibers which exceed their threshold value break, i.e. they are removed from the interface. Since
1
−
P
(
ε
i(
δ
))
is the probability that the interface element of index i remained intact under the externally imposed deformationδ
, based on the equilibrium condition of torques the constitutive equationσ
( )
δ
of the deflected bar can be cast in the form( )
[
1
(
(
)
)
]
(
)
1
1
1
1 2 2δ
ε
δ
ε
δ
δ
δ
σ
i i N iE
P
N
i
b
a
b
NL
−
−
−
−
+
=
∑
= (3) where L=2b+l0 is the overall length of the bar and the sum goes over all the fibers. On the right hand sideε
i(
δ
)
should besubstituted from Eq. (2).
The amount of disorder of the failure thresholds
ε
ic has a substantial effect on the macroscopic response of the specimen( )
δ
σ
. In the limiting case of zero disorder, i.e. when all the fibers have the same breaking thresholdε
ic=
ε
0c, the failure of the interface starts at the bottom where the stretching deformation is the highest and continues upwards asδ
is increased. It can bee seen in Fig 2 that the corresponding constitutive curve is sharply peaked. The critical deformationδ
c defined by the peak position corresponds to the instant of the first fiber breakε
0c=
ε
N( )
δ
c . Beyond the peak the stressσ
rapidly decreases due to the gradual breaking of the interface elements asδ
increases. For the actual calculations the parameter values l0=1, a=1, b=2.5 so that the constitutive curve in Fig. 1 ends at the deformationδ
max=
0
.
5
when the last fiber breaks. Due to the linearly elastic behavior of fibers of the interface before the peak where no fibers breakσ
( )
δ
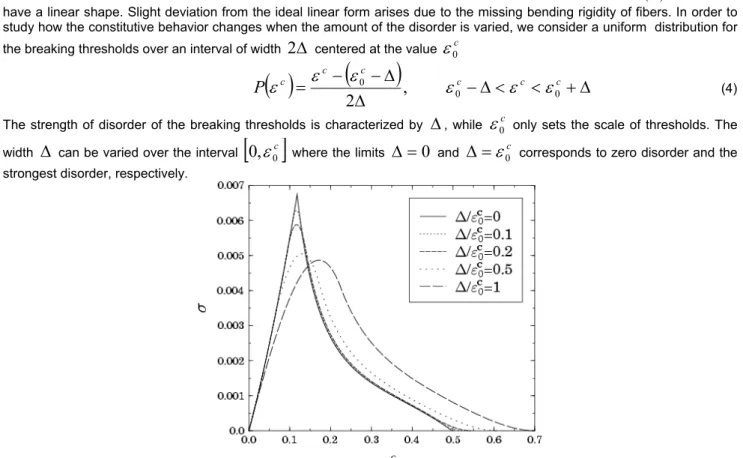
should also have a linear shape. Slight deviation from the ideal linear form arises due to the missing bending rigidity of fibers. In order to study how the constitutive behavior changes when the amount of the disorder is varied, we consider a uniform distribution for the breaking thresholds over an interval of width2
∆
centered at the valueε
0c( )
(
)
,
2
0∆
∆
−
−
=
c c cP
ε
ε
ε
ε
0c−
∆
<
ε
c<
ε
0c+
∆
(4) The strength of disorder of the breaking thresholds is characterized by∆
, whileε
0c only sets the scale of thresholds. Thewidth
∆
can be varied over the interval[ ]
0
,
ε
0c where the limits∆
=
0
and∆
=
ε
0c corresponds to zero disorder and the strongest disorder, respectively.Fig 2: The constitutive curve
σ
(
δ
)
of the interface composed of N=1000 fibers for several different distributions of the breaking thresholds. When all the fibers have the same fracture threshold(
∆
=
0
)
,σ
(
δ
)
has a sharp peak which gets rounded and develops into a quadratic maximum when∆
is increased.Fig. 2 shows that increasing the strength of disorder of the interface
∆
, the peak of the constitutive curve gets more and more rounded and develops into a quadratic maximum. The maximum value ofσ
(
δ
)
is preceded by a longer and longer non-linear regime due to the breaking of fibers, so that for∆
→
ε
0c the linear behavior prevails only for small deformations0
→
δ
. On the microlevel this process is accompanied by the randomization of the breaking sequence of fibers along the interface, i.e fibers do not simply break in the decreasing order of their index i.Bursts of fiber breaks
The complete constitutive curve of the system presented in Fig. 2 can only be recovered by deformation controlled loading. When
δ
is controlled externally, the local load on the interface elements is solely determined by the externally imposed deformation, which implies that there is no load redistribution after the breaking of fibers. Under stress controlled loading of the bar, after a fiber breaking the load of the broken fiber has to be redistributed over the intact ones. Due to the wedge shape of the deformed interface, at a given external loadσ
the load on the fibers linearly increases from top to bottom. It has the consequence that in spite of the rigidity of the two solid blocks, the load redistribution following fiber failure differs from the usual equal load sharing (ELS) approximation commonly used for the study of parallel bundles of fibers. The rigid surfaces, however, ensure that the load is redistributed globally in such a way that the excess load received by an intact fiber depends on the fibers' position along the interface but not on its distance from the failed one. This implies that no stress enhancement arises in the vicinity of the failed fibers as in the case of local load sharing approximation (LLS), such that it can be expected that the system still remains in the mean field universality class.In order to analyze the microscopic damage mechanism of the interface, we worked out an efficient simulation technique for a specimen where the interface is composed of N fibers with breaking thresholds
ε
ic,
i
=
1
,...,
N
sampled from the probability distribution Eq. (4) With the breaking thresholdsε
ic, we can determine the value of the macroscopic deformation parameter)
,
(
ci
i c iδ
ε
δ
=
, i= 1,..., N at which the fibers break. Of course,δ
ic is a function of both the position of the fiber i along the interface and the local breaking thresholdε
ic. During the loading process the fibers break in the increasing order of their critical macroscopic deformationδ
ic, which can be a randomized sequence of the fibers' position. The computer simulation of the loading process proceeds as follows: after generating the breaking thresholds of fibersε
ic we calculate the corresponding critical deflectionδ
ic and sort them into increasing order. The constitutive curve of the sample can be simply obtained by calculating the load needed to achieve the deformationδ
ic after the breaking of the first i-1 fiber remaining only only Nint =N-(i-1) intact elements. Between the breaking of the (i-1)th and the ith fibers, the constitutive equation of the system takes the form[
]
(
1
)
,
)
1
(
2
)
1
(
1
1
2
2
4
2
1 2 ' 2 2 2 1 ' 2 int 0
−
−
+
−
−
−
−
+
−
=
∑
∑
= = N j N jj
b
N
c
a
j
N
ac
ab
b
a
N
c
b
L
l
E
δ
δ
δ
σ
(5)with
c
=
b
2−
δ
2 and the prime indicates that the summation is restricted to indices of intact fibers, which are not necessarily consecutive integers. Note that in Eq. (5) the value ofδ
falls in the rangeδ
ic−1<
δ
<
δ
ic.Performing stress controlled experiments, after the breaking of a fiber the deformation of the specimen can freely change resulting in a redistribution of load over the intact fibers. The excess load taken up by the intact fiber can give rise to further fiber failures which may trigger an entire avalanche of failure events. This avalanche either stops and the bar becomes stable under the externally imposed load, or it spans the entire interface and the specimen breaks into two pieces. In order to study numerically this microscopic breaking process, in the simulations first we increase the deformation
δ
such that a single fiber breaks, i.e.δ
=
δ
1c is taken which corresponds to the fiber of index i1. Then the load needed to maintain this deformationσ
is calculated from Eq. (5) for Nint = N fibers. After the breaking of fiber i1 its load has to be redistributed over the remaining N-1 fibers. In order to determine the load of intact fibers after the removal of the broken one, we remove fiber i1 on the right hand side of Eq. (5) and invert the equation forδ
(
σ
)
keeping the loadσ
fixed. The fibers with threshold valuesδ
ic<
δ
(
σ
)
break as a consequence of load redistribution. This iteration has to be repeated under a fixed external loadσ
until the breaking sequence stops or all the fibers break resulting in a macroscopic failure of the system.In order to characterize the damage process of the loaded bar under stress controlled conditions, we determined the distribution of burst sizes s of fiber breaks for the disorder distribution Eq. (4) varying the width of the distribution
∆
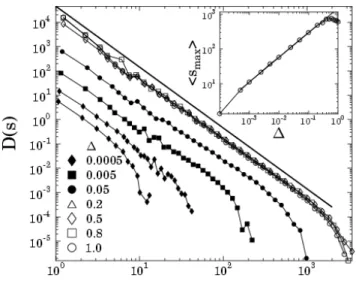
.Fig 3: Distribution of burst sizes D(s) at several values of
∆
. A straight line of slope 2.5 is drawn as a reference. The inset presents the average value of the largest burstss
max as a function of∆
.The avalanche size distributions D(s) are presented in Fig. 3, where the normalization was carried out such that the integral of the curves is equal to the total number of avalanches occurred. It can be observed in Fig. 3 that D(s) shows a power law form
τ −
s
s
D
(
)
~
(6)at any
∆
. Simulations revealed that the exponentτ
is universal, i.e. the value ofτ
is insensitive to the strength of disorder, it coincides with the exponent of the classical parallel bundle of fibers with equal load sharingτ
≈
2
.
5
[3,5]. However, it can be observed in Fig. (3) that the size of the largest burst smax have a strong dependence on the value of∆
. To obtain a quantitative characterization of this effect, the inset of Fig. 3 shows separately the average size of the largest burstss
max as a function of∆
, where a power law dependence is evidencedα
∆
~
max
s
. (7)For the value of the exponent
α
=
0
.
7
±
0
.
02
was obtained over the range0
.
0005
<
∆
/
ε
0c<
0
.
6
. For∆
>
0
.
6
the size of the largest avalanche levels off.Spatial evolution of damage
Besides the temporal correlation of microscopic failure events, also a very interesting spatial correlation emerges. In a bundle of fibers loaded between two parallel rigid plates due to the equal load sharing after fiber breaking, the breaking of a fiber is solely determined by its breaking threshold. Hence, fibers break in a completely random sequence without any spatial correlation. In our system, however, during the loading process the fibers break in the increasing order of their critical macroscopic deformation
δ
ic( )
ε
ic,
i
which depends both on the local breaking thresholdsε
ic and on the spatial position i of fibers. In the limiting case of zero disorder, i.e.∆
=
0
andε
ic=
ε
0c the critical deformationδ
ic( )
ε
0c,
i
is a monotonically decreasing function of i, which implies that the fibers break one-by-one starting from the bottom. This breaking sequence generates a crack penetrating the interface upward such that below the crack tip all the fibers are broken while above it the fibers are intact but deformed. Under strain controlled loading stable crack propagation is obtained gradually breaking the fibers by the external strain increments. Controlling the external load, however, the onset of crack propagation occurs in an unstable manner resulting in immediate catastrophic failure as it is expected for completely brittle materials.Increasing the strength of disorder
∆
, the breaking sequence of fibers determined byδ
ic becomes spatially randomized. At a given deformationδ
the fibers withδ
ic>
δ
have already failed. If the disorder is not too strong, an interesting spatial distribution of broken fibers emerges: starting from the bottom of the interface a continuous region of failed fibers develops forming a crack. On the opposite side, starting from the top of the interface a continuous region of intact, elongated fibers can be observed. The two regimes are separated by a process zone, which is a sparse sequence of intact and broken elements.It can be observed that the process zone sharpens, i.e. its width decreases as the deformation
δ
increases. It can be obtained analytically that at a given deflectionδ
the width w of the process zone also depends both on the strength of disorder∆
and on the geometrical extensions a,b of the specimen,
2
2
1
2 2 0
−
∆
−
+
−
−
=
a
b
b
b
N
w
cδ
δ
ε
(8)(
−
1
)
,
∆
=
N
a
b
w
δ
(9),
2
2
2 2 0a
b
b
b
N
w
cδ
δ
ε
+
∆
−
+
−
=
(10)for
δ
values whereε
N(
δ
)
>
ε
0c+
∆
. Due to the interplay of the threshold disorder and the global load redistribution in the form of the linearly increasing load along the interface, the mechanism of the progressive damage in the process zone is percolation in a gradient field [12]. A similar mechanism was obtained in [6]. It also follows from Eq. (10) that from the viewpoint of the damage process, the strength of disorder of the breaking thresholds is determined by the with∆
of the disorder distribution together with the geometrical setup of the specimenEnergetics of the loading process
The dynamic fracture process can also be studied by means of our stochastic interface model. A commonly used method to initiate high speed crack propagation in a specimen is the dynamically induced three point bending test. In the widely used Charpy impact test method the load is exerted by a heavy pendulum which is raised to an initial height and released, striking and breaking the specimen at the bottom of its swing [14]. The two ends of the specimen are clamped and the pendulum hits it in the middle, which results in a damage localized to a thin layer giving rise to a single growing crack. Experiments showed that depending on the energy E of the hit on the specimen, the outcome of the impact process can be classified into two states: at low values of the impact energy the propagating crack terminates and the specimen suffers only a partial failure. However, exceeding a critical energy value Ecthe crack passes through the entire system resulting in a global failure breaking the specimen into two pieces [14]. The results can be interpreted such that the critical energy separates two phases of the system, in the damaged phase below Ec the specimen keeps its integrity, while above Ec the specimen breaks into two pieces, which defines the fractured phase. At the critical energy a transition occurs between the two phases.
Based on our model, the energetics of the impact process can simply be studied. In order to simplify the impact process, we assume that the impacting body hitting the specimen in the middle with an initial kinetic energy E0 stays together with the specimen for the entire duration of the loading process. Furthermore, we neglect the energy stored by the rigid motion of the specimen so that the kinetic energy of the impactor Ek is transformed into the elastic energy Eelof the elongated fibers and is dissipated by the fiber breakings Edis. Hence, the energy balance of the system reads as
( )
( )
t
E
( )
( )
t
E
( )
( )
t
E
E
0=
kδ
+
elδ
+
disδ
(11)which means that at any time t of the impact process the sum of the kinetic energy of the impactor Ek, of the elastic energy stored in the elongated fibers Eel, and of the energy Edis dissipated by the fibers failed until time t must be equal to the initial input energy E0. During the deflection process, the energy gets stored by the elongated fibers which is then dissipated by breaking resulting in a propagating crack. If the impact energy E0 is not too high, the process stops at a finite deflection
δ
max at which the impactor has no kinetic energy Ek=0. In this case the entire impact energy is stored in deformation of the intact fibers and is partly dissipated by fiber breakingE
0=
E
el(
δ
max)
+
E
dis(
δ
max)
.In the framework of our simple model, the critical impact energy Ec can be defined as the impact energy entirely dissipated by fiber breaking at the stopping of the hammer, i.e.
E
dis(
δ
max)
=
E
c andE
el(
δ
max)
=
0
.
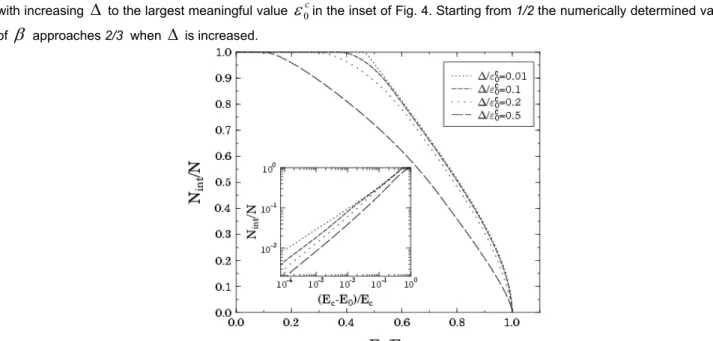
In order to characterize the final state of the impact process at different impact energies, we define the order parameter Nint/N of the system as the fraction of intact fibers Nint(E0) survived the impact and the total number of fibers N of the interface. The order parameter takes non-zero values in the damaged phase below the critical energy E0<Ec, and monotonically decreases whenE
0→
E
c, while it is zero in the fractured phase for any energies above the critical point E0>Ec. To reveal the nature of the transition from the damaged to the fractured state when increasing the impact energy, we calculated the order parameter as a function of the impact energy for several different strength of disorder of the breaking thresholds, which is plotted in Fig 4. For the limiting case of zero disorder∆
=
0
it can be shown analytically that the order parameter has a power law dependence on the distance from the critical point(
)
β0 int
/
N
~
E
E
N
c−
, (12)where the exponent
β
has the valueβ
=
1
/
2
. Computer simulations performed at various different values of∆
showed that the functional form Eq. (14) of the order parameter is also valid for disordered interfaces, however, the value of the exponentβ
is not universal, it proved to depend on the strength of disorder∆
. The change of the exponentβ
is apparent with increasing∆
to the largest meaningful valueε
0cin the inset of Fig. 4. Starting from 1/2 the numerically determined value ofβ
approaches 2/3 when∆
is increased.Fig 4: The order parameter Nint /N of the system as a function of the impact energy E0 for several different values of the strength of disorder
∆
.Furthermore, we determined numerically the susceptibilty of the system to the change of the control parameter as the derivative of the bending
δ
with respect to the impact energy E0. The susceptibility also shows a power law behaviour. The exponentγ
characterizing its scaling behaviour depends only on the strength of disorder∆
. Simulations revealed that the exponentsγ
andβ
are equal.Summary
In this paper we investigated the breaking of an elastic bar under quasistatic and dynamic loading using a stochastic interface model. We focus on statistical physical aspects of the breaking process and describe the breaking of the bar as a phase transition. We showed that the amount of disorder of the failure thresholds has a substantial effect on the macroscopic response of the specimen. The fracture of the bar was found to proceed in bursts whose distribution proved to be a power law with the exponent 2.5 independently of the strength of disorder. Furthermore, we showed that ahead the crack tip a fracture process zone is formed where the local failure mechanism is percolation in a gradient field. When the load is applied dynamically, calculations revealed that there exists a critical value of the impact energy below which partial failure of the interface occurs (damaged phase), while above it the crack passes through the entire specimen resulting in global failure (fractured phase). Computer simulations showed that the system approaches the critical point with scaling behaviour characterized by critical exponents. The results imply that the perforation of the bar under increasing loading occurs analogously to continous phase transistions.
Acknowledgments
This work was supported by OTKA M041537, T049209 and NKFP-3A/043/04. F. Kun acknowledges support of the György Békési Foundation of the Hungarian Academy of Sciences.
References
1. H. J. Herrmann, and S. Roux, eds., Statistical Models for the fracture of disordered media, Random materials and processes (Elsevier, Amsterdam, 1990).
2. B. K. Chakrabarti and L. G. Beuguigui Statistical Physics of Fracture and Breakdown in Disordered Systems, Oxford University Press, 1997
3. M. Kloster and A. Hansen and P. C. Hemmer, Phys. Rev E 56, 2615-2625(1997). 4. H. E. Daniels, Proc. R. Soc London A 18, 405 (1945).
5. M. Kloster, A. Hansen, and P. C. Hemmer, Phys. Rev. E 56, 2615 (1997). 6. G. G. Batrouni, A. Hansen, and J. Schmittbuhl, Phys. Rev. E 65, 036126 (2002). 7. S. Zapperi, H. J. Herrmann, and S. Roux, Eur. Phys. J. B 17, 131 (2000). 8. A. Delaplace, S. Roux, and G. Pijaudier-Cabot, J Eng. Mech. 127, 646 (2001). 9. J. Knudsen and A. R. Massih, Phys. Rev. E 72, 036129 (2005).
10. F. Raichel, F. Kun, and H. J. Herrmann, Phys. Rev. E 72, 046126 (2005).
11. R. C. Hidalgo, Y. Moreno, F. Kun, and H. J. Herrmann, Phys. Rev. E 65, 046148 (2002). 12. D. Stauffer and A. Aharony, Introduction to Percolation Theory (Taylor and Francis, 1992). 13. A Petri, G. Papano, A. Vegignani, A. Lippi, M. Constantini Phys. Rev. Lett. 73, 3423 (1994). 14. Gy. B. Lenkey, S. Winkler Fatigue Fract. Eng. Mater. Struct. 20, 143 (1997)