ZEW
Zentrum für Europäische Wirtschaftsforschung GmbH C e n t r e f o r E u r o p e a n E c o n o m i c R e s e a r c h
Discussion Paper No. 00-51
Outsourcing of Services,
Imported Materials and the Demand
for Heterogeneous Labour:
An Application of a
Generalised Box-Cox Function
Martin Falk and Bertrand Koebel
Discussion Paper No. 00-51
Outsourcing of Services,
Imported Materials and the Demand
for Heterogeneous Labour:
An Application of a
Generalised Box-Cox Function
Martin Falk and Bertrand Koebel
Die Discussion Papers dienen einer möglichst schnellen Verbreitung von neueren Forschungsarbeiten des ZEW. Die Beiträge liegen in alleiniger Verantwortung
der Autoren und stellen nicht notwendigerweise die Meinung des ZEW dar. Discussion Papers are intended to make results of ZEW research promptly available to other economists in order to encourage discussion and suggestions for revisions. The authors are solely
responsible for the contents which do not necessarily represent the opinion of the ZEW. Download this ZEW Discussion Paper from our ftp server:
A non-technical summary
Over the last decades manufacturers outsourced service inputs and shared
re-sources with competitors. As a result service inputs have been the fastest growing
input factor in German manufacturing, followed by imported materials and highly
skilled labour. Based on input-output tables intermediate services and imported
materials both at constant prices rose by 4.7 and 4.2 percent per year between
1978 and 1990. Most of the rise in intermediate services as a factor of production
in manufacturing can be attributed to the growing importance of business
ser-vices representing
45
percent of total intermediate services in
1990
compared to
35
percent in
1978
. Within business services temporary personal supply services,
consulting, legal service, accounting seems to be the fastest growing business
ser-vices. For instance, between 1978 and 1998 the number of workers in personal
supply services increased by
11
percent per year, the highest employment growth
rate among all business service industries.
For the U.S several empirical studies provide evidence that manufacturing
fi
rms contract out business services to realize labour cost savings. In particular,
low skilled tasks are outsourced because manufacturing
fi
rms have no opportunity
to pursue a di
ff
erent compensation strategy between skilled and unskilled workers.
Most studies, however, focus on international outsourcing proxied by directly
imported intermediate inputs or imported intermediate inputs purchased from the
same two digit industry as the product being produced. Furthermore, outsourcing
of services may also have an impact on the demand for skilled workers. Usually,
outsourcing of services is motivated by the access to new skills. Therefore, it is
also likely that skilled workers are replaced by outsourcing of services.
This study constitutes the
fi
rst attempt to examine the e
ff
ects of the
increas-ing use of service inputs as well as imported materials on heterogeneous labour
demand. We analyse the substitution possibilities more completely than in
previ-ous studies. Furthermore, we formulate a new variant of a Box-Cox cost function
nesting both the normalised quadratic and the translog functional form. The
hy-pothesis that the increasing use of services in manufacturing contributed to the
shift away from unskilled labour has only weak support. However, we found a
signi
fi
cant substitution relationship between high-skilled labour and
intermedi-ate services. This can be partly explained by the fact that intermediintermedi-ate services
mainly consist of skill intensive business services. Furthermore, the e
ff
ects of both
output and capital are more important than price e
ff
ects in explaining the rising
demand towards intermediate services as well as imported materials in
manufac-turing.
Outsourcing, Imports and Labour Demand
∗Martin Falk
Centre for European Economic Research (ZEW), P.O Box 103443, D-68034 Mannheim, [email protected]
Bertrand M. Koebel
Otto-von-Guericke University Magdeburg, [email protected]
Abstract. This paper examines the effects that purchased services and imported intermediate materials have on the labour demand for different skills in the man-ufacturing sector. We derive and estimate a factor demand system based on the generalised Box-Cox cost function nesting both the normalised quadratic and the translog functional form. We find that the impacts of output and capital growth are more important in explaining the demand for heterogeneous labour than substitu-tion effects between labour and non-labour inputs. Similarly, the increasing use of both imported materials and purchased services is rather a consequence of output growth than input substitution.
Keywords: Outsourcing of services, intermediate imports, heterogeneous labour, Box-Cox cost function.
JEL-Classification: J23, O33.
∗We are indebted to two anonymous referees for their constructive comments. We also thank Viktor Steiner
and the seminar participants in Magdeburg and Mannheim. Many thanks goes to Noelle Crist-See and Sandra Kneile for proofreading.
I.
Introduction
There is increasing evidence that the last 30 years have witnessed a dramatic change in the way goods are manufactured and services are provided. During this period, purchased services, imported materials, skilled labour as well as capital have been increasingly used in production. Conversely, firms have begun to replace relatively unskilled workers with other inputs. One explanation for the simultaneous decline in the number of unskilled workers and the strong in-crease in purchased services in manufacturing, is the common practice of outsourcing of services. Anecdotal evidence suggests that a number of workers now employed in low skilled service oc-cupations, such as cleaners, telephone salespersons, or truck drivers, were previously employed by manufacturing firms. Another common explanation is that rising imports of intermediate material inputs have contributed to to the dramatic decline of the employment share of unskilled labor. These observations has raised concerns about the consequences and the driving forces of outsourcing and imports.
This paper examines the impact of purchased services and imported materials on the demand for heterogeneous labour. We analyse the production technology in more detail than in previous studies as we distinguish between seven variable input factors: three types of labour and four components of intermediate materials. As in Morrison-Paul and Siegel (2001), we study the impact of an increase in the quantity of purchased services and imports of intermediate materials on the demand for heterogeneous labour, where purchased services are used as an indicator for outsourcing. In contrast to the authors mentioned, we also investigate the determinants of demand for intermediate imports and purchased services. Furthermore, we are able to provide the total impact of outsourcing and imports on labour demand, which is composed of a quantity (or scale) and a price effect (see Section II).
There are several theoretical and empirical studies on the impact of intermediate imports on heterogeneous labour (see Aghion et al. 1999 for a recent overview). Feenstra and Hanson (1999) investigate the impact of international outsourcing on the relative wage of non-production labour based on 450 U.S. manufacturing industries. They define international outsourcing as imported intermediate inputs purchased from the same two-digit industry. They find that outsourcing can account for at least 15 percent of the increase in the relative wage of non-production workers. In Germany, wages of different skill levels have grown at the same rate of about 4.5 percent per year (see Table 2). Therefore, we focus on the impact of purchased services on the demand for heterogeneous labour rather than on the impact of purchased services on relative wages. For Germany, Steiner and Mohr (1998) find that the shift in demand towards skilled labour is more
pronounced in import-intensive industries than in the remaining industries. However, this effect is rather weak. According to Fitzenberger (1999), who uses two-digit German manufacturing data, the shift in demand away from unskilled labour is mainly a result of technological change rather than a consequence of increasing international trade.
Despite the growing demand for purchased services in manufacturing, the connections be-tween labour demand and the demand for purchased services as well as the determinants of the demand for purchased services have been widely ignored in the literature. To our knowledge, this is the first German study that investigates the effects of the increasing demand for purchased services on the demand for different types of labour. Using four-digit U.S. manufacturing in-dustry data, Morrison-Paul and Siegel (2001) address this issue and estimate a factor demand system for four different educational qualification levels. The authors find that the cost share of purchased services appears to have a relatively small negative impact on the labour demand across all different skill levels. Trade measured as the ratio of imports to output has a similar negative impact on the demand for less educated labour. However, this effect is much weaker than the impact of technological change.
The layout of the paper is as follows. In section II and III we present the theoretical and empirical models. Section IV discusses the data and documents some stylised facts. Section V contains the empirical results and section VI concludes.
II.
The impact of quantities and prices
Let x = (x0
L, x0M)0 ∈ RSL+ ×R+SM denote a vector of variable inputs and p = (p0L, p0M)0 ∈
RSL+ ×RSM+ denote the corresponding vector of prices. These inputs are combined in the activity of production, with some fixed goodsz∈RSz+,among which the level of capital and output. The relationshipf(xL, xM, z) = 0 characterizes the technical production constraints. Both vectorsx
andphave been split into two subvectors. We are thus able to distinguish labour inputsxLfrom intermediate material inputs xM. Let the set XL be composed of all indices corresponding to
labour inputs, andXM be the set of all intermediate material inputs indices (thus, the cardinality
of XL and XM is respectively SL and SM).
The restricted cost function is defined as:
e c(pL, xM, z) = min xL © p0LxL:f(xL, xM, z) = 0 ª = p0LxeL(pL, xM, z).
The relationship between restricted and unrestricted cost functions is well known: c∗(pL, pM, z) = min xL,xM © p0LxL+p0MxM :f(xL, xM, z) = 0ª = min xM © e c(pL, xM, z) +p0MxMª = p0Lx∗L(pL, pM, z) +p0Mx∗M(pL, pM, z), where x∗L(pL, pM, z) =xeL(pL, x∗M(pL, pM, z), z) (1)
denote the unrestricted labour demands.
This framework is useful for identifying the impact of xM, among which purchased services and intermediate imports, on the restricted labour demand functionsxeL. The estimation of this
impact was the purpose of Morrison-Paul and Siegel (2001) who rely on the restricted demands
e
xL to derive the effects of purchased services and imports ∂xei/∂xj(xj/xei), with i ∈ XL and
j ∈ XM. These impacts can also be recovered from the unrestricted demand functions x∗
L.
Indeed, from the relationship between restricted and unrestricted demands (1), it follows that:1
∂x∗ L ∂p0 M = ∂xeL ∂x0 M ∂x∗ M ∂p0 M ⇔ ∂xeL ∂x0 M = ∂x ∗ L ∂p0 M · ∂x∗ M ∂p0 M ¸−1 . (2)
That is, ∂exL/∂x0M can be calculated from the unrestricted demand functionsx∗.
It is easy to show that - once expressed in terms of elasticities - equation (2) becomes
ε¡x∗L, p0M¢=ε¡exL, x0M ¢ ε¡x∗M, p0M¢ (3) ⇔ ε¡xeL, x0M ¢ =ε¡x∗L, p0M¢ £ε¡x∗M, p0M¢¤−1,
where the matrix ε(x∗
L, p0M) has ε(x∗i, pj)≡ ∂x∗i ∂pj pj x∗ i (4) as entries, with i ∈ XL and j ∈ XM. The elasticity matrices ε(exL, x0M) and ε(x∗M, p0M) are
defined accordingly.
From the first line of (3), we can see that even though the impact ofxM on restricted labour
demandsexLmay be important, the impact of input pricespM on unrestricted labour demandsx∗L
can be limited if the own price reactions of material inputs (reflected by the matrixε(x∗M, p0M)) are small.
1We assume that the matrix∂x∗
M/∂p0Mis regular. See Chambers (1988) for a discussion on duality relationships
III.
A variant of the Box-Cox cost function
The vector of variable inputs is defined asx= (xh, xs, xu, xd, xe, xm, xo)0 and the corresponding
input price vector as p= (ph, ps, pu, pd, pe, pm, po)0,where the denomination of the variables is
summarized in Table 1. We consider three categories of labour inputs and split up intermediate materials into four components: (i) domestic non-energy intermediate materials,xd,(ii) energy,
xe, (iii) imported intermediate materials, xm, and (iv) purchased services, xo.The vector z =
(zk, zy, t)0 contains the level of production, zy, the net capital stock at constant prices, zk,
and a time trend t. We identify the vectors xL and xM, introduced in Section II, with xL =
(xh, xs, xu)0, and xM = (xd, xe, xm, xo)0, each vector comprising labour inputs and material inputs components, respectively.
Since empirical estimates of elasticities are shown to be sensitive to the choice of the functional form, we formulate a variant of a Box-Cox cost function that has the advantage of nesting some of the usual specifications. The Box-Cox cost function was initially proposed by Berndt and Khaled (1979). We extend their formulation in order to nest the normalised quadratic and the translog functional form (see Koebel, Falk and Laisney 2000, for details). As the variables may differ across the observations,p, xandzare now supplemented by the subscriptsnandtdenoting industry and time, respectively. The total variable costs are denoted by c and correspond to the total wage bill plus materials expenditures. The Box-Cox transformations are given by
Zjnt = zγ1 jnt−1 γ1 for γ16= 0 lnzjnt for γ1= 0 , j=k, y, (5) Pjnt = (pjnt/(θ0npnt))γ1−1 γ1 for γ1 6= 0 ln (pjnt/(θn0pnt)) for γ1 = 0. , j=h, s, u, d, e, m, o. (6)
Note that in (5), the transformation is not applied to the time trend but only tozkandzy. The
specification of the cost function is
c(pnt, znt;αn) = p0 ntxn1(γ2C(Pnt, Znt;α0n) + 1)1/γ2 p0 ntxn1exp (C(Pnt, Znt;α0n)) for γ26= 0 for γ2= 0 , (7) where C(Pnt, Znt;α0n) =αCn+Pnt0 Apn+Znt0 Az+21Pnt0 AppPnt+Pnt0 ApzZnt+12Znt0 AzzZnt. (8)
The technological parameters to be estimated are gathered in the vector αn = (α00n, γ1, γ2)0, whereα0nentails all free parameters ofαCn, Apn, Az, App, Apz andAzz. Note that the subscript
Table 1: Denomination of the variables Labour inputs (number of workers, full-time equivalent) xL
xh high-skilled labour (workers with a university or polytechnical degree)
xs medium-skilled labour (workers with a certificate from the dual vocational training system plus masters and technicians)
xu low-skilled or unskilled workers (excluding apprentices) Material input components (all in constant prices) xM
xd domestic non-energy intermediate materials (excluding purchased services)
xe energy (including imported energy)
xm imported intermediate materials (excluding purchased services and energy)
xo purchased services (including imports of purchased services)
Fixed characteristics z
zk net capital stock in constant prices
zy gross output in constant prices
t time trend
Input prices (normalised to 1 in 1978)p
ph gross annual labour costs per high-skilled worker
ps gross annual labour costs per medium-skilled worker
pu gross annual labour costs per unskilled worker
pd price index domestic non-energy intermediate materials
pe price index energy
pm price index imported intermediate materials
ncharacterises parameters that are industry-specific. To account for heterogeneous technologies, we introduce some industry-specific parameters αCn and Apn. Just as functional specifications
can barely be justified economically, it is difficult too find a rationale for homogeneous technolo-gies across industries that are as different as chemistry and road vehicles, for example. Thus, we also allow the parametersα0n andγ1, γ2 to vary across broadly defined groups of industries. In particular, we distinguish between durable goods industries and non-durable goods industries.
The parameters γ1 and γ2 merit special attention since they capture the way that variables
pjnt, zjnt and cnt are modified by the Box-Cox transformation. Both the translog and the
normalised quadratic functional forms are nested within the generalised Box-Cox specification and are obtained as special cases, forγ1 →0,γ2 →0 and forγ1= 1, γ2 = 1 respectively. Some restrictions are placed on the parametersα0n so that the cost function is symmetric inpnt and
znt and the number of parameters are parsimonious, see Koebel, Falk and Laisney (2000).
The optimal demand functionsx∗ are obtained fromcthrough the application of Shephard’s Lemma and are used to form the input-output coefficients x∗nt/ynt considered in our regression:
xnt/ynt=x∗(pnt, znt, αn)/ynt+νnt (9)
where x∗(p
nt, znt, αn) = ∂c∗/∂pnt and νnt denotes a residual vector that is uncorrelated with
the explanatory variables, has zero conditional mean and a constant variance matrix. The main reason why we consider input-output coefficients xnt/ynt instead of the demand levels xnt as
explained variables is that the assumption of homoscedastic residuals appears more plausible for the former specification than for the latter. The system of seven factor demands will be estimated using non-linear SUR on panel data.
The terms p0ntxn1 and θn0pnt are introduced in (7) to guarantee that the cost function is
linearly homogeneous in prices. Diewert and Wales (1987) show that there are many possibilities of definingθn and that the flexibility of the above specifications does not depend upon choosing
θnin a particular way. The parametersθnare usually defined as a function of somexnt and cnt,
which can lead to endogeneity problems, because in this case the same variables occur on the left- and right-hand side of (9). To avoid this, we specify
θn= 1 N−1 P i6=nxi1 1 N−1 P i6=nci1 ≡ xn1 cn1 , so that θ0
npnt corresponds to a variant of a Laspeyres price index for total variable costs,
nor-malized to ‘1’ in 1978 (at whicht= 1).
The main hypothesis we want to investigate is whether it is easier to substitute unskilled labour for both purchased services and imported materials than it is to substitute highly skilled
labour for purchased services and imported materials. The substitution effect indicates that a firm will use more of an input whose relative price has decreased. Different impacts of capital accumulation, output growth and time may be further explanations for the shift towards skilled labour and away from unskilled labour. Finally, higher output and time elasticities for both purchased services and imported materials compared to other input factors may also explain the increasing demand for both purchased services and intermediate materials in manufacturing.
IV.
Data and stylised facts
The data used in this study are publicly available from government agencies. The German Federal Statistical Office publishes data on gross output and materials, both in constant and nominal prices and the net capital stock calculated by the perpetual inventory method. National accounts data are supplemented by different components of intermediate materials drawn from Input-Output tables, broken down into 58 product groups. Separate input-output tables are available for imported materials. All input-output tables are deflated using two-digit input price deflators. In order to conserve enough degrees of freedom, we aggregated the 58 types of intermediate materials available for each industry into four main categories (see Appendix A for further details). The German Federal Employment Office provides data on employment at different skill levels. The corresponding data on earnings have been drawn from the Institute for Employment Research (IABS Besch¨aftigtenstichprobe).2
Table 2 presents summary statistics on the average annual change in inputs and output for 26 industries over the period 1978-1990. Purchased services have been the fastest growing input factor in West German manufacturing, followed by high-skilled labour and imported intermedi-ate mintermedi-aterials. During the period 1978-1990, purchased services in constant prices increased by 4.1 percent per year (unweighted mean based on 26 industries). In 1990, West German manu-facturing firms devoted, on average, 17 percent of their gross output to purchased services. Most of the rise in purchased services as a factor of production in manufacturing can be attributed to the growing importance of purchased business services (temporary personnel supply services, consulting, accounting) representing 45 percent of total purchased services in 1990 compared to 35 percent in 1978.3 Looking at individual industries, light industries (textile, leather and
2For further details on the construction of labour inputs as well as wages, see Appendix A and Falk and Koebel
(2001).
3The strong increase in the number of workers in personnel supply services coincides with the increasing
demand for purchased business services as an input of production in manufacturing. During the period 1978-1990, the number of workers in temporary personnel supply services increased by 12.9 percent per year, which is
wearing apparel), paper, wood as well as electronical products have a higher than average share of purchased services in total output. Furthermore, all industries show an increase in their de-mand for purchased services. The largest increase of purchased services with growth rates of 6 percent and more can be found in machinery, vehicles, electronical products, publishing and printing, paper and plastics. The increase in purchased services can also be observed in other industrialised countries. In U.S. manufacturing, Fixler and Siegel (1999) report an increase in the share of purchased services in total costs from 10.1 percent in 1979 to 12.8 percent in 1988, see also Raa and Wolff (2001).
Table 2: Average annual changes in input quantities and factor prices(1) % change in quantities mean s.d. min max
high-skilled labour, xh 3.6 2.2 −1.0 8.3 medium-skilled labour,xs 0.4 1.8 −3.9 4.2 unskilled labour,xu −2.9 2.0 −8.7 0.8 domestic materials, xd 1.1 1.7 −2.6 5.3 energy,xe 1.2 2.1 −3.0 6.0 imported materials,xi 3.5 2.7 0.2 11.1 purchased services,xo 4.1 1.7 1.0 7.6
net capital stock,zk 0.2 2.3 −4.2 4.6
output,zy 1.5 1.8 −1.9 6.5
(1) Average annual growth rate for 26 industries over the period 1978 to 1990.
There is also a strong increase in the demand for imports of intermediate materials (3.5 percent per year). The largest increase in imported materials can be found in plastics, followed by motor vehicles, paper and electronic products. In contrast to imported materials, domestic materials in constant prices grow just slightly over time.
Turning to the input factor prices described in Table 3, we observe that prices of the four materials components grow at a smaller rate than the wages of the different types of workers. Within intermediate materials, imported materials and domestic materials show the slowest price increase. The increase in the price of intermediate imports of about 2.2 percent is smaller than the increase in the price of domestic non-energy materials of about 2.5 percent. The finding of a smaller increase of the price of imported inputs in comparison to the price of domestic inputs the highest employment growth rate among all business service industries.
Table 3: Average annual changes in input prices(1)
% change in prices mean s.d. min max
high-skilled labour, ph 4.6 0.2 4.0 5.1 medium-skilled labour,ps 4.4 0.4 3.5 5.2 unskilled labour, pu 4.6 0.3 4.0 5.3 domestic materials, pd 2.5 0.7 −0.1 3.4 energy, pe 2.9 0.2 2.4 3.3 imported materials,pm 2.2 0.7 0.2 3.2 purchased services,po 2.8 0.2 2.4 3.0
(1) Average annual growth rate for 26 industries over the period 1978 to 1990.
is consistent with Diehl (1999). This difference is highest in light industries (leather, textile, and clothing), where it comprises about one percentage point per year or 10 percent during the period 1978-1990. Finally, the wage structure does not changed very much during the period 1978-1990 (see also Fitzenberger 1999).
V.
Empirical results
The system (9) of seven equations is estimated using non-linearSUR. The pooled model consists of 50 free parameters plus 7×26 parameters for industry dummies that have to be estimated on the basis of 26×9 ×7 observations. To control for heterogeneity across industries, we allow the coefficients to vary across broadly defined groups of industries. Firstly, we split the 26 industries into (i) durable goods industries (13 industries, among them metal products, machinery, transport equipment, electrical machinery) and (ii) non-durable goods industries (13 industries, among them food, chemical products etc.). Secondly, we consider the alternative split sample based on the skill intensity of production and distinguish between skill intensive and non-skill intensive industries. The split sample based on the distinction between durable goods and non-durable goods yields the highest likelihood value. Furthermore, a likelihood ratio test is conducted to test whether the parameters of the cost functions are identical across the two subsamples (at the exception of the industry specific parameters αCn and Apn). The null hypothesis that the parameters are equal across the subsamples is rejected in all cases.4
4The LR-Test is calculated as 2 (3115.9 + 3280.8−6133.1) = 527.2 where the log likelihood value based on
Therefore, we rely on the more disaggregated model that accounts for heterogeneity between durable goods and non-durable goods industries in the remaining part of this section.
Table 4: Estimates of the Box-Cox parameter
Split sample Pooled sample
BC NQ TL BC NQ TL γ1 .474 (.035) (..764036) 1 0 (..724035) 1 0 γ2 .198 (.027) (..154032) 1 0 (..253035) 1 0 Log-L 3115.9 3280.8 6162.6 6298.9 6133.1 5926.8 6038.9 The parametersγ1andγ2capture the way variablespjnt, zjntandcntare modified
by the Box-Cox transformation. Standard errors in parentheses.
Table 4 contains the estimates of the Box-Cox parametersγ1 andγ2 for the pooled and split sample factor demand model. We find that the Box-Cox (BC) parameters γ1 and γ2 are either significantly different from zero or significantly different from one in all of the cases. A likelihood ratio test suggests that the parameters γ1 and γ2, are jointly significantly different from zero and from one, indicating that both the translog and the normalized quadratic functional forms are rejected.
A comparison of the own-price elasticities across the different functional forms shows that the Box-Cox functional form also outperforms the other functional forms on the number of significantly negative own-price elasticities. Although the number of negative own-price elas-ticities ranges between six based on the BC and five or less based on the two other functional forms, the empirical results exhibit some regularity with respect to the specification: none of the cross-price elasticities between labour and non-labour inputs exhibit a sign reversal except for some of the cross-price elasticities between highly skilled workers and non-labour inputs. The own-wage elasticity of highly skilled workers, in absolute terms, is rather large. However, the result is also sensitive to the choice of the functional form. The remaining cross-price elasticities are robust across different functional forms, although the NQ tends to underestimate the size of the price elasticities, in absolute values, compared to both the TL and the BC. Output, time and capital elasticities are also quite similar across the three functional forms. We find little evidence for serial correlation. Unreported results show that the Durbin-Watson statistics (panel Under the null hypothesis, this test statistic is chi-squared distributed with 50 degrees of freedom. The LR-Test value is considerably higher than both the 1 and 5 percent threshold critical values of about 67.5 and 76.1, respectively.
data-adjusted) are close to two for the material input equations and between 1.23 and 1.54 for the three labour demand equations.5
As statistical tests reject the NQ and the TL against the BC, the interpretation of elasticities is mainly based on the BC functional form. Table 5 presents both own-price and cross-price elasticities as well as the corresponding t-values for seven input demands based on the BC functional form and based on the split sample results brought about by the distinction between durable goods and non-durable goods industries. Elasticities are computed for each industry and are evaluated at 1990 data. This gives us 49 price elasticities for each of the 26 industries. We only report the median of the distribution of each elasticity across industries and the t-values indicating the significance level of the median.
Table 5: Price elasticities of factor demand based on split sample results(1)
ε(x∗i, pj) ph ps pu pd pe pm po x∗h −0.828 (−4.67) 0(0.232.48) −(−10..20224) 0(2.615.95) −(−70..28568) −(−00..08184) 0(1.404.20) x∗s 0.015 (0.74) −(−30..39281) 0(0.179.91) 0(0.012.08) −(−50..09526) −(−10..09399) 0(0.076.43) x∗u −0.036 (−1.28) 0(0.353.85) −(−20..42135) −(−20..24109) 0(0.043.78) −(−00..19294) −(−00.048.31) x∗d 0.024 (4.74) 0(0.008.08) −(−20..07633) −(−20..22816) −(−70..11600) 0(4.138.14) 0(0.056.68) x∗ e −0.110 (−2.65) −(−40..18366) 0(0.066.73) −(−00..24349) 0(0.248.86) 0(1.410.78) 0(2.347.84) x∗ m −0.007 (−1.32) −(−10..12239) −(−20..14596) 0(2.323.54) 0(2.112.98) −(−10..17484) −(−10.123.25) x∗ o 0(2.027.04) 0(0.103.82) −0.063 (−0.41) 0(0.080.62) 0(1.090.37) −(−10..10237) −(−40.754.46) (1) Median elasticities across industries for the year 1990. t-value of the actual median in parentheses.
We find no evidence that unskilled labour can be substituted for either imported materials or purchased services. In contrast, we find a significant complementarity relationship between unskilled labour and domestic materials (ε(x∗
u, pd) =−0.24). This indicates that an increase in
the price of domestic materials will decrease the demand for unskilled workers. This empirical result of the relationship of no substitutability between less skilled labour and imported materials is contrary to the findings of Tombazos (1999b) for the U.S. One reason for these different results may to the low share of German imports from newly industrialised countries (NICs) in the Far East.6 Between 1976 and 1985, the value of German imports from these countries as a share
5The Durbin-Watson test is applied to equispaced data.
of total German imports remained stable at around 2.3 percent.7 Between 1986 and 2000, the share slightly increased to around 4 percent.8 Conversely, in the U.S., the share of imports from these countries was 6 percent in 1975 and already reached 7.4 percent in 1980 (see Aw and Roberts 1985).
Highly skilled workers tend to be a substitute for purchased services. The median value of the distribution of the cross-price elasticities of high-skilled labour is 0.40 with respect to the price of purchased services. Whereas the median value is not significantly different from zero, many non-reported elasticities are significant (6 cross-price elasticities are significant at the 5 percent level and further 10 cross-price elasticities are significant at the 10 percent level). Surprisingly, we find a significant substitutability relationship between highly skilled workers and domestic materials. There is also evidence of complementarity between medium-skilled workers and energy on the one hand, and high-skilled workers and energy on the other. Hence, raising energy prices will decrease the demand for both medium- and highly skilled workers. As expected, own-wage elasticities are significantly negative for any of the skill levels. The own-wage elasticities of unskilled workers and medium-skilled workers are−0.42 and−0.39, respectively. We find a positive but insignificant cross-price elasticity between medium-skilled and unskilled labour.9
There are some significant cross-price elasticities between the different material inputs. Signif-icant pairwise substitutability relationships can be found between energy and imported materials and between imported materials and domestic materials. Note that domestic and imported ma-terial inputs are far from being perfect substitutes: ε(x∗
d, pm) = 0.14.This means that changes
in the import price have a small impact on the demand for domestic intermediate materials. Since either cross-price elasticities between different types of materials are either quite small or relative input price movements between different types of materials are negligible, little of the shift in factor demand towards purchased services and imported materials can be explained by price effects.
A possible explanation why several price elasticities are insignificant is the small sample size. For comparison, we also calculate the elasticities of factor demand obtained from pooled data Roberts 1985).
7The data are drawn from the Statistical Office Germany, time series number 4024 and 2085.
8Even more importantly, the share of German imports from Middle and Eastern Europe increased from 7
percent in 1991 to 13 percent in 2000.
9Koebel, Falk and Laisney (2000) find some significant substitutability between highly skilled workers and
medium-skilled workers and between medium-skilled workers and unskilled workers in a model where capital is treated as a flexible input.
consisting of all 26 manufacturing industries.10 As expected, the t-values, in absolute values, are somewhat larger in the pooled model. The positive cross-price elasticity either between medium-skilled labour and purchased services or between highly medium-skilled workers and purchased services turns out to be significant at the 1 percent level. Similarly, the t-value of cross-price elasticity between unskilled workers and imported materials changes from−0.9 to−2.2. Furthermore, we find very few contradictions with respect to the sign of the estimated elasticities based on either pooled data or the split sample.
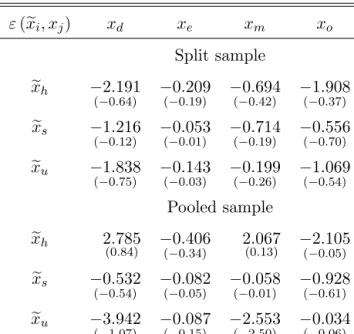
In order to allow for a comparison with earlier studies in which purchased services or imported materials are treated as fixed factors, we also present the scale elasticities of the restricted labour demand functionsxeL which are calculated using formula (3). Table 6 presents the scale
elasticities of the three types of labour, their variance is calculated as explained in Appendix B. Whereas the upper panel contains the scale elasticities based on the more disaggregated model, the lower panel contains the results for the pooled model. Most scale elasticities have a negative sign but are not significantly different from zero. This indicates that the increasing usage of purchased services as well as imported materials tends to reduce the demand for all different skill levels, but the effects are not significantly different from zero. This finding is consistent with Morrison-Paul and Siegel (2001) who investigate U.S. manufacturing. For the estimates based on the pooled model, however, we find a significantly negative impact of imported materials on the demand for unskilled workers. This effect is not robust when we allow for heterogeneity across durables goods and non-durable goods industries.
The estimates ofε(exi, xj) are not very precise and vary highly across the industries, no matter
which split sample is considered. This is related to the fact that the estimated matrixε(x∗M, p0M) in (3) is almost singular for some industries and therefore causes the estimates of ε(xeL, x0M) to
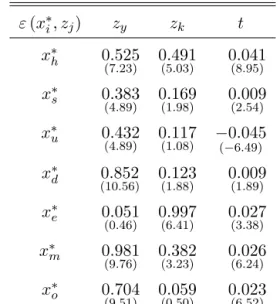
explode. It is a bit comforting that the standard deviations also explode in these cases (see the formulas in appendix B). Briefly, whether the restricted elasticities can be estimated precisely from an unrestricted demand system would be an interesting question to address in further work. Table 7 presents output and time elasticities as well as the impact of capital on factor demand. Output elasticities are significant at the five percent level in all cases except for the output elasticity of energy. Imported and domestic materials as well as purchased services benefit more from output growth than the different skill types of labor. The output elasticities of the different skill levels range between 0.38 for medium-skilled workers and 0.53 for highly skilled workers, while the output elasticities of imported materials and purchased services are 0.98 and 0.70,
Table 6: Scale elasticities of labour demands(1) ε(xei, xj) xd xe xm xo Split sample e xh −2.191 (−0.64) −(−00.209.19) −(−00.694.42) −(−01.908.37) e xs −1.216 (−0.12) −(−00.053.01) −(−00.714.19) −(−00.556.70) e xu −1.838 (−0.75) −(−00.143.03) −(−00.199.26) −(−01.069.54) Pooled sample e xh 2.785 (0.84) −(−00.406.34) 2(0.067.13) −(−02.105.05) e xs −0.532 (−0.54) −(−00.082.05) −(−00.058.01) −(−00.928.61) e xu −3.942 (−1.07) −(−00.087.15) −(−22.553.50) −(−00.034.06) (1) see Table 5.
respectively. Unreported results show that the scale elasticity, ε(c∗, y), is about 0.74 for the split sample results and 0.69 for pooled data. This indicates the presence of increasing returns to scale, a finding that is consistent with Flaig and Rottmann (2001) and Koebel et al. (2000) using a similar data set.11 The low output elasticities of labour demands can be interpreted as evidence for “jobless growth”, pointing out that output growth must be substantial in order to create jobs, given the negative effects of wage increase and labour-saving technological change for unskilled labour.
Calculations for the time elasticities are given in the third column of Table 7. Given the effects of output, capital and input prices, unskilled labour decreases over time while the remaining inputs increases over time. The impact of capital on factor demand is positive in most of the cases, indicating that most input factors benefit from capital accumulation (see column 2 in Table 7). High-skilled labour benefits more from capital growth than all other input factors. In particular, the impact of capital on the different types of labour is increases with the skill level (ε(x∗h, k)≥ε(x∗s, k)≥ε(x∗u, k)) which is consistent with capital-skill complementarity.
11The relatively low output elasticities of different types of workers are partly due to the restricted cost function
framework adopted here. Modelling the capital stock as a variable factor of production results in somewhat higher output elasticities (see Koebel et al. 2000).
Table 7: Output, capital and time elasticities(1) ε(x∗ i, zj) zy zk t x∗ h 0(7.525.23) 0(5.491.03) 0(8.041.95) x∗ s 0(4.383.89) 0(1.169.98) 0(2.009.54) x∗ u 0.432 (4.89) 0(1.117.08) −(−60.045.49) x∗ d (100.852.56) 0(1.123.88) 0(1.009.89) x∗ e 0.051 (0.46) 0(6.997.41) 0(3.027.38) x∗ m 0(9.981.76) 0(3.382.23) 0(6.026.24) x∗ o 0.704 (9.51) 0(0.059.50) 0(6.023.52) (1) see Table 5.
VI.
Conclusion
In West German manufacturing, the demand for both purchased services and imported inter-mediate inputs has been expanding more rapidly than gross output. This paper has made three contributions to the economic analysis of these changes. First, we investigated the input sub-stitution possibilities and the effects of output and capital on input demands more thoroughly than previous studies. In particular, we analysed the impact and the determinants of purchased services and imported materials on the demand for heterogeneous labour. Second, we formu-lated a new variant of a Box-Cox cost function nesting both the normalised quadratic and the translog functional form. Third, we distinguished between both the quantity and price effects of purchased services and imported materials.
We find that the effects of output and capital are more important in explaining the demand for heterogeneous labour than substitution effects between different types of labour with either purchased services or imported materials. Similarly, the increasing demand for both imported materials and purchased services is rather a consequence of output growth than of input substi-tution. Moreover, the empirical results highlight the importance of distinguishing between price and quantity effects of purchased services and imported materials. The quantity effect indicates that the increasing demand for purchased services and imported materials tends to reduce the demand for all different skill levels, but the effects are not significantly different from zero in most of the cases.
VII.
Appendix
Appendix A: Data description
The primary source of the different components of intermediate is the input-output table 1.1 containing product to product tables of the value of commodity iused as an intermediate input by industryj(Fachserie 18, Volkswirtschaftliche Gesamtrechnung, Reihe 2, Input-Output Tabellen). We also use input-output table 1.3 containing the corresponding matrices for im-ported intermediate inputs. These data are available for the years 1978, ’80, ’82, ’84-’88, ’90.12 For each industry, there are 58 types of intermediate inputs available as well as 58 types of imported material inputs. We regroup them into four broadly defined groups, namely:13
• domestic non-energy intermediate materials (excluding purchased services), including 35 elementary intermediate inputs out of a total of 58,
• energy (including imported energy): including 7 elementary intermediate inputs out of a total of 58,
• services (including imported services): including 16 elementary intermediate inputs out of a total of 58,
• imported non-energy intermediate materials (excluding purchased services).
This aggregation yields the total expenditures for each of the four types of intermediate inputs. In order to get the corresponding input-output tables in constant prices, each type of the 58 types of intermediate materials is deflated with the respective price index (producer price indices for domestic outputs supplied to intermediate demand available at the German Statistical Office). Input-output table 1.3 is deflated using price indices of imported materials taken from ’Preisindizes f¨ur die Ein- und Ausfuhr’ (Fachserie 17, Reihe 8, various issues). Intermediate materials in constant prices for the four aggregate intermediate inputs are calculated by adding up the corresponding elementary inputs expressed in constant prices. Then, the corresponding aggregate input prices for the four components of intermediate materials are obtained by dividing the nominal values by the corresponding values in constant prices. This gives the price indices
12The main reason for not using more recent data is that annual input-output tables for Germany for the 1990s
based on NACE, Rev 1 (Statistical Classification of Economic Activities in the European Union) will not be published before mid-2002.
13We do not disaggregate purchased services into imports of purchased services and domestic purchased services.
For West German manufacturing, the share of imported purchased services in total intermediate materials was less than 1 percent in 1990.
pdnt, pent, pmnt,and pont.Finally, we adjust the data from the input-output tables for the small difference with national accounts data.
An important caveat concerns the use of the official prices of service industries as deflators for purchased services. Griliches (1992) points out the difficulty of measuring prices of services, particularly due to the rapid change in the quality of services. Obviously, the increase in the output price of purchased services may be explained to some extent by changes in the quality of purchased services (business services, telecommunication services) rather than by inflationary price changes. If we are overestimating the prices of purchased services, we must be underes-timating their level in constant prices, which suggests that the growth in purchased services in constant prices would be higher than the official statistics state.14
The nominal value and the value at constant prices of gross production, gross materials and the net capital stock are obtained from national accounts. Employment data are provided by the German Federal Employment Office. Labour is transformed into full-time equivalents. Data on gross earnings per full-time unskilled worker and medium-skilled worker are obtained from a one percent random sample from the German Social Security Accounts for the period from 1975 to 1990. Earnings data for the highest skill group are taken from the German Wage and Salary Statistics. Gross earnings per full-time worker are transformed into labour costs by adding the employer’s contribution to social security.
Appendix B: Calculation of the standard errors
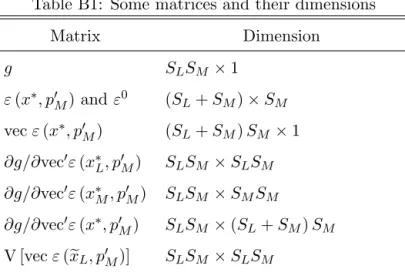
The variance of the restricted elasticities can be obtained as follow. The “delta method” allows us to write vecε(xeL, x0M),the (SLSM×1)-vector stacking-up the elements ofε(xeL, x0M),
in the neighbourhood of the true valuesε0 ≡ε¡x0∗, p0
M ¢ as: vecε(exL, xM) = g ¡ ε¡x∗, p0M¢¢ ' g¡ε0¢+ ∂g ∂vec0ε ¯ ¯ ¯ ¯ ε=ε0 ¡ vecε¡x∗, p0M¢−vecε0¢,
where the (SLSM ×1)-vectorg is defined by
g¡ε¡x∗, p0M¢¢= vec
h
ε¡x∗L, p0M¢ £ε¡x∗M, p0M¢¤−1
i
. (10)
Thus, the variance of vecε(xeL, xM) is related to the variance of vecε(x∗, p0M) by
V£vecε¡xeL, x0M ¢¤ ' ∂g ∂vec0ε ¯ ¯ ¯ ¯ ε=ε0 V£vecε¡x∗, p0M¢¤ ∂g 0 ∂vecε ¯ ¯ ¯ ¯ ε=ε0 .
14A further bias is introduced by the common practice, adopted by many statistical agencies, of using the
As the matrix V [vecε(x∗, p0
M)] is obtained from the regression (9), it is now possible to calculate
V [vecε(exL, x0M)] using the expression for ∂g/∂vec0ε given in (11) and (12) below. Note that
only the elements on the main diagonal of V [vecε(exL, x0
M)] are interesting for our purpose.
From (10) and the properties of the vec operator it follows that
g¡ε¡x∗, p0M¢¢ = ³£ε¡x∗M, p0M¢¤−1⊗IL ´ vecε¡x∗L, p0M¢ = ¡IM⊗ε ¡ x∗L, p0M¢¢vec£ε¡x∗M, p0M¢¤−1,
whereILdenotes the (SL×SL) identity matrix. From the first equality, we obtain that
∂g ∂vec0ε¡x∗ L, p0M ¢=³£ε¡x∗M, p0M¢¤−1⊗IL ´ , (11)
and from the second equality that
∂g ∂vec0ε¡x∗ M, p0M ¢ =−¡IM ⊗ε ¡ x∗L, p0M¢¢ ³£ε¡x∗M, pM0 ¢¤−1⊗£ε¡x∗M, p0M¢¤−1 ´ . (12) Finally, ∂g/vec0ε(x∗, p0
M) is obtained by juxtaposing∂g/vec0ε(x∗L, p0M) and ∂g/vec0ε(x∗M, p0M).
The following table gives the dimensions of the matrices involved in this appendix. Table B1: Some matrices and their dimensions
Matrix Dimension g SLSM ×1 ε(x∗, p0 M) and ε0 (SL+SM)×SM vecε(x∗, p0 M) (SL+SM)SM ×1 ∂g/∂vec0ε(x∗L, pM0 ) SLSM ×SLSM ∂g/∂vec0ε(x∗ M, p0M) SLSM ×SMSM ∂g/∂vec0ε(x∗, p0M) SLSM ×(SL+SM)SM V [vecε(xeL, p0M)] SLSM ×SLSM V [vecε(x∗, p0M)] (SL+SM)SM ×(SL+SM)SM
References
[1] Aghion, P., Caroli E. and Garcia-Pe˜nalosa C. (1999), Inequality and Economic Growth: The Perspective of the New Growth Theories,Journal of Economic Literature 37, 1615-1660. [2] Aw, B. Y. and Roberts M. (1985), The Role of Imports from the Newly Industrializing
[3] Berndt, E. R. and Khaled M. S. (1979), Parametric Productivity Measurement and Choice Among Flexible Functional Forms,Journal of Political Economy 87, 1220-1245.
[4] Chambers, R. G. (1988), Applied Production Analysis: The Dual Approach, Cambridge University Press.
[5] Diehl, M. (1999), The Impact of International Outsourcing on the Skill Structure of Em-ployment: Empirical Evidence from German Manufacturing Industries, Kiel working paper, 946.
[6] Diewert, W. E. and Wales T. J. (1987), Flexible Functional Forms and Global Curvature Conditions,Econometrica 55, 47-68.
[7] Falk, M. and Koebel B. M. (2001), A Dynamic Heterogeneous Labour Demand Model for German Manufacturing,Applied Economics 33, 339-348.
[8] Feenstra, R. C. and Hanson G. H. (1999), The Impact of Outsourcing and High-Technology Capital on Wages: Estimates for the United States, 1979-1990,Quarterly Journal of Eco-nomics 114, 907-941.
[9] Fitzenberger, B. (1999), Wages and Employment Across Skill Groups: An Analysis for West Germany, ZEW Economic Studies 6, Heidelberg, Physica.
[10] Fixler D. J. and Siegel D. (1999), Outsourcing and Productivity Growth in Services, Struc-tural Change and Economic Dynamics 10, 177-194.
[11] Flaig, G. and Rottmann H. (2001), Input Demand and the Short- and Long-Run Employ-ment Thresholds. An Empirical Analysis for the German Manufacturing Sector, German Economic Review 2, 4, 367-384.
[12] Griliches, Z. (1992), Introduction, in Zvi Griliches, ed.Output Measurement in the Service Sector, Chicago: University of Chicago Press, 1–22.
[13] Koebel, B. M., Falk M. and Laisney F. (2000), Imposing and Testing Curvature Conditions on a Generalized Box-Cox Cost Function, ZEW Discussion paper 2000-70, forthcoming, Journal of Business and Economic Statistics.
[14] Morrison-Paul, C. J. and Siegel D. (2001), The Impacts of Technology, Trade, and Out-sourcing on Employment and Labor Composition,Scandinavian Journal of Economics 103, 2, 241-264.
[15] Raa, T. and Wolff E. N. (2001), Outsourcing of Services and the Productivity Recovery in U.S. Manufacturing in the 1980s and 1990s,Journal of Productivity Analysis 16, 2, 149-165. [16] Steiner, V. and Mohr R. (1998), Industrial Change, Stability of Relative Earnings, and Sub-stitution of Unskilled Labor in West-Germany, ZEW Discussion paper, 98-22, Mannheim. [17] Tombazos, C. G. (1999), The Role of Imports in Expanding the Demand Gap Between