Slovenian flash-flood case: application of the Mountain
Reference Technique at C-band frequency
Ludovic Bouilloud, Guy Delrieu, Brice Boudevillain, M. Borga, F. Zanon
To cite this version:
Ludovic Bouilloud, Guy Delrieu, Brice Boudevillain, M. Borga, F. Zanon. Radar rainfall
estima-tion for the post-event analysis of a Slovenian flash-flood case: applicaestima-tion of the Mountain
Ref-erence Technique at C-band frequency. Hydrology and Earth System Sciences, European
Geo-sciences Union, 2009, 13 (7), pp.1349-1360.
<
10.5194/hess-13-1349-2009
>
.
<
insu-00411924
>
HAL Id: insu-00411924
https://hal-insu.archives-ouvertes.fr/insu-00411924
Submitted on 27 Feb 2012
HAL
is a multi-disciplinary open access
archive for the deposit and dissemination of
sci-entific research documents, whether they are
pub-lished or not.
The documents may come from
teaching and research institutions in France or
abroad, or from public or private research centers.
L’archive ouverte pluridisciplinaire
HAL
, est
destin´
ee au d´
epˆ
ot et `
a la diffusion de documents
scientifiques de niveau recherche, publi´
es ou non,
´
emanant des ´
etablissements d’enseignement et de
recherche fran¸
cais ou ´
etrangers, des laboratoires
publics ou priv´
es.
www.hydrol-earth-syst-sci.net/13/1349/2009/ © Author(s) 2009. This work is distributed under the Creative Commons Attribution 3.0 License.
Earth System
Sciences
Radar rainfall estimation for the post-event analysis of a Slovenian
flash-flood case: application of the Mountain Reference Technique
at C-band frequency
L. Bouilloud1, G. Delrieu1, B. Boudevillain1, M. Borga2, and F. Zanon2
1Laboratoire d’´etude des Transferts en Hydrologie et Environnement, Grenoble, France 2Dept. of Land and Agroforest Environment, University of Padova, Legnaro, Italy
Received: 16 December 2008 – Published in Hydrol. Earth Syst. Sci. Discuss.: 30 January 2009 Revised: 29 June 2009 – Accepted: 29 June 2009 – Published: 29 July 2009
Abstract. This article is dedicated to radar rainfall
estima-tion for the post-event analysis of a flash flood that occurred on 18 September 2007 in Slovenia. The utility of the Moun-tain Reference Technique is demonstrated to quantify rain attenuation effects that affect C-band radar measurements in heavy rain. Maximum path-integrated attenuation between 15 and 20 dB were estimated thanks to mountain returns for path-averaged rain rates between 10 and 15 mm h−1over a 120-km path. Assuming the reflectivity-attenuation relation-ship to be known, the proposed technique allows for estimat-ing an effective radar calibration correction factor to be ac-counted for in the parameterization of the attenuation correc-tion. Screening effects are quantified using a geometrical cal-culation based on a digitized terrain model of the region. The vertical structure of the reflectivity is modeled with a nor-malized apparent vertical profile of reflectivity. Implementa-tion of the radar data processing indicates that: (1) the com-bined correction for radar calibration and attenuation effects allows for obtaining satisfactory radar rain estimates (Nash criterion of 0.8 at the event time scale); (2) due to the atten-uation eqatten-uation instability, it is however compulsory to limit the maximum path-integrated attenuation to be corrected to about 10 dB; (3) the results also prove to be sensitive on the parameterization of reflectivity-attenuation-rainrate relation-ships.
1 Introduction
The HYDRATE project funded by the European Commu-nity (http://www.hydrate.tesaf.unipd.it/) aims at improving the scientific basis of flash flood forecasting by extending the understanding of past flash flood events, advancing and
Correspondence to: L. Bouilloud
harmonizing a European-wide innovative flash flood obser-vation strategy and developing a coherent set of technolo-gies and tools for effective early warning systems. Weather radars offer unprecedented means for observing extreme rain events with space and time resolution relevant with respect to the hydrological dynamics of the affected watersheds (e.g., Smith et al. 1996; Ogden et al., 2000; Delrieu et al., 2005). However, the complexity of the radar technology, the variety of uncertainty sources and the variability of precipitation at all scales still make the radar quantitative precipitation esti-mation (QPE) a very challenging task. This is especially true in mountainous regions (e.g., Joss and Waldvogel, 1990; An-drieu et al., 1997; Germann et al., 2006; Delrieu et al., 2009) due to the impact of the orography on the propagation of the electromagnetic waves (clutter due to the relief and anthropic targets; screening; anomalous propagation). The radar QPE quality depends much on the relative locations of the radar and the rain event, the intervening relief, the radar parame-ters, the operating protocol and the data processing (Pellarin et al., 2002).
With respect to the extreme event-driven observation strat-egy promoted in the HYDRATE project, very pragmatic ap-proaches need to be developed to take the best benefit of existing weather radar and raingauge datasets for post-event rainfall estimation in mountainous regions. The present pa-per offers an example with the heavy rains and flash floods that occurred on 18 September 2007 in Slovenia (Fig. 1) causing seven human casualties and damage costs evalu-ated to 285 million Euros. More than 40 municipalities, i.e. about one third of the country, were affected by this event. The town of ˇZelezniki, located at about 50 km north-west of Ljubljana, was particularly affected by the disaster (3 casual-ties, 100 million Euros of damages). The flood swept away cars, buses and severely damaged homes, a hospital and a water treatment plant. The ˇZelezniki town is located on the Selˇska Sora river. The corresponding watershed has an area
Fig. 1. Map of the study area in Slovenia. The terrain contours are displayed with 100-m isolines, the location of daily raingauges with
plus signs, hourly raingauges with black diamonds, the Lisca C-band radar with 50-km range markers. The Sora watershed at ˇZelezniki is delineated in the center of the image with a black contour. The dry-weather clutter (in dBZ) is displayed for the lowest elevation angle (0.5◦).
The reference mountain target used for the MRT application is delineated by the black square, and a zoom is displayed within the inset in the left upper corner. Within the inset, the black ellipse represents the radar bins used for computation.
of approximately 200 km2. The single raingauge within the watershed indicated a rain event mostly concentrated in 5 h with a total amount of 220 mm. The maximum discharge was estimated to 350 m3s−1from an operational station located
downstream of the city. This corresponds to a maximum spe-cific discharge of about 1.75 m3s−1km−2. Such character-istics motivated a post-event survey, conducted by 21 HY-DRATE scientists from different institutions and countries (UK, Italy, France, Greece, Romania, Spain and Slovakia) with the support of the Environmental Agency of the Repub-lic of Slovenia (ARSO; http://www.arso.gov.si/en/). In addi-tion to operaaddi-tional hydrological data, in situ informaaddi-tion was gathered from cross-section surveys to estimate maximum
discharges for ungauged watersheds and from interviews of witnesses to document the chronology of the floods, follow-ing the methodology described by Gaume (2006).
We concentrate in this article on the rainfall estimation problem. The layout of the available rainfall observation sys-tem managed by ARSO is displayed in Fig. 1. It includes a network of 47 raingauges (among them, 14 devices pro-vide time series at the hourly time step while the remaining ones are daily raingauges) and a modern volume-scanning Doppler C-band radar located in Lisca at about 80–100 km from the affected watershed. As such, this example is quite representative of the post-event analysis context with radar data coming from a rather remote system, a relatively dense
network of daily raingauges and few hourly raingauge time series. The overall strategy is therefore to use the raingauge data to control/assess the radar data processing prior to using the radar QPE space-time series as input in rainfall-runoff models. A first aim of the present contribution is to test the utility of the Mountain Reference Technique (MRT) for quantifying and correcting rain attenuation effects that are likely to severely affect C-band radar measurements in heavy rain (Delrieu et al., 2000). The MRT refers to the Surface Reference Technique proposed by Meneghini et al. (1983) for rainfall measurement at attenuating wavelengths in space-borne radar configurations. The concept is based on the es-timation of path-integrated attenuation (PIA) from the dif-ference between the Earth surface radar return in the pres-ence and in the abspres-ence of rain. Such measurements can be used in various ways to estimate the average rain rate over the propagation path and/or to constrain rain rate profiling algo-rithms (Marzoug and Amayenc, 1994). Feasibility of apply-ing this technique to ground-based radars with mountain re-turns was already demonstrated for the X-band, a frequency band severely prone to rain attenuation effects (Delrieu et al., 1997; Serrar et al., 2000).
Section 2 shows evidence of very significant rain atten-uation effects at C-band for the Slovenian case. The way such PIAs can be used to correct attenuation over the en-tire radar detection domain is the subject of Sect. 3. In Sect. 4, the attenuation correction is placed in the broader context of the radar quantitative precipitation estimation, using the TRADHy radar processing system developed at LTHE (Delrieu et al., 2009; TRADHy stands for Traite-ments R´egionalis´es et Adaptatifs de donn´ees radar pour l’Hydrologie / regionalized and adaptive radar data process-ing for hydrological applications). Section 5 provides a se-ries of sensitivity tests and assessments of the radar QPEs with respect to raingauge data. Finally, the main results of this work are summarized in Sect. 6.
2 Evidence of rain attenuation at C-band using mountain returns
Table 1 lists the parameters of the Lisca C-band radar. Figure 1 displays the dry-weather ground clutter for the lowest radar elevation angle (0.5◦) averaged over a 7-h period preceding the 18 September 2007 rain event. It should be noted that raw reflectivity data is (fortunately) stored by ARSO in polar for-mat, prior to and after implementation of the ground clutter filtering technique. The ground-cluttered reflectivity data is quite naturally not used in any manner in operational practice although we are going to show it contains valuable informa-tion for radar QPE. As the reference target, we selected a strong ground clutter pattern that can be seen at about 20 km in the North-west direction of the ˇZelezniki watershed (de-lineated by the inset in Fig. 1). Figure 2 shows the time evo-lution of the average value of the reference target together
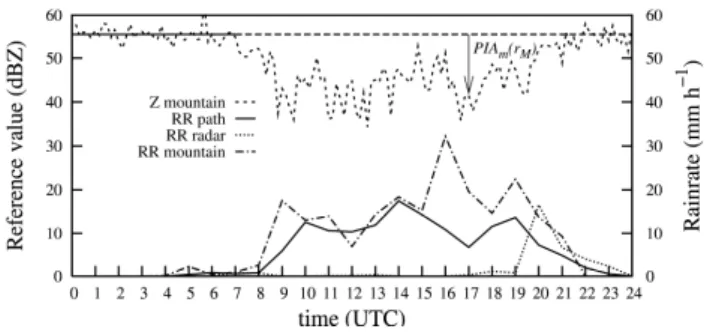
Fig. 2. Time series of the mountain reference target value (dashed
line on top), the average rainrate along the path (bottom part of the graph, continuous line), the rainrate in the vicinity of the mountain (dash-dotted line) and the rainrate close to the radar site (dotted line).
with various rainfall indicators derived from the raingauge network measurements: these include (1) the average rain-rate along the radar – reference target path obtained with the available hourly raingauges through the Thiessen technique; (2) the rainrate time series of the closest raingauge to the ref-erence target and (3) the rainrate time series of the closest raingauge to the radar site. The intensity of the reference get decreases when rain occurs between the radar and the tar-get and it recovers its initial value at the end of the rain event. The PIA reaches maximum values between 15 and 20 dB for path-averaged rain rates between 10 and 15 mm h−1over a
120-km path. Such high PIA values at C-band were already observed (Geotis, 1975) or simulated (Delrieu et al., 2000). For the hydrologists not familiar with dB units, these PIA values correspond to multiplicative factors of 31.6 and 100, respectively, on the reflectivity and to multiplicative factors of 10 and 21.5, respectively, on the rain rate if the exponent of theZ-R relationship is equal to 1.5. Compared to the hourly rainrate time series, it is noteworthy that the reference target time series presents a rather high degree of fluctua-tion from one step to the next. This is related to the fact that the reflectivity measurements are made instantaneously once every 10 min. The rain event was also characterized by fast-moving convective cells, which may also contribute to increase the noise in the reference target time series. Like attenuation measurement with microwave links (e.g., Leijnse et al., 2007), the PIA estimation in the present configura-tion may also be affected by on-site effects. Since the Lisca C-band radar is equipped with a radome, special care needs to be taken when and after rainfall occurs at the radar site: the presence of a water film on the radome is known to pro-duce attenuation effects of several dB (Collier, 1989). Fortu-nately, rainfall occurred at the radar site only at the end of the rain event, well after the intense rainy period in the ˇZelezniki area. Rainfall falling over the reference target may also af-fect the PIA estimation (negative bias) as shown by Delrieu et al. (1999b) who proposed a simple approach to cope with this effect.
3 Attenuation correction
We recall hereafter the principle of the MRT and the way the attenuation correction parameters are estimated. Details may be found in Marzoug and Amayenc (1994), Delrieu et al. (1997) and Serrar et al. (2000).
3.1 Principle of the Mountain Reference Technique
Let us define the measured rain reflectivity factor profile
Zm(r)[mm6m−3] as:
Zm(r)=Z(r)δcA(r) (1)
whereris the range,Z[mm6m−3] is the true reflectivity
fac-tor,δc [−] is a radar calibration correction factor,A(r)[−]
is the rain attenuation factor along the path from the radar to ranger. In Eq. (1), only two sources of error are consid-ered: a possible radar miscalibration supposed to be constant in time (i.e. we assume that the transmitter-receiver unit is stable within the measurement period) and the effect of at-tenuation by rainfall between the radar and ranger.
The PIA factor is given by:
A(r) = exp − 2 ln(10) 10 Z r 0 k(s) ds (2)
wherekis the attenuation coefficient [in dB km−1] that de-pends on the working wavelength and on the rain drop size distribution (DSD) and temperature. We define the PIA in dB units as PIA(r) = −10 log A(r).
Assuming that the relation between the reflectivity fac-tor and the attenuation coefficient can be satisfacfac-torily rep-resented by a power law model, with Z = αkβ, it can be
shown (Marzoug and Amayenc, 1994; Delrieu, et al. 1997) that: A(r)= " A(r0)1/β − S(r0, r) δc1/β #β (3) with S(r0, r)= 2 ln(10) 10β Z r r0 Z m(s) α 1/β ds (4)
In Eq. (3),r0 represents the so-called “blind range”, that is
the range where the reflectivity sampling is started and/or where the reflectivities can be considered as free of ground clutter due to side lobes. The termA(r0)is related to both
radome attenuation and rain attenuation between 0 andr0.
Equations (3) and (4) indicate that the PIA factor at any range
rcan be obtained as a function of the measured reflectivity profileZm(r), the coefficientsαandβ of theZ-k relation-ship, the blind range attenuation factorA(r0)and the
calibra-tion errorδc.
Table 1. Lisca C-band radar parameters.
Parameter Value(s)
Geographical coordinates Lat = 46.068◦, Lon = 15.290◦, Alt = 950 m m.s.l. Measured parameters Reflectivity, radial velocity, spectrum width
Wavelength (cm) 5.34
Peak power (kW) 300
PRF (Hz) 600, 1200
Pulse length (µs) 0.8
Minimum detectable signal (dBm) −110
Antenna diameter (m) 4.2
3-dB beamwidth (◦) 0.9
Power gain (dB) 43.8
Operating protocol 12 elevations; revisit time of 10 min 0.5, 1.0 1.6, 2.4, 3.4, 4.7, 6.3, 8.6◦(3 rpm; 600 Hz)
11.5, 15.5, 20.9, 28.4◦(3 rpm; 1200 Hz) Polar data reflectivity quantization −30 up to 90 dBZ with 0.5 dBZ increment Polar data resolution 1000 m (radial); 1◦(angular); from 1 to 250 km
If we consider a range rM where a reference target (a mountain here) is available, the PIA calculated from the mea-sured reflectivity profile (PIAc(rM)hereafter) can be written as: PIAc(rM)= −10 log " A(r0)1/β− S(r0, rM) δc1/β #β (5)
The simplest estimator for the PIA from mountain returns can be expressed through the following equation:
PIAm(rM)= −10 log " Zdryref(rM) Zrainref(rM) # (6)
whereZdryref(rM)andZrainref(rM)are the mean reflectivity of the reference target during dry and rainy time steps, respec-tively. The practical procedure for estimating PIAm(rM)is described in Delrieu et al. (1999b): this includes the defini-tion of a baseline and consideradefini-tion of rainfall falling over the reference target. The so-called PIA constraint equation stipulates that the PIA calculated at rangerM from the re-flectivity profile should be equal to the PIA derived from the mountain return at any timet during the rain event:
PIAc(rM, t ) ≡ PIAm(rM, t ) (7)
3.2 Parameter estimation
Equations (4), (5), and (6) show that the PIA constraint Eq. (7) depends on three parameters: the coefficientsαand
β of the Z-k relationship and the radar calibration factor
δC. Besides the mean reflectivity of the reference target and the measured reflectivity profiles between the radar and the mountain, specification of the blind-range attenuationA(r0)
is required. As already mentioned, rainfall occurred at the radar site only at the end of the rain event (Fig. 2). The PIA values of the corresponding time steps were then simply dis-carded from the optimization procedure. The blind-range at-tenuation factorA(r0)was supposed to be equal to 1 in the
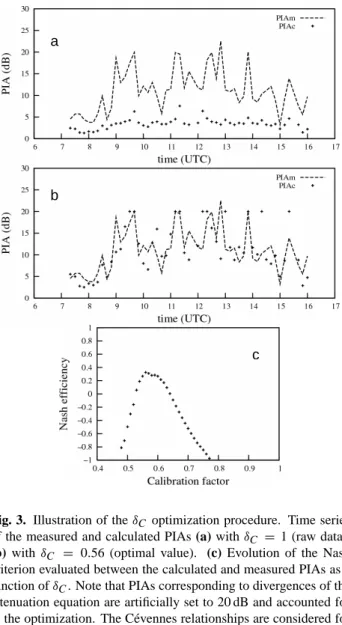
Table 2. Coefficients of theZ=αkβ andZ =aRbrelationships for the C-band frequency and a raindrop temperature of 10◦C using the
Mie scattering model and DSD models proposed in the literature (see the review in Delrieu et al., 2000). The other columns give the optimal radar calibration factorδC, the Nash criterion (Nash) between the measured and calculated PIAs and the number of divergences (Ndiv) of the
attenuation equation for the optimalδCvalue;Nis the total number of PIA pairs considered for the optimization.
DSD model Z- k relationship Z-R relationship δC Nash Ndiv N
Z[mm6m−3]; Z[mm6m−3]; [−] [−] [−] [−] k[dB km−1] R[mm h−1] α β a b Widespread 5.39×10⁵ 1.16 242 1.43 0.59 0.37 7 51 rainfall C´evennes 4.98×10⁵ 1.09 362 1.40 0.56 0.33 10 51 rainfall Thunderstorm 4.75×10⁵ 1.05 533 1.36 0.55 0.28 10 51 rainfall
Like in previous work (Delrieu et al., 1997; Serrar et al., 2000), we choose here to optimize the radar calibration fac-torδC, assuming the DSD and the subsequentZ-k relation-ship to be known. Since no DSD data were available for the Slovenian case, we actually considered a series ofZ-k rela-tionships calculated from various DSD models described in the literature and summarized in Delrieu et al., 2000. This in-cludes DSD models valid for widespread and thunderstorm rainfall and a C´evennes DSD model established in a French region prone to intense and long-lasting rain events resulting mostly from shallow convection triggered by the orography. The correspondingZ-k andZ-R relationships coefficients calculated for the C-band frequency using the Mie scattering model are listed in Table 2.
For the optimization, we used the radar data from the low-est elevation (0.5◦). The reflectivity profile was extracted from the ground-clutter processed data and the reference val-ues from the raw reflectivity data. Considering synchronous measurements for the PIA and the reflectivity profiles proved to be important in the present case study due to the fast dy-namics of the convective cells. We choose the Nash effi-ciency between the calculated and measured PIAs as the op-timization criterion. It can be noticed however that the PIA can be calculated from Eq. (5) only if Sm(r0, rM)/δc1/β < 1 (since A(r0) = 1 here). Such a condition may not be
fulfilled for a growing number of profiles asδC decreases. These situations correspond to the well-known divergences of the forward attenuation correction scheme (e.g., Marzoug and Amayenc, 1994), also known as the Hitschfeld-Bordan algorithm. It may happen however that divergences occur for a number of comparison points while the consideredδC value is optimal for the majority of points. To cope with this problem, we have limited the calculated PIA to the max-imum measured value (20 dB) and we have accounted for such capped calculated PIA values in the optimization crite-rion evaluation. Illustrations of the optimization procedure
for the C´evennes Z-k relationship are presented in Fig. 3. The optimization results are listed in Table 2 for the various
Z-k relationships. Interestingly, the optimalδC values are very similar for the threeZ-k relationships: the factors are between 0.55 and 0.59 corresponding to a radar underestima-tion of 2.6 and 2.5 dBZ, respectively. Note that such factors compensate for a radar calibration error and also for the bias due to an eventual mismatch of the consideredZ-k relation-ship. The similarity of the correction factors from oneZ-k
relationship to the next does not necessarily mean that such a bias is negligible but rather that theZ-krelationships tested lead to similar PIA values for the range of rainrates observed. Once the parameters of the attenuation equation have been estimated, Eqs. (1) and (4) form the basis for the Hitschfeld-Bordan algorithm. As already mentioned, such an algorithm may diverge; Delrieu et al. (1999a) proposed to limit the maximum PIA to be corrected to a pre-fixed value comprised between 10 and 20 dB, regardless of the considered wave-length. We will test in Sect. 5 the influence of such an addi-tional parameter in terms of rainfall estimation.
4 Radar quantitative precipitation estimation
We examine hereafter other error sources in radar QPE and the way they interact with the attenuation problem. In the first subsection, a general discussion is proposed together with a brief description of the TRADHy software used in this work. Subsection 4.2 and 4.3 are dedicated to the anal-ysis of screening and vertical profile of reflectivity effects, respectively, for the Slovenian case.
4.1 Physically-based data processing for radar QPE
Expanding the weather radar equation (see for instance Doviak and Zrnic, 1993, chapter 4), one may write a more detailed expression for the measured reflectivity factor
compared to Eq. (1) as: Zm(r)=δCr2 Z Z Z V A(s, θ, φ) S(s, θ, φ) W (s, θ, φ) η(s, θ, φ) s4 dV (8)
where(s, θ, φ)are spherical coordinates of a given elemen-tary volume of atmosphere relative to the radar location and
V [L3] is the radar resolution volume. The reflectivityη(sum of the backscattering cross sections of the hydrometeors per unit volume, [L2L−3]) is proportional to the reflectivity fac-torZ [L6L−3]. The functionW [−] represents the product of the radial and angular weighting functions associated with the transmitter-receiver and the antenna characteristics, re-spectively. LetS andA [−] be the screening and the rain
attenuation factors, respectively. Equation (8) is useful to illustrate that: (1) a radar measurement is an integral over a volume (which size and height above the ground evolve as a function of range); (2) more standard expressions for the weather radar equation assume the reflectivity to be ho-mogeneous over the radar resolution volume, while a well-known source of reflectivity heterogeneity is associated with the vertical variation of the temperature and DSD profiles; (3) screening and rain attenuation may introduce additional sources of heterogeneity along the radial direction. Screen-ing effects generally affect only part of the radar resolution volume. Non-uniform beam filling was also shown to sig-nificantly alter attenuation correction schemes (e.g., Gosset and Zawadzki, 2001). Equation (8) expresses the complexity of the radar QPE which is likely to be affected by instru-mental and sampling errors. These errors are associated with the high variability of rainfall and with environmental factors resulting in significant heterogeneity within the radar resolu-tion volume.
Delrieu et al. (2009) have described a developmental radar QPE processing system called TRADHy. The TRADHy strategy, focused on radar QPE from non-coherent volume scanning data, consists of four steps. A pre-processing step is aimed at checking radar calibration stability, determining the detection domain and characterizing dry-weather clutter. During the course of a rain event, identifications are carried out to dynamically determine clutter, rain types and the responding vertical profiles of reflectivity (VPR). Next, cor-rections for both clutter and screening effects, along with a projection of measured reflectivities onto the ground level us-ing rain-typed VPRs are performed. As a final step, rainfall is estimated at ground level by considering reflectivity-rain rate conversion that may depend on rain type. A strong con-straint imposed is to use only radar data for such a processing sequence. Rain gauge measurements are reserved for assess-ing the radar QPE and build error models. TRADHy was developed so far for non-attenuated radar frequencies (e.g., S-band). Preliminary consideration of the rain attenuation at C-band is proposed in the present article for the Slovenian case.
a
b
c
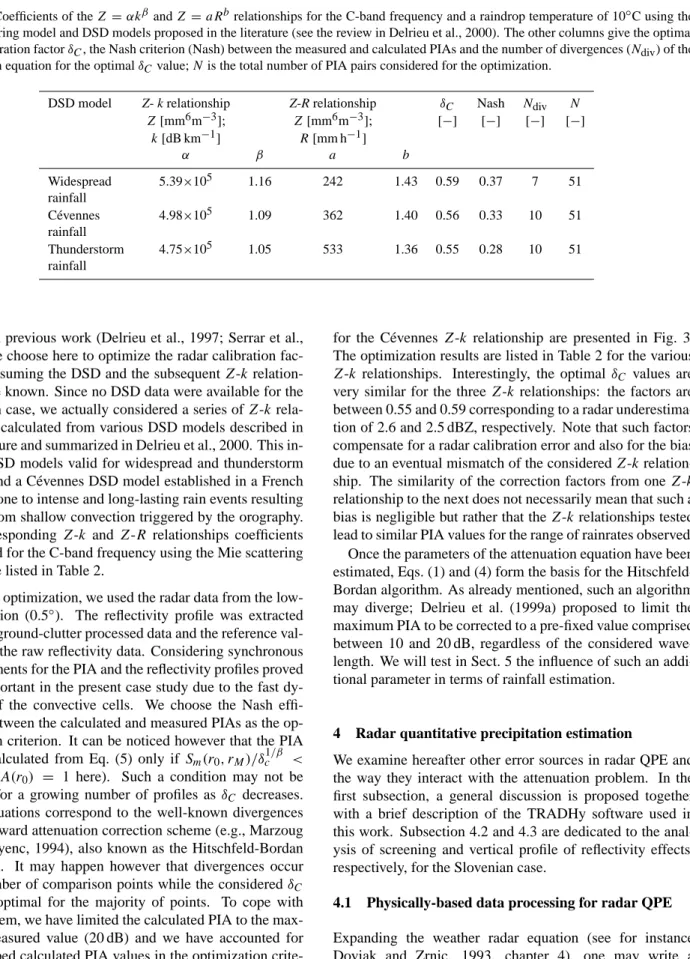
Fig. 3. Illustration of theδC optimization procedure. Time series
of the measured and calculated PIAs (a) withδC = 1 (raw data),
(b) withδC = 0.56 (optimal value). (c) Evolution of the Nash
criterion evaluated between the calculated and measured PIAs as a function ofδC. Note that PIAs corresponding to divergences of the
attenuation equation are artificially set to 20 dB and accounted for in the optimization. The C´evennes relationships are considered for the DSD parameterization.
4.2 Ground clutter and screening effects
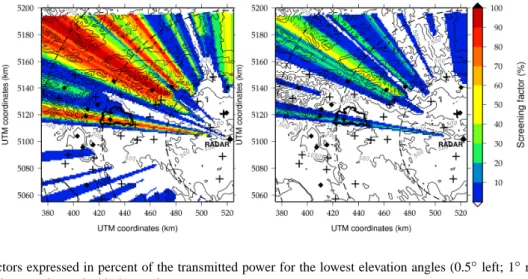
Figure 1 shows ground clutter derived from dry-weather radar images. Figure 2 illustrates the stability of ground clutter prior to and after the rain event, an indication of the probable stability of the transmitter-receiver unit during the rain event. To complement the characterization of the radar detection domain, simulations of the screening effects were realized with a digital terrain according to the procedure de-scribed by Delrieu et al. (1995). Figure 4 shows the results obtained for the lowest elevation angles (0.5◦and 1◦). The mountains induce very significant screening effects. Higher elevation angles are basically free of screening effects. Note that a narrow but severe mask affects the ˇZelezniki watershed with total occultation over the southern part of the watershed for the 0.5◦ angle while the maximum screening factor is
Fig. 4. Screening factors expressed in percent of the transmitted power for the lowest elevation angles (0.5◦left; 1◦right). Note that the
watershed of interest is severely masked in its southern part.
equal to 30% for the 1◦angle. Since the information for these two elevation angles is critical for the QPE over the water-shed, we have implemented a screening correction based on a simple interpolation scheme of adjacent angular reflectiv-ity values for the two lowest elevation angles. For the larger screening effects in the north-east part of the detection do-main, the correction was based on the calculated screening factors (Fig. 4). The screening correction is performed prior to the attenuation correction because of the dependence of the latter on the rainfall occurring between the radar and the range cell of interest.
4.3 Vertical profiles of reflectivity
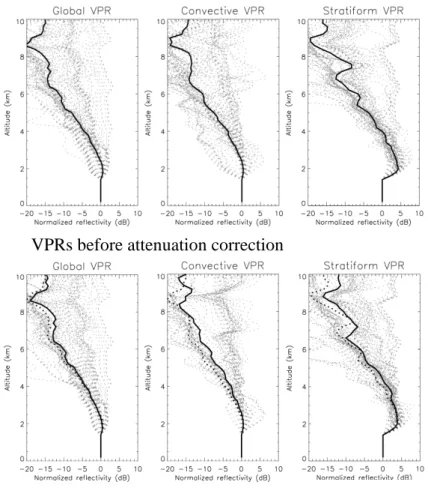
Figure 5 displays the vertical profiles of reflectivity estimated for the 18 September 2007 case. We simply consider here apparent VPRs (Delrieu et al., 2009) calculated by averag-ing measured reflectivities in a given radar range, 20–90 km here. Such profiles are normalized by mean reflectivity val-ues observed close to the ground. We considered an altitude range of 0–1500 m m.s.l. in the present case since the radar altitude is already 950 m m.s.l. With this basic approach, the VPR shape remains influenced (smoothed) by the beam sampling effects, especially in case of sharp vertical gradi-ents related for instance to the presence of a bright band. The normalized apparent VPRs calculated every 10 min us-ing a one-hour movus-ing time window and the median pro-file are displayed in Fig. 5. In addition to the VPRs cal-culated globally over the chosen geographical domain, we realized VPR estimations after separating convective and stratiform regions using variants of the Steiner et al. (1995) and Sanchez-Diezma et al. (2000) algorithms, respectively. The individual VPRs present a rather high variability with slopes between 0 and −4 dB/km above 3 km m.s.l. The
median VPRs are very similar for the global and convec-tive cases with a slope of −3.6 dB/km above 3 km m.s.l.
The median of the stratiform VPRs exhibits a smooth peak between 2000 and 4000 m m.s.l. compatible with the ra-diosoundings available in Udine, Italy, located at about 100 km east of the region of interest: the 0◦C isotherm varied there from 3800 m m.s.l. on 18 September 2007 00:00 UTC to 4000 m m.s.l. on 18 September 2007 12:00 UTC and 2700 m m.s.l. on 19 September 2007 00:00 UTC. During the most intense part of the rain event (between 07:00 UTC and 14:00 UTC), convection was however the dominant process in the ˇZelezniki region, while the stratification of the rain system was observed behind the squall line which occurred during the cold front passage between 19:00 and 21:00 UTC. To show the influence of rain attenuation, the VPRs esti-mated prior to and after the attenuation correction are also displayed in Fig. 5. Interestingly, the attenuation correction increases the slope of the VPRs for both the convective and stratiform cases. This could be simply explained by the fact that the rain paths are longer for low elevation angles com-pared to those of upper elevations. On average, the attenu-ation correction is therefore stronger for low elevattenu-ation mea-surements, resulting in higher normalization values for the VPRs, and the observed increased VPR slopes.
Due to the convection predominance in the region of the affected watershed, the similarity of the convective and global mean VPRs and the non availability of local rain-typed (Z, k, R) relationships, we have used the global VPR to represent the vertical variation of the reflectivity in the fol-lowing section.
5 Radar QPE assessment
The radar QPE was implemented for various choices and pa-rameterizations of the processing algorithms. Focus is given hereafter to the sensitivity of the attenuation correction on the (Z, k, R) relationships used, the calibration error and the
VPRs after attenuation correction
VPRs before attenuation correction
Fig. 5. Normalized vertical profiles of reflectivity after (top) and before (bottom) attenuation correction, estimated globally (left) and for the
convective (center) and stratiform (right) regions of the precipitating system. The grey curves correspond to individual VPRs estimated every 10 min over a 60-min time moving window. The continuous line is the median normalized VPR. In the bottom figures, the black dotted lines show the median normalized VPR shown in top graphs to ease the comparison.
maximum PIA value considered in the Hitschfeld-Bordan algorithm. The radar QPE performance was assessed with respect to the rain total amounts observed with the ARSO raingauge network. Note that the raingauge data were criti-cally analyzed with a geostatistical method aimed at detect-ing the most obvious inconsistencies between neighbourdetect-ing stations. Considering large integration time steps such as the event time step is certainly efficient to minimizing raingauge random errors. However systematic errors, associated for instance with wind-induced undercatch, may be substantial for this rain event. Classical assessment criteria such as the mean error, the determination coefficient (square of the linear correlation coefficient) and the Nash efficiency were evalu-ated. The values of the assessment criteria are listed in Ta-ble 3; examples of radar-raingauge scatterplots are displayed in Fig. 6.
The raw reflectivity values, simply corrected for screen-ing and VPR effects and then converted into rainrates with aZ-Rrelationship, severely underestimate the observed rain
amounts (first line in Table 3 and Fig. 6a). Application of the
δC correction alone brings a significant, though insufficient, improvement as can be seen in the second line of Table 3 and Fig. 6b. The combined correction for calibration and attenu-ation proves to be both effective in improving the radar QPE but also very sensitive on the maximum corrected PIA value used (lines 3–5 in Table 3; Fig. 6c–d). The better estimations are obtained for the 10 dB maximum PIA for the C´evennes (Z, k, R) relationships. Note in particular that the values greater than 150 mm, corresponding to the most intense rain-fall pattern, are almost unbiased and present a small scat-ter. The higher scatter observed for lower rain amount values is related to poor corrections for both the screening effects (comparison pairs represented by triangles in Fig. 6) in the north-west part of the radar detection domain and for com-parison points at ranges greater than 120 km (comcom-parison points represented by crosses in Fig. 6). Although PIA values up to 20 dB were observed between the radar and the moun-tain reference target (Fig. 2), application of this threshold
Table 3. QPE assessment for various parameterizations of the radar data processing.
(Z, k, R) δC Attenuation Max VPR Nash Mean
Determi-relationships correction PIA criterion Error nation
(dB) (mm) coefficient
C´evennes 1.00 no − Median −0.43 −68.9 0.55
C´evennes 0.56 no − Median 0.07 −50.9 0.61
C´evennes 0.56 yes 10 Median 0.82 −11.9 0.85
C´evennes 0.56 yes 10 Time-adaptive 0.80 −16.8 0.85
C´evennes 0.56 yes 15 Median 0.79 −2.9 0.82
C´evennes 0.56 yes 20 Median 0.59 15.0 0.80
Widespread 0.59 yes 10 Median 0.82 4.4 0.85
Widespread 0.59 yes 15 Median 0.75 10.0 0.85
Widespread 0.59 yes 20 Median 0.57 18.6 0.82
Thunderstorm 0.55 yes 10 Median 0.68 −27.6 0.81
Thunderstorm 0.55 yes 15 Median 0.70 −16.0 0.74
Thunderstorm 0.55 yes 20 Median 0.55 1.4 0.66
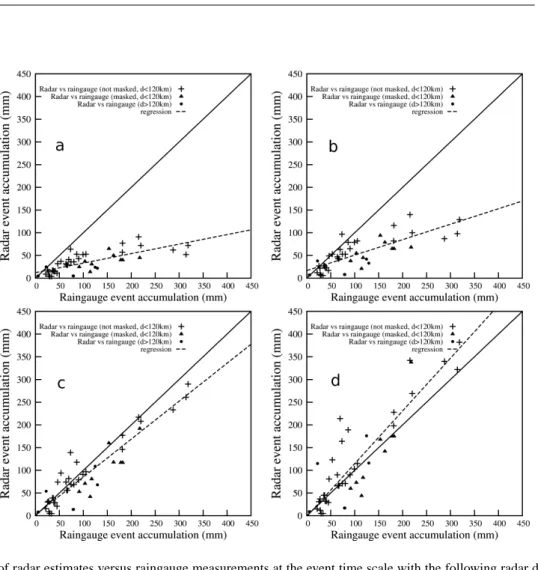
Fig. 6. Scatterplots of radar estimates versus raingauge measurements at the event time scale with the following radar data processing: (a)
screening and VPR correction of the raw reflectivity; (b) in addition, theδCcorrection is performed; (c) in addition, the attenuation correction
is performed with a maximum corrected PIA of 10 dB; (d) same as (c) with a maximum corrected PIA of 20 dB. The C´evennes (Z, k, R) relationships are used.
yields to unacceptable QPE overestimations (Fig. 6d). The assessment criteria are very significantly downgraded com-pared to both the 10 dB and 15 dB thresholds (Table 3). As suggested by Delrieu et al. (1999a), the former threshold ap-pears as a good compromise here with the implementation conditions considered (adjustment for the radar calibration error, unique set of (Z, k, R) relationships). Finally, Fig. 7 allows for a comparison of the raingauge observations spa-tialized with the Kriging technique with the radar estimates obtained with the MRT technique (PIA threshold of 10 dB).
Comparison of the results obtained with the three sets of (Z, k, R) relationships indicates that the widespread and C´evennes relationships lead to good and almost equivalent results (with a slight superiority for the widespread relation-ships parameterization, however) while the radar QPE for the thunderstorm relationships lead to worse results. In particu-lar, although the radar calibration factor was adjusted, the radar QPE remains significantly underestimated in that case for the 10 and 15 dB PIA thresholds while the attenuation equation instability worsen the estimates for the 20 dB PIA threshold. Such results call for several comments. Firstly, a certain degree of equifinality is likely for the attenuation cor-rection parameterization and the adjustment of the calibra-tion factor allows compensacalibra-tion for part of the possible inad-equacy of theZ-krelationship. It should be noted that since the MRT works with PIA estimates and allows for an adjust-ment of the radar calibration for a givenZ-krelationship, the
Z-Rconversion is not optimized in any manner in this pro-cedure. Using (Z, k, R) models consistent with the under-lying DSDs is therefore particularly critical for such an ap-proach. In this respect however, the fact that the widespread relationships yield the best results for this convective event il-lustrate the gap between physical parameterizations that can be determined over small volumes with disdrometers and the effective parameterizations at the scale of the radar resolution volume.
As a final test, lines 3 and 4 in Table 3 allow compari-son of the results obtained by considering a time-adaptive global VPR and the median global VPR. The latter solution yields the better results and it was then preferred in the radar QPE implementation for the other simulations listed in Ta-ble 3. Consideration of rain-typed VPRs (not shown here) also proved to slightly downgrade the radar QPE perfor-mance. This tends to indicate the lack of consistency of some of the individual VPRs and the need to make adaptive correc-tions more robust.
6 Conclusions
This article is dedicated to radar rainfall estimation for the post-event analysis of a flash flood event that occurred on 18 September 2007 in Slovenia. The utility of the Moun-tain Reference Technique (MRT) is demonstrated to quantify
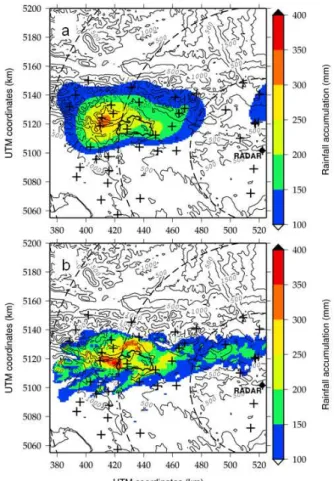
Fig. 7. Raingauge (a) and radar (b) rainfall fields at the event time
scale for rainfall values greater than 100 mm. The radar estimates are obtained with the MRT technique by considering the C´evennes DSD parameterization and a PIA threshold of 10 dB.
and correct rain attenuation effects that affect C-band radar measurements in heavy rain. Maximum PIAs between 15 and 20 dB are measured using mountain returns for path-averaged rain rates between 10 and 15 mm h−1over a
120-km path. By considering the PIA constraint equation, the MRT allows estimation of an effective radar calibration cor-rection factor, assuming a DSD model and the subsequent (Z, k, R) relationships to be known. Besides rain attenua-tion, screening effects are quantified using a geometrical cal-culation based on a digitized terrain model of the region. A narrow mask affecting the two lowest elevation angles above the ˇZelezniki watershed complicates the estimation problem for this region of special interest. The vertical structure of the reflectivity is modelled with the normalized apparent VPR estimated globally without rain type separation. Implemen-tation of the radar data processing indicates that: (1) the com-bined correction for radar calibration and attenuation over the entire detection domain using the Hitschfeld-Bordan al-gorithm allows obtaining good radar QPEs (Nash criterion of 0.8 at the event time scale), especially for the most intense
rainfall period; (2) due to the attenuation equation instabil-ity, it is however compulsory to limit the maximum PIA to be corrected to about 10 dB; (3) the results also proves to be sensitive on the choice of the (Z, k, R) relationships. The convective nature of the precipitation explains the rather good performance obtained. For more contrasted rainy sys-tems with convective and stratiform regions, the combina-tion of the vertical (VPR) and radial (attenuacombina-tion, screening) sources of heterogeneity yields a still very challenging radar QPE problem.
The large sensitivity of the forward attenuation correction scheme on the maximum PIA, even with an adjusted radar calibration, prevents implementation of such an algorithm in real-time application. However, in the context of post-event studies, this simple method controlled with some raingauge measurements at the event time step proves to be useful. It is worth reminding that backward correction algorithms, start-ing from a reference target, are very stable and much less sensitive to parameterization errors compared to the forward scheme used herein (Marzoug and Amayenc, 1994). Such algorithms could be implemented easily if the region of in-terest was surrounded by a belt of mountain targets.
The radar QPE space-time series are now being used as in-put for the distributed hydrologic modelling of the ˇZelezniki flash flood. A striking result of the radar QPE analysis (Fig. 7b) indicates that maximum rainfall occurred outside the ˇZelezniki watershed. This is motivating additional field investigation to assess the flash-flood impacts in this less vul-nerable area.
Acknowledgements. The authors are grateful to A. Zgonc from
ARSO for providing the raw radar data used in this work. This study was funded by the HYDRATE project of the European Community (GOCE 037024) and the Cluster Environnement of the Rhˆone-Alpes Region.
Edited by: M. Mikos
The publication of this article is financed by CNRS-INSU.
References
Andrieu, H., Creutin, J. D., Delrieu, G., and Faure, D.: Use of a weather radar for the hydrology of a mountainous area, Part I: Radar measurement interpretation, J. Hydrol., 193, 1–25, 1997. Collier, C. G.: Applications of weather radar systems, Ellis
Hor-wood, 294 pp, 1989.
Delrieu, G., Creutin, J. D., and Andrieu, H.: Simulation of X-band weather radar mountain returns using a digitized terrain model, J. Atmos. Ocean. Tech., 12, 1038–1049, 1995.
Delrieu, G., Caoudal, S., and Creutin, J. D.: Feasibility of us-ing mountain return for the correction of ground based X-band weather radar data, J. Atmos. Ocean. Tech., 14, 368–385, 1997. Delrieu, G., Hucke, L., and Creutin, J. D.: Attenuation in rain for
X- and C- band weather radar systems operating in heavy rain-fall: sensitivity with respect to the drop size distribution, J. Appl. Meteorol., 38, 57–68, 1999a.
Delrieu, G., Serrar, S., Guardo, E., and Creutin, J. D.: Rain mea-surement in hilly terrain with X-band radar systems: Accuracy of path-integrated attenuation estimates derived from mountain returns, J. Atmos. Ocean. Tech., 16, 405–416, 1999b.
Delrieu, G., Andrieu, H., and Creutin, J. D.: Quantification of path-integrated attenuation for X- and C-band weather radar systems operating in heavy rainfall, J. Appl. Meteorol., 39, 840–850, 2000.
Delrieu, G., V. Ducrocq, E. Gaume, J. Nicol, O. Payrastre, E. Yates, P.-E. Kirstetter, H. Andrieu, P. A. Ayral, C. Bouvier, J. D. Cre-utin, M. Livet, A. Anquetin, M. Lang, L. Neppel, C. Obled, J. Parent-du-Chatelet, G. M. Saulnier, Walpersdorf, A., and Wo-brock, W.: The catastrophic flash-flood event of 8–9 Septem-ber 2002 in the Gard region, France: a first case study for the C´evennes-Vivarais Mediterranean Hydro-meteorological Obser-vatory, J. Hydrometeorol., 6, 34–52, 2005.
Delrieu, G., Boudevillain, B., Nicol, J., Chapon, B., Kirstetter, P.-E., Andrieu, H., and Faure, D.: Boll`ene 2002 experiment: radar rainfall estimation in the C´evennes-Vivarais region, France, J. Appl. Meteorol. Clim., in press, 2009.
Doviak, R. J., and Zrnic, D. S.: Doppler radar and weather observa-tions, 2nd edn. Academic Press Inc., 562 pp, 1993.
Gaume, E.: Post flash-flood investigation – methodological note, Floodsite European Research Project, available at: http://www. floodsite.net/, report D23.2., 62 pp, 2006.
Geotis, S. G.: Some measurements of the attenuation of 5-cm radi-ation in rain, Preprints 16th Conf. on Radar Meteorology, Hous-ton, TX, Amer. Meteor. Soc. 63-66, 1975.
Germann, U., Galli, G., Boscacci, M., and Bolliger, M.: Radar pre-cipitation measurement in a mountainous region, Q. J. Roy. Me-teor. Soc., 132, 1669–1692, 2006.
Gosset, M. and Zawadzki, I.: Effect of Nonuniform Beam Filling on the Propagation of the Radar Signal at X-Band Frequencies. Part I: Changes in the k(Z) Relationship, J. Atmos. Ocean. Tech., 18(7), 1113–1126, 2001.
Joss, J. and Waldvogel, A.: Precipitation measurement and hydrol-ogy, Radar in Meteorology: Battan Memorial and 40th Anniver-sary Radar Meteorology Conference, edited by: Atlas, D., Amer. Meteor. Soc., 577–606, 1990.
Leijnse, H., Uijlenhoet, R., and Stricker, J.N.M.: Rainfall measure-ments using radio links from cellular communications networks, Water Resour. Res., 43, W03201, doi:10.1029/2006WR005631, 2007.
Marzoug, M., and Amayenc, P.: A class of single and dual-frequency algorithms for rain-rate profiling from a spaceborne radar: Part 1- Principle and tests from numerical simulations, J. Atmos. Ocean. Tech., 11, 1480–1506, 1994.
Meneghini, R., Eckerman, J., and Atlas, D.: Determination of rain rate from a spaceborne radar using measurements of total
attenuation, IEEE T. Geosci. Remote., GE-21, 34–43, 1983. Ogden, F. L., Sharif, H. O., Senarath, U. S., Smith, J. A., Baeck,
M. L., and Richardson, J. R.: Hydrologic analysis of the Fort Collins, Colorado flash flood of 1997, J. Hydrol., 228, 82–100, 2000.
Pellarin, T., Delrieu, G., Saulnier, G. M., Andrieu, H., Vignal, B., and Creutin, J. D.: Hydrologic visibility of weather radar systems operating in mountainous regions: Case study for the Ard`eche catchment, France, J. Hydrometeorol., 3, 539–555, 2002. Smith, J. A., Baeck, M. L., Steiner, M., and Miller, A. J.:
Catas-trophic rainfall from an upslope thunderstorm in the central Ap-palachians: the Rapidan storm of 27 June 1995, Water Resour. Res., 32, 3099–3113, 1996.
Sanchez-Diezma, R., Zawadzki, I., and Sempere-Torres, D.: Iden-tification of the bright band through the analysis of volumetric radar data, J. Geophys. Res., 105(D2), 2225–2236, 2000. Serrar, S., Delrieu, G., Creutin, J. D., and Uijlenhoet, R.: Mountain
reference technique – The use of mountain returns to calibrate weather radars operating at attenuating wavelengths, J. Geophys. Res., 105, 2281–2290, 2000.
Steiner, M., Houze, R. A., and Yuter, S. E.: Characterization of three dimensional storm structure from operational radar and rain gauge data, J. Appl. Meteorol., 34, 1978–2007, 1995.