The Science of Making Torque from Wind (TORQUE 2020)
Journal of Physics: Conference Series 1618 (2020) 022063
IOP Publishing doi:10.1088/1742-6596/1618/2/022063
Applicability of machine learning approaches for structural
damage detection of offshore wind jacket structures based on
low resolution data
D Cevasco1, J Tautz-Weinert2, A J Kolios1, U Smolka2
1 Naval Architecture, Ocean and Marine Engineering Department, University of
Strathclyde, G11XQ Glasgow, United Kingdom
2 Ramboll, Burchardstraße 13, 20095 Hamburg, Germany
Abstract. Structural damage in offshore wind jacket support structures are relatively unlikely due to the precautions taken in design but it could imply dramatic consequences if undetected. This work explores the possibilities of damage detection when using low resolution data, which are available with lower costs compared to dedicated high-resolution structural health monitoring. Machine learning approaches showed to be generally feasible for detecting a structural damage based on SCADA data collected in a simulation environment. Focus is here given to investigate model uncertainties, to assess the applicability of machine learning approaches for reality. Two jacket models are utilised representing the designed and the as-installed system, respectively. Extensive semi-coupled simulations representing different operating load cases are conducted to generate a database of low-resolution signals serving the machine learning training and testing. The analysis shows the challenges of classification approaches, i.e. supervised learning aiming to separate healthy and damage status, in coping with the uncertainty in system dynamics. Contrarily, an unsupervised novelty detection approach shows promising results when trained with data from both, the as-designed and the as-installed system. The findings highlight the importance of investigating model uncertainties and careful selection of training data.
1. Introduction
The evaluation of the structural health of offshore wind turbines strongly relies on on-site practical assessments (inspections), which are associated with significant costs and risks, especially for structural failures below water level [1]. With respect to data-driven techniques, vibration-based methods have been applied to structural damage detection of wind turbines [2], [3]. The methods for the estimation of modal properties and their deviation due to a damage have been extensively used in the structural health monitoring of civil structures (e.g. bridges and building) [4], [5]. These techniques aim to identify the damage by using either natural frequencies or mode shapes and their derivatives such as displacement modal curvature. Their potential for structural damage detection in monopile and gravity based offshore wind was already proven in [6], [7]. A feasibility study on several structural modifications and environmental phenomena of an offshore wind jacket structure was conducted in [8]. In this work it was generally acknowledged that natural frequencies have low sensitivity to structural damage (e.g. member loss, scour, corrosion). On the contrary, mode shapes showed to have greater sensitivity to damage. Nonetheless, it is known that the application of
The Science of Making Torque from Wind (TORQUE 2020)
Journal of Physics: Conference Series 1618 (2020) 022063
IOP Publishing doi:10.1088/1742-6596/1618/2/022063
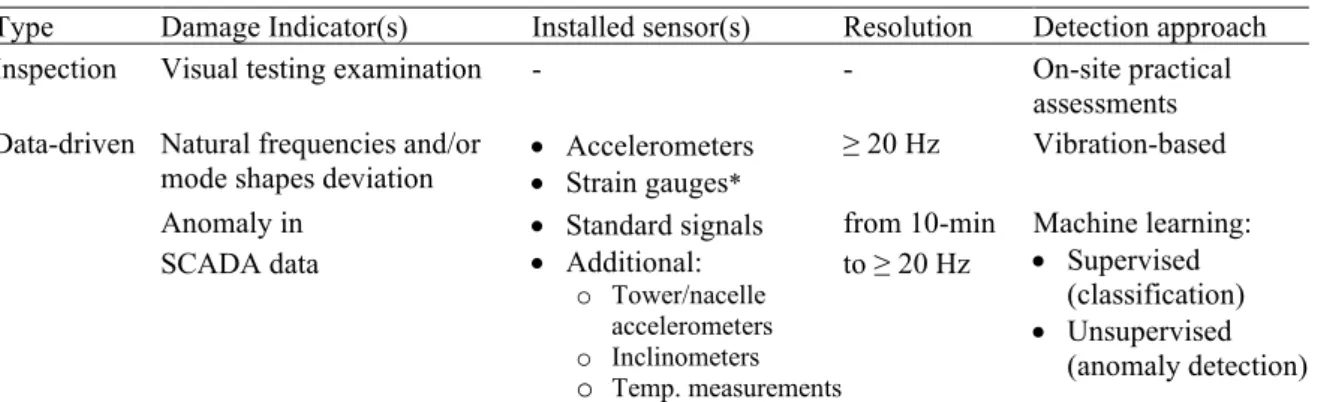
operational modal analysis for the extraction of modal parameters faces some main challenges for offshore wind structures [9]–[11]. Furthermore, the measurement of a mode shape requires several high-resolution sensors distributed on the structure. These structural health monitoring systems consisting of accelerometers, inclinometers and/or strain gauges are usually installed on no more than 10% of the turbines across the farm [12]. On the other hand, standard signals and their statistics are continuously collected via SCADA (supervisory control and data acquisition) systems throughout the service life of each asset. Supervised and unsupervised data-driven techniques have extensively been tested on these data for fault detection of the wind turbines [13], [14]. Such approaches have been mainly applied to condition monitoring of wind turbine mechanical and electrical components [15]. Machine learning techniques to drivetrain related failures might be trained and supported by real data from both the normal behavior and the damaged condition. However, the collection of the monitoring signals consequent the structural failure of an offshore wind turbine is unlikely, as such events have been rarely measured to date. Thus, the analysis has to strongly rely on models for representing the turbine dynamics in case of structural damage (see e.g. [16], [17]). An overview of the current practice and other potentially applicable approaches for structural health monitoring is given in Table 1.
Table 1. Structural damage detection approaches and sensors required
Type Damage Indicator(s) Installed sensor(s) Resolution Detection approach Inspection Visual testing examination - - On-site practical
assessments Data-driven Natural frequencies and/or
mode shapes deviation • • Accelerometers Strain gauges*
≥ 20 Hz Vibration-based Anomaly in
SCADA data • • Standard signals Additional:
o Tower/nacelle
accelerometers
o Inclinometers
o Temp. measurements
from 10-min
to ≥ 20 Hz Machine learning: • Supervised (classification)
• Unsupervised (anomaly detection)
* generally less reliable than the accelerometers
2. Aim and objectives
This work aims to discuss the applicability of machine learning techniques to the detection of structural damage in the jacket structure of an offshore wind turbine by employing standard SCADA data. In a previous work of the authors [18], the feasibility of such an approach was proven, by using well-known binary classifiers for the detection of the status of the turbine (either healthy or damage). Nonetheless, the supervised models strongly relied on the quality and type of simulated data for the collection of the virtual monitoring signals after the structural failure.
This paper focuses on the capability of the classifiers to accommodate the uncertainties associated with the model used for the training of the algorithms, as illustrated in Figure 1. The model of the structure used for the design purpose is thought to give a good representation of the behavior of the real structure. However, this “virgin” model is aimed to meet required safety levels. In contrast, the real structure differs from the designed structure (described with system uncertainty ∆3) due to
manufacturing tolerances, deviation in environmental parameters and changes during lifetime as e.g. corrosion and scouring. For this reason, the finite element (FE) model of the structure is updated to mimic the behavior of the real structure based on measurements [11]. The FE-update can be described with an uncertainty ∆1 with respect to the virgin model. Representing the as-installed status of the
turbine, the system uncertainty to the real structure (∆2) should be small compared to the one from the
virgin model (∆2≪ ∆1). The objective of this study is to verify if the algorithms trained on the data
from the as-designed model of the jacket are successful in classifying the status of the turbine when tested on the datasets from the FE-updated model. If this is achieved, then it will prove that the virgin model, and the algorithms trained on it, have the potential of being directly employed for the damage detection task of the real structure (based on the fact that ∆3~∆1).
The Science of Making Torque from Wind (TORQUE 2020)
Journal of Physics: Conference Series 1618 (2020) 022063
IOP Publishing doi:10.1088/1742-6596/1618/2/022063
Figure 1. Relationship between the modelled as-design, as-installed and real systems (∑), and theuncertainties (∆) among these.
3. Methodology
Simulated data is used to train and test classifiers for damage detection in a binary form (damaged/healthy). Tests with unseen conditions for stochasticity of the loading conditions and variability of wind inflow parameters are conducted, compare [18].
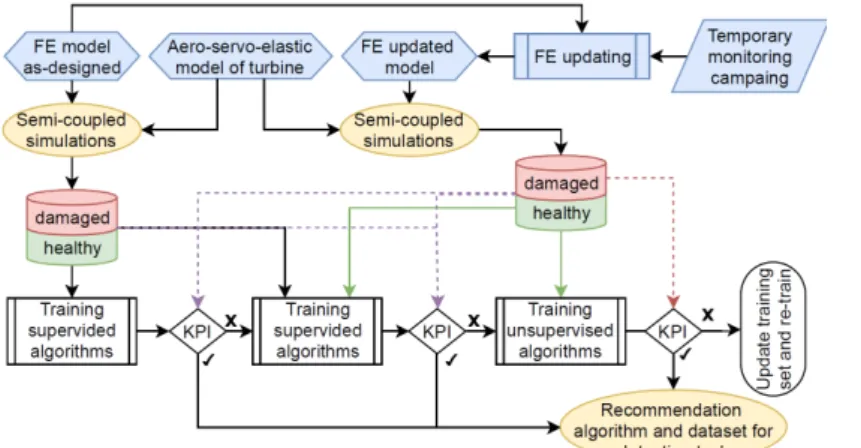
In a first step, the best performing algorithm using the as-designed data are tested on the set of data from the FE-updated simulations (as-installed status). In a second step, a hybrid training is attempted by including the dataset of healthy status condition from the as-installed structure dynamics into the training. In a third step, the potential implementation of anomaly detection algorithms is briefly studied. Here, unsupervised algorithms are used based on healthy data only from the as-installed system. The algorithm is instructed to recognize the normal behavior of the structure and to spot
anomalies when fed with simulated data associated to the damaged structure. A flowchart of the approach is presented in Figure 2.
Figure 2. Workflow for the applicability of machine learning for the structural damage detection by the use of simulated data. The dashed lines are used to indicate the data flow for the testing of the algorithms.
4. Data generation
The data for the measurements during the normal operation of the turbine, and consequently to the introduction of a structural damage, are obtained from semi-coupled hydro-elastic and aero-servo-elastic simulations. The FE model of the jacket in the Ramboll’s ROSAP software is combined with the aero-servo-elastic model of the turbine and tower by using Ramboll’s LACFlex tool. More information on the setup and assumptions of both healthy and damaged status simulations of the jacket structure are reported in [18].
4.1. Wind turbine jacket models
Two models of the wind turbine jacket structure are used in this study:
• Virgin model, used for the representing the as-designed system;
• FE-updated model obtained by modifying a set of parameters of the virgin FE model to better represent the as-installed turbine dynamics. The steps for matching of the structure eigenfrequencies (1st and 2nd fore-aft and side-side global bending modes) to the one derived
from a short-term measurement campaign are according to a Ramboll’s in-house procedure presented in [11], [19], [20].
The structural damage is then introduced, for both models, as a reduction in the stiffness of a brace element at the K-node closest to the seabed.
� as−designed (virgin model) �as−installed (FE−updated model) �real ∆1 ∆2 ∆3 (∆3∼∆1) (∆2≪∆1)
The Science of Making Torque from Wind (TORQUE 2020)
Journal of Physics: Conference Series 1618 (2020) 022063
IOP Publishing doi:10.1088/1742-6596/1618/2/022063
4.2. Datasets
The semi-coupled simulation for either the as-designed or the as-installed model of the structure, in healthy and damaged conditions, are run for the same set of environmental and operational conditions. The Jonswap spectrum for normal sea state conditions is used for the estimation of the wave parameters. Additionally, wind-generated sea current is derived according to the normal current model and considered aligned with the wave. Six short-term stochastic time histories of turbulent wind inflow and irregular wave (“seeds”) are then realised. The load combination and the number of simulations run per wind turbine status are reported in Table 2.
Table 2. Number and type of load combination simulated per jacket status (healthy/damaged) and jacket model (as-designed/as-installed)
Wind speed direction Wind misalignment Wind-wave TI* Seedings Total
Number cases 6 6 3 3 6 1,944 Configurations 4, 6, 8 m/s (below rated) 14, 18, 22 m/s (above rated) 0°, 60°, 120°, 180°, 260°, 320° -60°, 0°, 60° upper bound, 90th percentile, lower bound * Effective turbulence intensity
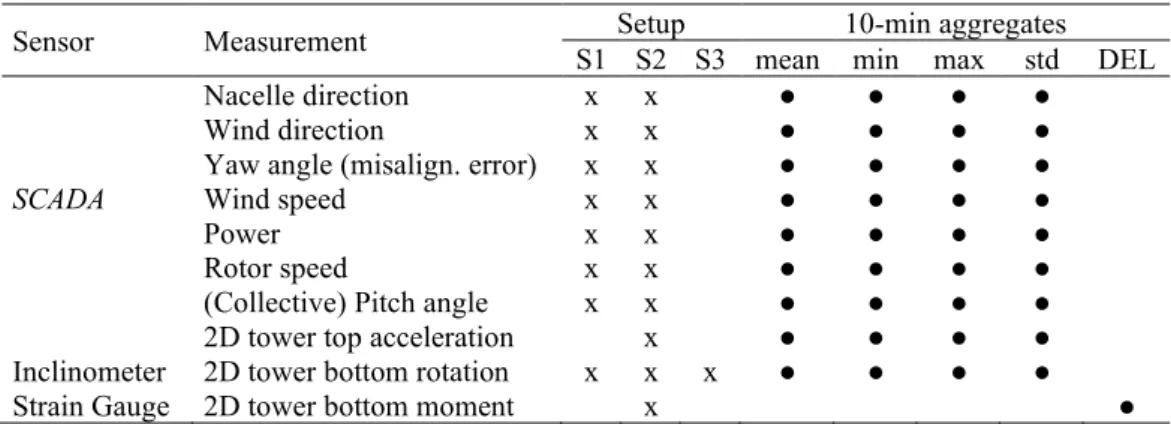
The results presented in this paper are according to the sensors setup presented in Table 3, looking for minimal combination necessary for satisfactory detection. The features, defined as the measured characteristics of each signal, for the training of the algorithms are the low frequency statistics minimum, mean, maximum, and standard deviation, usually collected for the SCADA data, and the damage equivalent load (DEL) for the tower bottom bending load.
Table 3. Sets of sensors and signals considered for the detection purpose
Sensor Measurement S1 S2 S3 mean min max std DEL Setup 10-min aggregates
SCADA
Nacelle direction x x ● ● ● ●
Wind direction x x ● ● ● ●
Yaw angle (misalign. error) x x ● ● ● ●
Wind speed x x ● ● ● ●
Power x x ● ● ● ●
Rotor speed x x ● ● ● ●
(Collective) Pitch angle x x ● ● ● ●
2D tower top acceleration x ● ● ● ●
Inclinometer 2D tower bottom rotation x x x ● ● ● ●
Strain Gauge 2D tower bottom moment x ●
Of the total amount of simulation run, the dataset splits and the samples number are, hierarchically
• 3,888 for each structural health condition (healthy and damaged), of which:
• 1,944 for each represented status (as-designed and as-installed), of which:
• 648 for each of the three TI levels, of which:
• 108 for each of the six seedings.
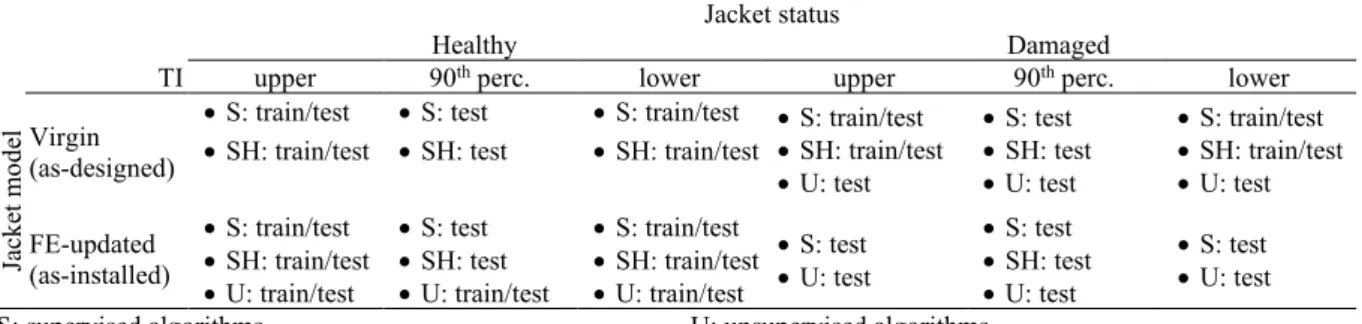
The use of each dataset for the training and testing of the detection algorithms, is reported in Table 4. Additional details are there given, distinguishing between the utilization of each dataset for
the supervised and the unsupervised approaches training, as presented in this paper (in sections 6 and 7.2, respectively), and for the TI levels.
The Science of Making Torque from Wind (TORQUE 2020)
Journal of Physics: Conference Series 1618 (2020) 022063
IOP Publishing doi:10.1088/1742-6596/1618/2/022063
Table 4. Overview of the data type and utilisation for the training and testing of the supervised and unsupervised algorithms
Jacket status
Healthy Damaged
TI upper 90th perc. lower upper 90th perc. lower
Jack et m ode l Virgin (as-designed) • S: train/test • SH: train/test • S: test • SH: test • S: train/test
• SH: train/test • • S: train/test SH: train/test
• U: test • S: test • SH: test • U: test • S: train/test • SH: train/test • U: test FE-updated (as-installed) • S: train/test • SH: train/test • U: train/test • S: test • SH: test • U: train/test • S: train/test • SH: train/test • U: train/test • S: test • U: test • S: test • SH: test • U: test • S: test • U: test S: supervised algorithms
SH: supervised-hybrid algorithms U: unsupervised algorithms “train/test” refer to a training vs testing seed ratio of 4:2
5. Training methodology and performance evaluation 5.1. Algorithms training techniques
The selection of the type of algorithms to be trained on the datasets of Table 4 is:
• for supervised approach, based on the most promising classifiers identified in [18], namely Support Vector Classifier (SVC) and Random Forest Classifier (RFC)
• for the unsupervised approach, guided by considerations on characteristics of the datasets for the as-installed condition and the typology of the detection wanted, as explained more in detail in section 7. Here, a one-class support vector machine (OCSVM) is selected.
For the training of these algorithms a “grid search” method is followed [21]. This implies that various combinations of configurations of the hyperparameters are tried during the training phase. For the supervised approaches, the best set is then selected as the one giving the best accuracy on sub-sets of the training dataset, so-called cross-validation (CV). On the other hand, the hyperparameters selection is done manually for the unsupervised algorithm, targeting satisfactory results of precision, recall and false alarm rate (refer to Section 5.2) on both the training and the test sets. The hyperparameters were varied as follows [22]:
• SVC: kernel = {linear, polynomial, radial-based function (rbf)}, C = {0.01:1000}, gamma = {0.01:1000}
• RFC: number of estimators = {10:100}, node split criterium = {“gini”, “entropy”}, maximum number of features = {“sqrt”, “log2”, “dataset features”}, maximum depth = {5:30}
• OCSVM: kernel = {sigmoid, polynomial, rbf}, nu = {0.01:1}, gamma = {0.01:1000} The classifiers are trained on balanced datasets containing both the healthy and damage samples. In contrast, the anomaly detection algorithm is instructed to build a decision function for recognizing the
healthy data only and considering all data samples not experience during the training phase as damaged.
5.2. Performance indicators
The following indicators are adopted to quantify the performance of supervised or unsupervised machine learning approaches:
• Accuracy (acc), representing the total amount of correct predictions over the total amount of samples in the dataset tested
acc = Total samplestp+tn (1)
• Precision (pr), defined as the percentage of correctly detected damaged case with respect to the total amount of cases predicted damaged
The Science of Making Torque from Wind (TORQUE 2020)
Journal of Physics: Conference Series 1618 (2020) 022063
IOP Publishing doi:10.1088/1742-6596/1618/2/022063
• Recall (re), defined as the percentage of correctly detected damaged case with respect to the total amount of damaged cases in the dataset tested
re = fn + tptp (3)
• False alarm rate (f-a), represented the percentage of false alarm raised (the classifier predicts damaged status although the structure is healthy) with respect to the total amount of healthy cases in the dataset
f-a = tn + fpfp (4)
were tn and tp refer to the correct prediction of healthy and damaged cases, respectively, and fp and fn
give the false alarms and miss, respectively, as common in the confusion matrix.
6. Classification results
The previous work in [18] addressed the training and testing of supervised detection algorithms on the as-designed model. SVC and RFC showed satisfactory performances in predicting the correct label, healthy or damaged, on unseen sets of data associated to:
• variation of the level of turbulence intensity (upper bound, 90th percentile, lower bound), • stochasticity (seedings) of the wind and wave loadings, and
• the presence of a damage in the jacket structure.
The best set of data for the generalization of the prediction over a broad set of inflow wind conditions was found by including the extreme (upper and lower bound) turbulence intensity levels per wind speed. The optimal sensor setup for the detection task was identified by substituting the tower top accelerometer with a 2D inclinometer installed at the bottom of the turbine tower (set S1), cp. Table 5.
6.1. Testing on as-installed structure
The applicability of these classifiers, trained on the as-designed model, to datasets of the as-installed structure needs to be verified. In Table 5 shows the training and testing performances for below rated operating condition, having obtained similar but slightly worse results for the above rated condition (not shown). It is observable that both classifiers have a random guess on test sets derived from the as-installed model, for all levels of turbulence intensity. The addition to the training set of the 10-min equivalent load from the tower bottom strain gauge (set S2) – seen to be a possible predictor of this damage [18] – leads only to minor improvements.
Table 5. Performances of the classifiers trained on the datasets from the as-designed structure.
Train on as-designed Test on as-designed Test on as-installed Tuned hyperpar. Set CV acc acc pr re f-a acc seedings 90th percentile TI pr re f-a 90acc th p. Upper Lower acc acc
SV C • • kernel: rbf C = 1000 • gamma: scale S1 93.3 100 100 100 0 84.0 81.3 88.3 20.4 51.9 50.0 53.7 S2 91.4 100 100 100 0 83.8 83.5 84.3 16.7 50.9 50.5 54.6 RF C • criterion: entropy • max depth = 15 • estimators = 80 S1 95.6 100 100 100 0 91.7 94.1 88.9 5.6 52.8 55.6 49.5 • criterion: entropy • max depth = 20 • estimators = 100 S2 95.4 100 100 100 0 89.8 93.9 85.2 5.6 53.2 54.6 49.5
6.2. Hybrid training on as-designed and as-installed
Consequently, a hybrid training approach is pursued, providing the classifiers with the datasets of the loadings and responses of the as-installed structure in its healthy status. This approach could close the gap for the real application of the detection algorithms, by screening at first the potential detectability
The Science of Making Torque from Wind (TORQUE 2020)
Journal of Physics: Conference Series 1618 (2020) 022063
IOP Publishing doi:10.1088/1742-6596/1618/2/022063
of the structural damages on the as-designed model of the structure, to then extend the training set with the data collected from the real structure. The results are reported in Table 6, for below rated cases only.
It can be noticed that overall unsatisfactory performances on the as-installed dataset are obtained for both investigated supervised algorithms. Nonetheless, it seems that some improvements could be further obtained for the SVC trained on the sensor setup S1. Despite of the low accuracy associated to the low detection rate (only 10%) of the damaged samples in the dataset, this algorithm raises a low percentage of false alarm (about 6%) while detecting a promising amount of damaged cases per number of alarms.
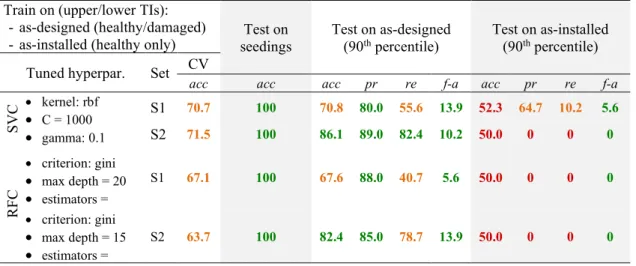
Table 6. Performances of the classifiers trained on the healthy and damaged status datasets from the as-designed structure, and the healthy status dataset from the as-installed structure.
Train on (upper/lower TIs): -as-designed (healthy/damaged)
-as-installed (healthy only) seedings Test on Test on as-designed (90th percentile) Test on as-installed (90th percentile)
Tuned hyperpar. Set CV
acc acc acc pr re f-a acc pr re f-a
SV C • • kernel: rbf C = 1000 • gamma: 0.1 S1 70.7 100 70.8 80.0 55.6 13.9 52.3 64.7 10.2 5.6 S2 71.5 100 86.1 89.0 82.4 10.2 50.0 0 0 0 RF C • criterion: gini • max depth = 20 • estimators = S1 67.1 100 67.6 88.0 40.7 5.6 50.0 0 0 0 • criterion: gini • max depth = 15 • estimators = S2 63.7 100 82.4 85.0 78.7 13.9 50.0 0 0 0
6.3. Applicability of supervised detection algorithms
The classification approach trained on the as-designed data failed to identify healthy and damaged status on datasets from the as-installed condition. An adapted training set including the variety in dynamics from the as-installed healthy condition seems to have the potential to overcome this issue. For what concerns the SVC, some dataset balancing techniques should be applied during the training phase to improve the damage detection performances. In addition, it should be noted that the difference of the as-designed and as-installed systems (∆1) is likely to be greater than the uncertainty
that the detection approach will face if applied to reality, cp. Figure 1 (∆2≪ ∆1) when the algorithms
are trained on the simulated data from the FE-updated model. Nonetheless, questions towards the capability of this approach to sufficiently accommodate uncertainty remain.
As further study for demonstration of its applicability, the number of samples for the training of these algorithms should be extended with filtering for the conditions leading to misclassification.
7. Anomaly detection alternatives
Although the applicability of a supervised method has not been fully disproved yet, an anomaly detection approach on the as-installed datasets is attempted as an alternative solution for the detection task. Several algorithms can be applied for this purpose, from a simple principal component analysis (PCA) applied in a semi-supervised manner to more complex normal behaviour models based on deep learning methods.
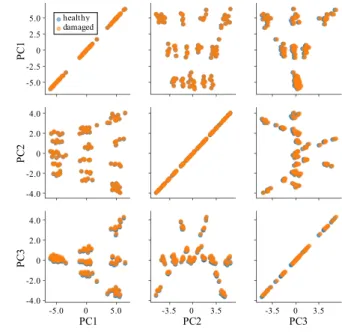
To guide the selection of a suitable approach, a normal PCA is conducted to understand and
visualize the distribution of the healthy and damaged datasets for the as-installed structure. In Figure 3 a low separability of the healthy and damaged data from the PCA can be observed. This indicates the need for a method which does not apply linear separation techniques (e.g. linear SVM, PCA, etc.), but
The Science of Making Torque from Wind (TORQUE 2020)
Journal of Physics: Conference Series 1618 (2020) 022063
IOP Publishing doi:10.1088/1742-6596/1618/2/022063
that either can map the data to a higher dimensional space (i.e. via the use of kernel transformations) or can handle non-linearities (e.g. tree-based algorithms and neural networks).
For the attempt presented, the OCSVM algorithm is selected, due to its advantage in learning a decision function. Thus, as opposed to other normal behavior models, either semi-supervised PCA or neural network models, it does not require an arbitrary selection of a threshold. In addition, preliminary tests showed superior results of OCSVM when compared to other algorithms which aim to isolate the anomalies (such as isolation forest and local outlier factor). This behavior was excepted because of the good compatibility of the datasets to the SVC and the observed low separability between the two classes.
Figure 3. Number of principal components (PC) for 80% of the cumulative explained variance (on top), and representation of the missing separability of the classes for the first three PC (on the right), for a dataset of the as-installed structure (90th p. TI). 7.1. OCSVM detection
The results from the unsupervised detection are shown in Table 7 for the hyperparameters combination leading to the best performances on the dataset of the as-installed structure in the healthy status. It is observed that the trained algorithm makes correct decisions only on the data for stochastic variations of the environmental conditions, with a relatively small deviation from the data experienced in the training phase. Thus, it is unable to generalize the prediction for different levels of turbulence intensity. For this reason, all the datasets from the healthy as-installed condition (cp. Table 4) had to be fed in during the training. Nonetheless, this approach shows potentially satisfactory results even when the algorithm is instructed on the information the tower bottom inclinometer only (set S3). Though, the more complete dataset - with additional statistics from the other SCADA signals - leads to improvements in the learned decision function. Task of a future analysis is the identification of the best set of signals, dependent on their reliability and availability.
Table 7. OCSVM performances
Train on healthy datasets
as-installed structure Test on as-installed Test on as-designed
Set Best set hyperparameter training dataset damaged datasets seedings
nu kernel gamma f-a re acc pr re f-a acc pr re f-a
S1 0.04 rbf 100-1000 7 100 96-95 92-93 100 8-9 50 50 100 100
S3 0.06 rbf 1000 16 100 91 85 100 17 50 50 100 100
7.2. Applicability of anomaly detection
The main criteria for the selection of the best tuning parameters is based on the successful fitting of the model to the healthy conditions in the training set, targeting thus a low number of false alarms. Yet,
1.0 0.9 0.8 0.7 0.6 Cum ul at ive ex pl ain ed var ian ce Number of components25 0 5 10 15 20 30 healthy damaged 0 3.5 -3.5 PC2 PC10 5.0 PC3 -5.0 -3.5 0 3.5 PC2 PC1 PC3 0 2.5 -5.0 0 2.0 -4.0 -2.5 5.0 -2.0 4.0 0 2.0 -4.0 -2.0 4.0 healthy damaged
The Science of Making Torque from Wind (TORQUE 2020)
Journal of Physics: Conference Series 1618 (2020) 022063
IOP Publishing doi:10.1088/1742-6596/1618/2/022063
the testing on the unseen damaged cases is necessary for the selection of a model with satisfactory detection performances. Therefore, even if the data from the normal operating turbine are available for the training task, the FE-updated model of the jacket structure should be setup for the collection of the reference damage state database. Future studies could investigate whether damage data statistics from the virgin model are sufficient for this purpose, or if the variation of the modal properties between as-installed and as-designed systems is too big for this assumption.
Additionally, the high value of the kernel function parameter (gamma) and of the finetuning parameter (nu) are indicators of potential overfitting of the model to the dataset. Thus, the ability of the model to accommodate other slight variations in the environmental conditions should be tested as well.
8. Conclusions
The analysis carried out in this paper investigates the applicability of supervised and unsupervised learning techniques for the detection of a damage in an offshore wind jacket structure. Differently from alternative approaches utilising high frequency data from ad-hoc installed sensors, the methodology here suggested is employing only low frequency aggregates from the standard collected SCADA data and, if necessary, few additional sensors. Although a brace loss is used as exemplary case, the analysis proposed is extendable to any other type of damage, once identified the set of environmental and operating condition and the main indicators (i.e. predictors) for its detection.
The supervised detection approaches showed to be successful for the classification task based on data simulated from the model of the as-designed structure. The trained algorithms were then tested on the datasets derived from to the model of the as-installed structure, to verify their ability to cope with uncertainties related to the updated model dynamics. While the random forest-based classifier showed overall unsatisfactory results, the support vector classifier seemed to have room for improvements. For instance, a pre-processing data filtering could be put in place to perform the detection task only on the set of environmental and operating conditions with the smallest number of misclassified cases.
To give an alternative to this supervised method, the feasibility of a novelty detection approach based on healthy status data only is verified on the database of simulated data from the as-installed structure. Among the algorithms of common use for this task, a one class support vector-based model was selected for its suitability to the as-installed datasets, having little separability between healthy and damaged status. Although the number of damage case detected and false alarm raised are acceptable, this algorithm can only perform the detection for small variations of the training set, being unable to correctly generalise the prediction on several levels on turbulence intensity. Nonetheless, its ability to cope with a good prediction based on the minimum set of signals, consisting of the inclinometer statistics only, make it interesting for a real application where a high availability and reliability of the data is not always possible.
Finally, the main take-away from this analysis is the need for the finite element model of the jacket structure representing dynamics of the structure at its as-installed conditions. The availably of data for damage status of the as-installed structure is required for either the validation of the supervised approach or the selection of best hyperparameters for the unsupervised approach.
Acknowledgements
This project has received funding from the European Union's Horizon 2020 research and innovation
program under grant agreement No. 745625 (ROMEO) (“Romeo Project” 2018). The dissemination of results herein reflects only the author's view and the European Commission is not responsible for any use that may be made of the information it contains. Furthermore, this work was supported by grant EP/L016303/1 for the University of Strathclyde, Centre for Doctoral Training in Renewable Energy Marine Structures - REMS (http://www.rems-cdt.ac.uk/) from the UK Engineering and Physical Sciences Research Council (EPSRC).
The Science of Making Torque from Wind (TORQUE 2020)
Journal of Physics: Conference Series 1618 (2020) 022063
IOP Publishing doi:10.1088/1742-6596/1618/2/022063
References
[1] M. Martinez-Luengo, A. Kolios, and L. Wang, “Structural health monitoring of offshore wind
turbines: A review through the Statistical Pattern Recognition Paradigm,” Renew. Sustain. Energy Rev., vol. 64, pp. 91–105, 2016.
[2] W. H. Hu, S. Thöns, R. G. Rohrmann, S. Said, and W. Rücker, “Vibration-based structural health monitoring of a wind turbine system Part II: Environmental/operational effects on dynamic properties,” Eng. Struct., vol. 89, pp. 273–290, 2015.
[3] W.-H. Hu, S. Thöns, R. G. Rohrmann, S. Said, and W. Rücker, “Vibration-based structural health monitoring of a wind turbine system. Part I: Resonance phenomenon,” Eng. Struct., vol. 89, pp. 260–272, 2015.
[4] F. Ubertini, C. Gentile, and A. L. Materazzi, “Automated modal identification in operational
conditions and its application to bridges,” Eng. Struct., vol. 46, pp. 264–278, 2013.
[5] Y. Kaya and E. Safak, “Real-Time Structural Health Monitoring and Damage Detection,” in
Proceedings of the 31st IMAC, A Conference on Structural Dynamics, 2013, 2013, vol. 39, no. 4, pp. 10–20.
[6] W. Weijtjens, T. Verbelen, E. Capello, and C. Devriendt, “Vibration based structural health monitoring of the substructures of five offshore wind turbines,” Procedia Eng., vol. 199, pp. 2294–2299, 2017.
[7] D. Tcherniak, C. E. Carcangiu, and M. Rossetti, “Application of OMA to operational wind turbine: Methods for cleaning up the Campbell diagram,” Int. Conf. Noise Vib. Eng. 2012, ISMA 2012, Incl. USD 2012 Int. Conf. Uncertain. Struct. Dyn., vol. 6, pp. 4435–4446, 2012. [8] M. Richmond, U. Smolka, and A. Kolios, “Damage Identification Feasibility through
Modelling of Global Dynamics in Offshore Wind Jacket Structures,” Submitt. to Mar. Struct., 2019.
[9] X. Dong, J. Lian, M. Yang, and H. Wang, “Operational modal identification of offshore wind turbine structure based on modified stochastic subspace identification method considering harmonic interference,” J. Renew. Sustain. Energy, vol. 6, no. 3, 2014.
[10] X. Dong, J. Lian, H. Wang, T. Yu, and Y. Zhao, “Structural vibration monitoring and operational modal analysis of offshore wind turbine structure,” Ocean Eng., vol. 150, no. 92, pp. 280–297, 2018.
[11] D. Augustyn, U. Smolka, U. T. Tygesen, and M. D. Ulriksen, “Data-driven Model Updating of an Offshore Wind Jacket Substructure,” Submitt. to Appl. Ocean Res., pp. 1–9, 2020.
[12] Bundesamt für Seeschifffahrt und Hydrographie (BSH), Design of Offshore Wind Turbines. 2015, pp. 1–52.
[13] A. Stetco et al., “Machine learning methods for wind turbine condition monitoring: A review,”
Renew. Energy, vol. 133, pp. 620–635, 2019.
[14] G. Helbing and M. Ritter, “Deep Learning for fault detection in wind turbines,” Renew. Sustain. Energy Rev., vol. 98, no. January, pp. 189–198, 2018.
[15] J. Tautz-Weinert and S. J. Watson, “Using SCADA data for wind turbine condition monitoring - A review,” IET Renew. Power Gener., vol. 11, no. 4, pp. 382–394, 2017.
[16] W.-H. Hu, S. Thöns, R. G. Rohrmann, S. Said, and W. Rücker, “Vibration-based structural health monitoring of a wind turbine system Part II: Environmental/operational effects on dynamic properties,” Eng. Struct., vol. 89, pp. 273–290, 2015.
[17] C. U. Nguyen, S. Y. Lee, H. T. Kim, and J. T. Kim, “Vibration-based damage assessment in gravity-based wind turbine tower under various waves,” Shock Vib., vol. 2019, 2019. [18] D. Cevasco, U. Smolka, and A. Kolios, “Feasibility of machine learning algorithms for
identification of structural damage in offshore jacket structures,” in Presented at EERA DeepWind2020, Trondheim (Norway), 2020.
[19] U. T. Tygesen, K. Worden, T. Rogers, G. Manson, and E. J. Cross, “State-of-the-Art and Future Directions for Predictive Modelling of Offshore Structure Dynamics Using Machine Learning,” in Pakzad S. (eds) Dynamics of Civil Structures, Volume 2. Conference Proceedings
The Science of Making Torque from Wind (TORQUE 2020)
Journal of Physics: Conference Series 1618 (2020) 022063
IOP Publishing doi:10.1088/1742-6596/1618/2/022063
of the Society for Experimental Mechanics Series, Springer, Cham, 2019.
[20] M. K. Choudhury, S. V Modak, and T. K. Kundra, Dynamics of Civil Structures, Volume 4, vol. 4. Springer, 2011.
[21] “Scikit-learn 0.22 Online Guide - 3.1. Cross-validation: evaluating estimator performance - 3.1.2.2.1. Stratified k-fold.”
[22] F. Pedregosa et al., “Scikit-learn: Machine Learning in Python,” JMLR, 2011. [Online]. Available: http://jmlr.csail.mit.edu/papers/v12/pedregosa11a.html.