RootScape: A Landmark-Based System for Rapid
Screening of Root Architecture in Arabidopsis
1[W][OA]
Daniela Ristova, Ulises Rosas, Gabriel Krouk, Sandrine Ruffel, Kenneth D. Birnbaum, and Gloria M. Coruzzi*
Center for Genomics and Systems Biology, New York University, New York, New York 10003 (D.R., U.R., G.K., S.R., K.D.B., G.M.C.); Faculty of Agriculture, University of Goce Delcev, 2000 Stip, Republic of Macedonia (D.R.); and Institut de Biologie Intégrative des Plantes-Claude Grignon, Biochimie et Physiologie Moléculaire des Plantes, National Institute for Agricultural Research/SupAgro/UM2, 34060 Montpellier, France (G.K., S.R.)
The architecture of plant roots affects essential functions including nutrient and water uptake, soil anchorage, and symbiotic interactions. Root architecture comprises many features that arise from the growth of the primary and lateral roots. These root features are dictated by the genetic background but are also highly responsive to the environment. Thus, root system architecture (RSA) represents an important and complex trait that is highly variable, affected by genotype3 environment interactions, and relevant to survival/performance. Quantification of RSA in Arabidopsis (Arabidopsis thaliana) using plate-based tissue culture is a very common and relatively rapid assay, but quantifying RSA represents an experimental bottleneck when it comes to medium- or high-throughput approaches used in mutant or genotype screens. Here, we present RootScape, a landmark-based allometric method for rapid phenotyping of RSA using Arabidopsis as a case study. Using the software AAMToolbox, we created a 20-point landmark model that captures RSA as one integrated trait and used this model to quantify changes in the RSA of Arabidopsis (Columbia) wild-type plants grown under different hormone treatments. Principal component analysis was used to compare RootScape with conventional methods designed to measure root architecture. This analysis showed that RootScape efficiently captured nearly all the variation in root architecture detected by measuring individual root traits and is 5 to 10 times faster than conventional scoring. We validated RootScape by quantifying the plasticity of RSA in several mutant lines affected in hormone signaling. The RootScape analysis recapitulated previous results that described complex phenotypes in the mutants and identified novel gene3environment interactions.
Roots have a crucial impact on plant survival be-cause of their major functions: anchorage of the plant in the soil, water and nutrient acquisition, and sym-biotic interaction with other organisms (Den Herder et al., 2010). One important characteristic of root sys-tems is the manner in which the primary and lateral roots comprise the superstructure or root architecture. Root architecture is an ideal system for studying de-velopmental plasticity, as it continually integrates in-trinsic and environmental responses (Malamy, 2005),
which represents a vital and dynamic component of agricultural productivity (Lynch, 1995).
Root system architecture (RSA) is defined as the spatial configuration of the roots in their environment (Lynch, 1995). The complexity of RSA was initially appreciated several decades ago, and terms like mor-phology, topology, distribution, and architecture were often used to describe the nature of RSA (Fitter, 1987; Fitter and Stickland, 1991; Lynch, 1995). These early reports argued that simple traits like root mass are insufficient to describe roots, because they do not capture the spatial configuration of roots in the soil, which is critical to plant performance (Fitter and Stickland, 1991). Root systems are integrated organs that adopt specific architectures to maximal foraging of the heterogeneous soil environment in different ways (Fitter, 1987; Fitter and Stickland, 1991; Lynch, 1995). More recently, new approaches have incorpo-rated the measurement of many individual develop-mental traits that together comprise RSA (De Smet et al., 2012; Dubrovsky and Forde, 2012). For example, one recent report identified three fundamental com-ponents of RSA in generating complex topologies, in-cluding the contribution of lateral axes to branching, the rate and path of growth of the axis, and the in-crease in root surface area (Topp and Benfey, 2012). Thus, RSA is an important and complex trait that re-quires convenient measurement methods for rapid screening of diverse plant mutants and genotypes. 1This work was supported by the National Science Foundation
(Arabidopsis 2010 Genome grant no. MCB–0929338 to G.C., K.D.B., and S.R.), by the National Institutes of Health (grant no. R01–
GM078270 to K.D.B.), by an International Fulbright Science and Tech-nology Doctoral Award for Outstanding Foreign Students (to D.R.), by a European-FP7-International Outgoing Fellowship, Marie Curie (AtSYSTM-BIOL; grant no. PIOF–GA–2008–220157 to G.K.), and by the Human Frontier Science Program (to U.R.).
* Corresponding author; e-mail [email protected]. The author responsible for distribution of materials integral to the
findings presented in this article in accordance with the policy de-scribed in the Instructions for Authors (www.plantphysiol.org) is: Gloria M. Coruzzi ([email protected]).
[W]
The online version of this article contains Web-only data. [OA]
Open Access articles can be viewed online without a subscrip-tion.
www.plantphysiol.org/cgi/doi/10.1104/pp.112.210872
With increasing research in RSA in the genetically tractable model plant Arabidopsis (Arabidopsis thali-ana), the need for high-throughput methods of root phenotyping has dramatically increased over the years. Consequently, different methods and approaches have been developed in order to address this de-mand. Currently, three major approaches for pheno-typing RSA are used (for review, see Zhu et al., 2011; De Smet et al., 2012). Thefirst group of methods uses classical measures of RSA, which involve measure-ments of individual root traits. These methods often use software to manually draw the RSA onto digital two-dimensional images to quantify root length and number (Abramoff et al., 2004; http://www.machinevision.nl). These traditional methods provide the most accu-rate measurements of the root system but have a major disadvantage in being extremely time con-suming.
The second group of methods utilizes advanced semiautomated software for RSA measurements like EZ-Rhizo (Armengaud et al., 2009). EZ-Rhizo also uses digital two-dimensional images of plants grown on vertical plates (similar to the classical methods above) but is faster and produces different traits and basic statistics. The method works best when root features do not physically overlap, but we have found root overlap to be common when working with Arabi-dopsis plants older than 10 d. Other recent programs also provide semiautomated analysis of RSA, including RootReader2D (http://www.plantmineralnutrition.net/ rootreader.htm) and SmartRoot (Lobet et al., 2011). However, while completely automated detection is potentially the highest throughput, we found that the root surface detection step is frequently prone to failure when using both of these programs, even after consid-erable adjustment by the user, where root features are missed or background noise is incorrectly labeled as roots.
Finally, in a third group, recent developments in-clude three-dimensional analysis of RSA of plants grown on transparent gel cylinders or in soil. The three-dimensional gel-based imaging approach is reported to be suitable for high-throughput phenotyping (Iyer-Pascuzzi et al., 2010). However, this approach requires special equipment, and imaging the root system of single plants can take 10 min (Iyer-Pascuzzi et al., 2010). X-ray computed tomography (Perret et al., 2007; Tracy et al., 2010) and magnetic resonance imaging (Van As, 2007) also provide highly detailed three-dimensional RSA analysis, but they require long scan-ning times and are extremely expensive and inaccessible. Most laboratories still utilize relatively convenient, inexpensive, and rapid two-dimensional phenotypic characterization of RSA, at least for initial screening purposes.
The aim of this work is to address the need for a simple method to measure many different aspects of root architecture for high-throughput laboratory screening of mutants and genotypes in Arabidopsis. Here, we describe a landmark-based allometric (size
and shape) approach called RootScape, a user-friendly software platform that enables rapid, comprehensive, and integrative phenotyping of the RSA in Arabi-dopsis. Unlike recent methods that collect informa-tion on different root traits to describe the RSA, RootScape places user-defined root landmarks on a two-dimensional grid to measure root architecture as a single integrated root system. The method employs rapid manual placement of root system landmarks. This manual step avoids one of the most problematic steps in automated image analysis (recognition of the root surface), providing a simple tool that does not require image processing. This method uses simple, two-dimensional digital images of the root system and a 20-point landmark model created in AAMToolbox, a freely available MATLAB plugin. While in-depth de-velopmental analysis of root systems will often require knowing the contribution of individual traits, Root-Scape is a rapid method to access the holistic contri-bution of many individual root traits to RSA and to capture the overall property of the spatial configura-tion of roots in the soil (Fitter and Stickland, 1991). To demonstrate its utility, we used RootScape to quantify the root plasticity of Arabidopsis plants (Columbia [Col-0]) grown on four different media and compared the RootScape results with conventional measurements of individual root traits captured using the Optimas6 image-analysis software or Image J (Abramoff et al., 2004). This analysis showed that by measuring inte-grative root traits using RootScape, we could capture the vast majority of the individual trait variation, as verified by multiple regression analysis. Additionally, we tested the ability of RootScape to quantify the plasticity response in Arabidopsis mutants defective in hormone signaling. For this analysis, wild-type Col-0 and three hormone signaling mutants (auxin
-resistant4 [axr4], abscisic acid insensitive4 [abi4], and
cytokinin response1 [cre1]) were treated with auxin, cytokinin, or abscisic acid (ABA) versus controls. Statistical analyses (ANOVA/multivariate ANOVA [MANOVA]) allowed us to confirm most of the pre-viously known interactions of genotype with these distinct environments and to potentially identify novel ones. Thus, we demonstrate that RootScape can be used as a rapid and efficient approach for quantifying the plasticity of the RSA in mutant (or ecotype) back-grounds of Arabidopsis and can identify new condi-tional root phenotypes.
RESULTS
RootScape: Adapting Software Platform to Measure RSA
Allometric methods have been applied previously to measure plant organs such as leaves (Langlade et al., 2005; Bensmihen et al., 2008). To implement an allo-metric method for quantifying RSA, we created a 20-point landmark template (model) in the AAMToolbox software, a publicly available MATLAB plugin (http:// cmpdartsvr1.cmp.uea.ac.uk/wiki/BanghamLab/index.
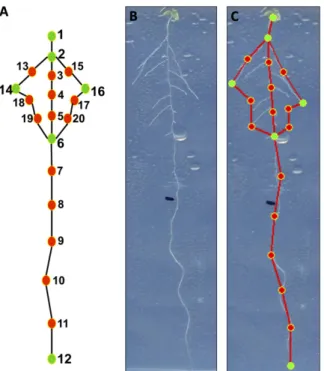
php/Software) originally developed for face shape recognition in lip reading (Matthews et al., 2002). This 20-point template captures the main characteristics of the RSA. The six“primary”landmarks (green points in Fig. 1A) are defined by recognizable developmental landmarks on the root. These included four of the pri-mary landmarks, placed on the transition between shoot and root (point 1), the position of thefirst lateral root (point 2), the position of the last lateral root (point 6), and the apex of the primary root (point 12; Fig. 1A). Two other primary landmarks (points 14 and 16) were placed at the apex of the lateral root that was farthest from the primary root along an axis perpendicular to the primary on each side (Fig. 1A). All primary land-mark points of the template are placed manually at the defined developmental positions of each root sample (Supplemental Fig. S2). Secondary landmarks or semi-landmarks (red points in Fig. 1) were defined as having a position between the primary landmarks. These second-ary landmarks were also placed manually on the lateral root periphery to capture the corresponding shape and along the length of the primary root. Following manual placement of these secondary landmarks, the AAM-Toolbox software automatically spaces these secondary landmarks evenly between the primary landmarks (Supplemental Fig. S2). In a side-by-side comparison performed by the same researcher, this new, landmark-based method called RootScape was 5 to 10 times faster
than individual measurements of root traits as performed using Optimas6 or Image J (Abramoff et al., 2004).
The plant root system does not have a defined shape, compared with leaves, and the number of lateral roots is quite variable depending on the conditions or gen-otype. Thus, the constructed model of 20 landmarks represents the primary root as a line and lateral roots as a polygon, which is the shape that explains how the root system spans the surface of its growth environ-ment on the plate. Root shapes that were captured by this model were aligned by translation according to the root shape centroids and translated to minimize the variance between corresponding landmarks. No size normalization of the root shapes was performed in this model, since the aim is to capture the variation in both the size and shape (allometry) of the root system in response to the hormonal treatments. This RootScape model of 20 landmarks yields 40 coordinate values (two per point) that define a 40-dimensional space in which each axis represents variation in one of the co-ordinate values. Each root shape can be characterized as a single point in this space, where all root shapes from the same treatment together define a“cloud” of points. The center of the cloud, corresponding to the mean root shape, is defined by the means of each of the 40 coordinate values.
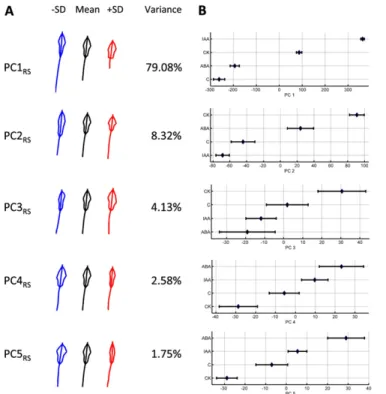
We used the RootScape template of 20 landmarks to quantify the RSA of Arabidopsis (Col-0) plants grown on four conditions, which consisted of control and three hormone treatments, auxin (indole-3-acetic acid [IAA]), cytokinin (CK), and ABA, with 24 to 25 plant replicates for each treatment condition. These treat-ment conditions were selected to create a variety of well-documented and stereotypical root architectures (Nibau et al., 2008). Plants were initially grown on a single growth medium and then transferred to either a control plate or one of the three hormone treatment conditions (for details, see “Materials and Methods” and Supplemental Fig. S1). After 5 d on the different hormonal treatments or control plates, the root system was imaged using a document scanner, and the un-processed images were used for subsequent analysis using the 20-point allometric template of RootScape (Supplemental Fig. S2). This landmark data set was used to create the RSA morphospace and was named the “allometric Col-0 plasticity space.” These data were further processed by the AAMToolbox software in a principal component analysis (PCA) that captures the main trends of variation in the root architecture. This analysis revealed that five PCs captured more than 95% of the root variation of the total root shape and size variance in Col-0 genotype (Fig. 2A). Figure 2 shows a plot of the range of the RootScape-derived principal component (PC) values of thefirst five PCs to identify the treatments that are driving the extreme phenotypes in RSA (Fig. 2B). PC1RS of the allometric
Col-0 model explains 79.08% of the total variance and mostly affects size, but it also affects the shape of the RSA and thus represents a major allometric trait. Low PC1RS values relate to having a longer primary root
Figure 1. RootScape, a landmark-based allometric model for integra-tive quantification of RSA. Twenty landmarks were used to describe the RSA: six primary landmarks (green; 1, 2, 6, 12, 14, and 16) placed at recognizable positions of the RSA and 14 secondary landmarks (red) spaced evenly between the primary landmarks. A, RootScape template of 20 landmarks. B, RSA of a 12-d-old seedling. C, RootScape applied on the same seedling.
and a smaller polygon of lateral roots with a narrowed polygon base (Fig. 2A; Supplemental Video S1), which corresponds to plants grown in control medium or with ABA (Fig. 2B). High PC1RSvalues relate to shorter primary root and rectangle-like shape of the lateral root polygon (Fig. 2A; Supplemental Video S1). This extreme value for PC1RScorresponds to the IAA-treated plants
(Fig. 2B). PC2RS accounts for 8.32% of the variance in RSA and affects mostly the shape of the polygon oc-cupied by lateral roots. Low PC2RSvalues give a longer,
rectangle-like polygon (Fig. 2A; Supplemental Video S1) and correspond to IAA-treated plants (Fig. 2B), whereas higher PC2RS values have a diamond-shaped lateral root polygon (Fig. 2A; Supplemental Video S1) and correspond to CK-treated plants (Fig. 2B). Together, PC3RSand PC4RScapture about 7% of the RSA variance
and affect only the asymmetry of the lateral root poly-gon, which reflects the random variation in root shape among individual plants but does not represent any trends resulting from the hormone treatment (Fig. 2B). PC5RS accounts for only about 2% of the variance in
RSA and mainly affects the lateral root polygon width (i.e. the length of the lateral roots that make the polygon shape). Negative PC5Rvalues correspond to RSAs with a wider lateral root polygon, while a positive value corresponds to RSAs with a very narrow lateral root polygon (Fig. 2A; Supplemental Video S1).
Comparison of PCs Captured by RootScape versus Individual Trait Measurements
As described above, RootScape quantifies the RSA as a series of integrative traits, where the phenotypic
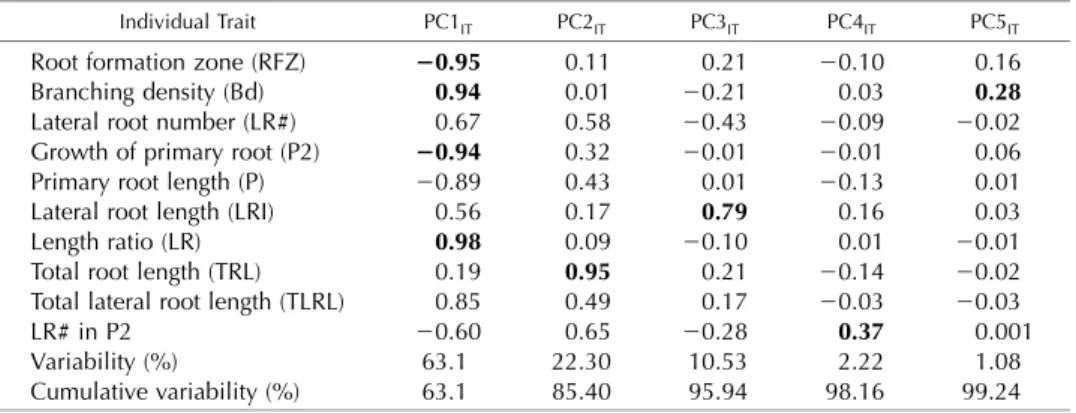
output is represented by PCs that each captures dif-ferent aspects of the shape and size of RSA. We were interested in determining how these phenotypic out-puts of RootScape are related to the classical method of RSA quantification, which measures individual traits. In order to answer this question, individual traits were first quantified using Optimas6 or Image J (Abramoff et al., 2004; for details, see “Materials and Methods” and Supplemental Text S1) and PCA was performed on the individual traits. This allowed us to compare how PCs derived from the individual traits (PCIT) relate to the PCs derived from RootScape (PCRS)
measurements (Table I; Supplemental Text S1). The PCA analysis of the individual traits (Table II) revealed that several traits have a high contribution to PC1IT (e.g. root length ratio, root formation zone, branching density, growth of primary root). Next, we performed Pearson correlation analysis of thefirstfive PCs of the individual trait analysis with thefirstfive PCs derived from the RootScape analysis (Table I). PC1RShas a high and significant correlation (0.88) with PC1IT(Table I).
Thus, we can conclude that individual traits such as root length ratio, root formation zone, and branching density are captured by PC1RS. Following this logic, PC2RS has the highest correlation (20.7) with PC2IT (Table I), which mainly captures total root length (Table II). Note that the direction of PC axes is arbi-trary, so either correlation or anticorrelation indicates a trend between a trait and a PC. PC3RS, PC4RS, and PC5RS correlate moderately, but significantly (0.35,
20.36, and20.5, respectively), with the same PC from the individual trait analysis, PC3IT (Table I). The
highest contribution in PC3IT is from the average lateral root length (Table I). Therefore, RootScape
Figure 2. Variability of the root system shape and size of Arabidopsis Col-0 quantified with Root-Scape, as described by the five main PCs from the allometric Col-0 model. A, For each PC, the mean root shape outline is shown in black (middle), blue (left), and red (right); shapes are shown by varying the PC value minus or plus 1SD(2SD and +SD). The percentage of variance of each PC is shown next to the shapes. B, PC values for the first five PCs are plotted on thexaxis against the four different conditions. The mean of each of the four treatments is represented by a diamond, and the error bars display the variation observed for each group.
captures variation in lateral root length in PC3RS, PC4RS,
and PC5RS. This correlation analysis shows that the RootScape allometric landmark-based method cap-tures very similar root variation as measured by many individual traits. Thus, RootScape is able to capture in-formation contributed by many individual traits, even though it measures RSA as one integrative trait.
Furthermore, we were interested in how the results obtained by RootScape could be explained (predicted) by the main PCs identified by the individual trait analysis. To answer this question, we used multiple linear regression analysis where each of the first five PC values from RootScape were taken as a response variable and the first five PC values from individual trait analysis were taken as the explanatory variables (Supplemental Table S1). We found that PC1RScan be explained almost completely (r2 = 0.97) by three PCs from the individual trait analysis (PC1IT, PC2IT, and PC4IT). PC2RS also has a high degree of predictability (r2= 0.82) based on four PCs from the individual trait analysis (PC1IT, PC2IT, PC3IT, and PC5IT). PC3RS, PC4RS, and PC5RScan be explained to a modest extent by the
first five PCs from the individual trait analysis (r2 = 0.17, 0.22, and 0.29), although only PC3IT shows
sig-nificance for prediction. These results demonstrate that RootScape phenotypic outputs can be highly predicted by classical quantification of RSA measured using in-dividual traits.
Reciprocally, we asked how much of the RSA vari-ation captured with the conventional individual trait
analysis can be explained by RootScape allometric measurements (Supplemental Table S2). PC1IT is largely explained by PC1RS, PC2RS, and PC5RS (r2 = 0.93). PC2ITand PC3ITcan also be explained to a high
degree (r2 = 0.75 and 0.69) where different PCs from RootScape have significant contributions. Thus, this analysis confirms that the simple and rapid allometric approach of RootScape has the power to predict the first three PCs from the individual trait analysis, which accounts for about 96% of the variation using that method. More generally, the reciprocal multivariate analysis shows that RootScape and individual trait analysis largely capture the same trends in variation of RSA. Thus, overall, the correlation and multivariate analyses show that RootScape is a rapid method that describes the same major trends in variation of RSA as more detailed and time-consuming analyses of indi-vidual traits.
Using RootScape to Characterize the Plasticity of RSA
Different phytohormones are known to exert specific effects on root architecture, with partially overlapping effects often due to cross talk between hormones (Bishopp et al., 2011; for review, see Depuydt and Hardtke, 2011). We used RootScape to characterize the plasticity of the Arabidopsis root system under hor-mone treatments. In addition, we measured the root architecture of well-characterized Arabidopsis mu-tants in hormone signaling to determine if RootScape
Table I. Correlation matrix of the first five PCs of RootScape and the first five PCs of individual traits, followed by a variability contribution for each
Sample size is represented by 24 to 25 plant replicates per treatment. Boldface values show highest significant correlations. ***P,0.0001, **P,0.001, *P,0.01. Correlation PC1RS(79%) PC2RS(8%) PC3RS(4%) PC4RS(3%) PC5RS(2%) PC1IT(63%) 0.884*** 20.334** 0.069 20.081 20.147 PC2IT(22%) 20.414*** 20.669*** 0.197 20.284* 20.129 PC3IT(11%) 0.004 0.437*** 0.347** 20.364** 20.497*** PC4IT(2%) 0.145 0.057 0.033 0.037 20.005 PC5IT(1%) 20.023 0.267* 20.006 0.008 20.089
Table II. Loading matrix of PCA, scored by 10 individual traits
Boldface values show the highest contribution(s) to the component.
Individual Trait PC1IT PC2IT PC3IT PC4IT PC5IT
Root formation zone (RFZ) 20.95 0.11 0.21 20.10 0.16
Branching density (Bd) 0.94 0.01 20.21 0.03 0.28
Lateral root number (LR#) 0.67 0.58 20.43 20.09 20.02
Growth of primary root (P2) 20.94 0.32 20.01 20.01 0.06
Primary root length (P) 20.89 0.43 0.01 20.13 0.01
Lateral root length (LRI) 0.56 0.17 0.79 0.16 0.03
Length ratio (LR) 0.98 0.09 20.10 0.01 20.01
Total root length (TRL) 0.19 0.95 0.21 20.14 20.02
Total lateral root length (TLRL) 0.85 0.49 0.17 20.03 20.03
LR# in P2 20.60 0.65 20.28 0.37 0.001
Variability (%) 63.1 22.30 10.53 2.22 1.08
could identify known phenotypes, including insensi-tivity to hormone treatments, which were the basis for the mutant screens. We also characterized all of these Arabidopsis mutants with a panel of hormone treat-ments to explore the ability of RootScape to rapidly characterize root architecture under a variety of con-ditions and to identify potential cross talk among hormones. We analyzed three Arabidopsis mutants known to affect root development due to signaling defects in auxin (axr4-1; Hobbie and Estelle, 1995), ABA (abi4-1; Signora et al., 2001), and CK (cre1-2; Inoue et al., 2001).
For each mutant genotype, 10 to 15 plant replicates were analyzed in each of the hormonal treatments, compared with controls. Growth conditions of the mutants were identical as for Col-0 (see“Materials and Methods”; Supplemental Fig. S1). The same RootScape allometric template of 20 landmarks was applied to each plant. In order to compare changes in root phe-notype between the mutant lines and Col-0, we pro-jected both the root architectural plasticity in Col-0 and the three mutant lines onto PC1RSand PC2RSaxes (e.g.
the allometric Col-0 plasticity space defined by Root-Scape measurements) and obtained phenotypic scores (PC values). By carrying out this projection, we were able to visualize the distribution of phenotypes along the phenotypic Col-0 plasticity“space”(Fig. 3).
This analysis showed that auxin treatment mapped to one extreme of PC1RS, showing its strong effect on
a suite of traits that varied dramatically among the treatments (Fig. 3A). We did not find any specific treatment grouping in the second PC (Fig. 3B). We next used PC values for the first five PCs to identify any genotype 3 treatment interactions. For this analysis, we performed a two-way ANOVA for each of thefirst
five PCs, following the model PCRS = agenotype +
btreatment + ggenotype3treatment + «. There were signifi-cant differences due to genotype (PC1RSF = 70.84,P,
0.0001; PC2RSF= 23.31,P,0.0001; PC4RSF= 11.26,P,
0.0001; PC5RSF = 10.25, P , 0.0001), treatment (PC1RS
F = 343.37, P , 0.0001; PC2RS F = 54.15, P , 0.0001;
PC3RS F = 3.06, P = 0.0288; PC5RS F = 16.52, P ,
0.0001), and the interaction between genotype and treatment (PC1Col F = 16.04, P , 0.0001; PC2Col F =
2.82,P= 0.0036; PC3RSF= 5.63,P,0.0001; PC4RSF= 6.16,P,0.0001; PC5RSF= 3.09,P= 0.0015). Significant
differences between the genotypes and treatments, when compared with the wild-type (Col-0) genotype and control treatment, are shown in Table III. Root-Scape measurements of the mutants and the wild type were able to recapitulate most of the known genotype3 hormone interactions. For example, axr4, which was originally isolated as an auxin-resistant mutant (Hobbie and Estelle, 1995), displayed an interaction with IAA in PC1RSand PC4RS. In addition,axr4showed an
inter-action with ABA in PC1RS, PC3RS, and PC4RS(Table III). These results support the variable resistance of axr4
to ABA, which was reported previously (Hobbie and Estelle, 1995). Additionally, another study reported cross talk between ABA and auxin signaling (axr4; Rock and Sun, 2005). The interaction of axr4 with cytokinin was present in allfive PCRS(Table III) andfits
with previous observations of variation in relative root elongation reported for axr4-1 at particular CK con-centrations (Hobbie and Estelle, 1995). Thus, RootScape can identify many of the conditional phenotypes iden-tified in the literature for theaxr4mutant.
The RootScape analysis also uncovered an interac-tion ofcre1-2with all three hormonal treatments in at least one PCRS (Table III). First, the cre1-2 interaction with CK captured in PC1RS and PC5RS is consistent
with previously published phenotypes for this mutant, fitting with its role as a CK receptor (Inoue et al., 2001). This analysis also identified an interaction of thecre1-2
mutation with ABA. This is reminiscent of anothercre1
allele (cre1-1) that was shown to have lower root growth in response to low levels of ABA (Inoue et al., 2001). Theabi4-1mutant had only one interaction with CK in PC1 (Table III), which may be related to inter-actions found by another study in which CK treatment
Figure 3. Range of PC values obtained for Col-0 (diamonds) and three mu-tants,abi4-1(squares),axr4-1(circles), andcre1-2(triangles), on the four dif-ferent media (control [C], gray; IAA, red; CK, green; and ABA, blue) for the allometric Col-0 model. The mean of each genotype based on the four treat-ments is represented by a different shape, and the bars represent theSEwithin the observed group. A, PC1. B, PC2. Extreme root shapes of minus or plus 1 SD are shown on each side below thexaxis.
increased the transcript level of ABI4(Shkolnik-Inbar and Bar-Zvi, 2010). Thus, RootScape is a sensitive and robust tool to characterize root architectural pheno-types using a rapid and simple protocol.
A Visual Representation of Phenotypic Plasticity Space
We have shown that RootScape can capture many of the individual traits that determine overall RSA. Fur-thermore, the PCA showed that suites of covarying traits can be summarized in single axes or PCs, captur-ing similar trends compared with the parallel analysis of individual traits. Thus, RootScape, in combination with PCA, offers a way to rapidly summarize the complex characteristics of RSA in a given genotype or back-ground, as has been done for other traits (Adams, 2010). Thefirst two PCs from RootScape capture about 87% of the total root shape variation for the allometric Col-0 plasticity space (Fig. 2). These PCs represent suites of individual root traits (Table I; Supplemental Table S1). The RootScape PC space, therefore, provides the op-portunity to quantify and visualize trends in root archi-tecture in two dimensions, providing a visual overview of phenotypic space.
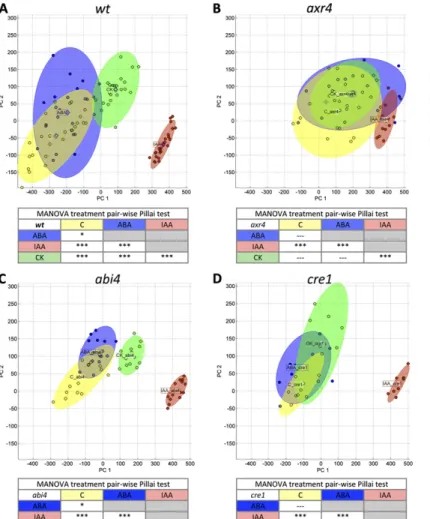
To compare the root phenotypes of the various Arabidopsis hormone signaling mutants, we plotted PC1RS against PC2RS values of root shapes for each genotype (Col-0,axr4,abi4, andcre1) on four treatment media (control, IAA, CK, and ABA; Fig. 4). By plotting PC1RS against PC2RS values, one can visually assess
how the plasticity of the RSA is affected in different genotypes (Fig. 4). For example, as reported previously (Hobbie and Estelle, 1995; Depuydt and Hardtke, 2011) and shown by ANOVA above, the change of root plasticity ofaxr4(Fig. 4B) compared with the wild type (Fig. 4A) is visually apparent in thefirst two PCs of RootScape (87% variation). When wild-type (Col-0) root plasticity space is compared with abi4 (Figs. 3C
and 4A), it is evident that the overall trend is main-tained. In this case, the appropriate analysis to test whether root architecture is significantly different in the two-dimensional PC space is multivariate ANOVA (MANOVA; Pillai test). We used MANOVA and cor-rected for multiple pairwise testing by applying a Bonferroni adjustment (a = 0.008). This MANOVA detects differences in the plasticity space occupied by all the different treatments applied to abi4. Mapping the individual samples on the two-dimensional PC space shows that the variability within treatments is much reduced inabi4without reducing the differences among treatments. This leads to the observation that theabi4mutant appears to constrain variability within all treatments; such a trait might not have been a part of quantitative measurements in the screening process but becomes apparent with visualization. This shows how this visual representation of RSA space can help screen for complex phenotypes that could be followed up with subsequent quantitative analysis.
DISCUSSION
This paper presents RootScape, a rapid method for the allometric and integrative quantification of RSA applied to Arabidopsis. The RootScape method uses a 20-point landmark template created in AAMToolbox (a MATLAB plugin), which can rapidly and accurately characterize RSA variation in different genetic back-grounds or treatments. RSA variation was generated experimentally by supplying Arabidopsis plants grown in full Murashige and Skoog (MS) medium with three different hormones known to affect different aspects of root development (IAA, CK, and ABA). The land-mark data from the root templates applied to this data set were then used in a PCA. These PC values were then used for correlation and multiple regres-sion analyses in order to compare how the RootScape
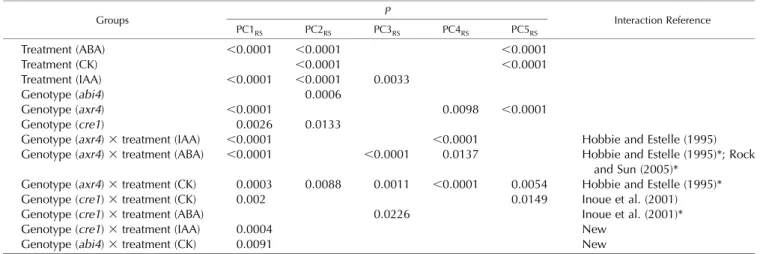
Table III. Significant differences of the first five RootScape PC values comparing hormone treatments and mutant genotypes with control treatment and the wild-type genotype
Only significantPvalues are shown (P,0.05). *Indicative interaction.
Groups P Interaction Reference
PC1RS PC2RS PC3RS PC4RS PC5RS Treatment (ABA) ,0.0001 ,0.0001 ,0.0001 Treatment (CK) ,0.0001 ,0.0001 Treatment (IAA) ,0.0001 ,0.0001 0.0033 Genotype (abi4) 0.0006 Genotype (axr4) ,0.0001 0.0098 ,0.0001 Genotype (cre1) 0.0026 0.0133
Genotype (axr4)3treatment (IAA) ,0.0001 ,0.0001 Hobbie and Estelle (1995)
Genotype (axr4)3treatment (ABA) ,0.0001 ,0.0001 0.0137 Hobbie and Estelle (1995)*; Rock
and Sun (2005)*
Genotype (axr4)3treatment (CK) 0.0003 0.0088 0.0011 ,0.0001 0.0054 Hobbie and Estelle (1995)*
Genotype (cre1)3treatment (CK) 0.002 0.0149 Inoue et al. (2001)
Genotype (cre1)3treatment (ABA) 0.0226 Inoue et al. (2001)*
Genotype (cre1)3treatment (IAA) 0.0004 New
method is related to standard measurements of indi-vidual root traits. This analysis showed that Root-Scape is able to recapitulate very similar trends of variation and is able to capture trends exhibited by nearly all individual traits. Additionally, we tested three mutant lines in hormone signaling known to affect root development and validated the RootScape technique by recapitulating previously characterized phenotypes and potentially describing new aspects of mutant phenotypes.
In a typical analysis with RootScape, a user could apply simple criteria for comparing root architectures, such as a significant difference in one or several PCs, between wild-type and mutant samples. Examination of components can identify the root system properties that are changing along a PC.
The RootScape template of 20 landmarks is meant to quantify RSA as a comprehensive or holistic pheno-type (see“Results”). However, it might be argued that the template can have a different (or more detailed) set of landmarks to enable a more detailed quantification of RSA. In such a case, a new template can easily be created that is designed to record specific aspects of root architecture. The current 20-landmark model de-sign captures intuitive and well-established features of
the RSA with a minimal number of landmarks, per-mitting high-throughput phenotyping. The secondary landmarks add sensitivity to detect a range of pheno-types, such as bending of the root in agravitropic mutants. However, we note that the primary intention of RootScape is rapid screening of RSA of Arabidopsis seedlings grown vertically on agar plates. It may not capture all possible defects in root architecture. For example, the RootScape method does not measure the diameter of roots, and subtle bending or waving phenotypes may be missed.
We show that thefirst PC captured by RootScape, PC1RS, has the highest correlation with the first PC derived from measurements of individual traits (PC1IT), which mainly captures traits that are related to
or functions of primary root length (e.g. root length ratio, growth of the primary root, root formation zone, and branching density). The second PC2RS is signifi-cantly correlated with PC2IT,in which total root length
and lateral root number have major contributions. We note that RootScape does not explicitly measure traits like lateral root number or branching density, but it appears that these traits correlate with other root fea-tures that RootScape does effectively capture. Root-Scape also effectively captures other traits that are
Figure 4. Visualization and MANOVA quantification of RSA phenotypic plas-ticity in genotypes. Distribution of PC1+ and PC2 values is shown for wild-type (wt) Col-0,axr4-1,abi4-1, andcre1-2
on four different treatments for the al-lometric Col-0 model quantified by RootScape. The mean of each treat-ment is shown by a colored diamond, and ellipsoids in the same color rep-resent clouds around the replicates. A, Wild type. B, axr4-1. C, abi4-1. D,
cre1-2. A MANOVA summary table for pairwise comparison is shown below each plot (Pillai test with Bonferroni ad-justment). *P,0.008, ***P,0.00008.
based on ratios of two important root traits, for ex-ample, length ratio (total lateral root length to primary root length). The important point is that RootScape captures trends in the variation of root architecture that are described by standard measurements, even if they were not directly measured. Thefirst and second PCs captured by RootScape significantly correlate with more than one PC of individual traits, signifying the integrative nature of RSA captured by RootScape.
One interestingfinding is that lateral root length is captured by three different RootScape PCs (PC3RS, PC4RS, and PC5RS). The RootScape template was de-signed to capture the set of lateral roots that grew farthest away from the primary root axes. In addition, RootScape measures the extent of lateral root out-growths along the primary root. This design appeared to effectively capture both the length of the lateral roots and much of the shape of the space covered by lateral roots on the two-dimensional plate. This en-abled us to measure different ways in which lateral root length influences root architecture, as multivariate analysis showed that this trait contributed to three different RootScape-derived PCs. These findings are consistent with earlier opinions that simple traits like the length of roots and total root mass are unable to explain the RSA variation and complexity, while spa-tial configuration and topology have more crucial impacts on RSA (Fitter and Stickland, 1991). Correla-tion and multiple regression analyses indicate that the first two PCs of RootScape are correlated with more than one PC from the individual traits. This shows that PCA analysis on RootScape groups the covariation among traits somewhat differently than PCA derived from an individual trait analysis, as can be visualized in PC“walks”(Supplemental Video S1) that represent the variation in root forms along a PC. Thus, Root-Scape measures the spatial configuration of roots to provide a new view of RSA, one that adheres to the concept that roots are integrated organs (Fitter, 1987; Fitter and Stickland, 1991; Lynch, 1995).
We generated experimental RSA variation by sup-plementing wild-type Arabidopsis (Col) with three different hormones, all known to affect root develop-ment. One of the hormones, auxin, has a dramatic ef-fect on the root phenotype, inhibiting new outgrowth of the primary root and stimulating the initiation of new lateral roots while inhibiting their elongation. It is possible that because of this strong effect, the RSA variation created in our experimental design will be driven by auxin treatment. This appears to be the case, since PC1RScaptures mainly variations in primary root
length or overall size. However, this trend of capturing a size effect in the first PC is observed in separate landmark-based quantifications of leaf shape (Langlade et al., 2005; Bensmihen et al., 2008). We have also used the RootScape method for RSA quantification on 69 Arabidopsis ecotypes (U. Rosas, A. Cibrian-Jaramillo, D. Ristova, J. Banta, M. Gifford, A.H. Fan, R.W. Zhou, G.J. Kim, G. Krouk, K.D. Birnbaum, M.D. Purugganan, and G.M. Coruzzi, unpublished data) in
one environment and found that the first PC is also driven by the size effect, even if no auxin treatment is applied.
Testing the RSA plasticity space in hormone sig-naling mutants with RootScape followed by two-way ANOVA confirmed most of previously reported phe-notypes and hormone interactions in the mutant lines. For example, axr4 was isolated for its resistance to auxin treatment and also shows variable resistance to ABA (Hobbie and Estelle, 1995). In the same study (Hobbie and Estelle, 1995), axr4 was reported to be sensitive to a particular kinetin concentration. Here, we were able to use RootScape to confirm the inter-action ofaxr4with auxin (PC1RSand PC4RS), with ABA (PC1RS, PC3RS, and PC4 RS), and with CK (PC1RS–
PC5RS). In addition, cre1 was originally isolated as having reduced sensitivity to cytokinin in the inhibi-tory effect on primary root growth (Inoue et al., 2001). We confirmed this interaction ofcre1with CK (PC1RS
and PC5RS). Additionally, our two-way ANOVA
re-sults indicate interactions of cre1 with auxin (PC1RS) and ABA (PC3RS) and an interaction of abi4 with CK
(PC1RS). These findings support the results from the correlation and multiple regression analyses that RootScape is able to recapitulate very similar trends in RSA variation to classical measurements of individual root traits. In addition, RootScape can potentially identify new interactions of genotypes with treat-ments. We identified two new genotype 3 environ-ment interactions (cre1 3 IAA,abi43 CK) as well as three previously identified interactions (axr4 3 ABA,
axr4 3 CK, cre1 3 ABA; Hobbie and Estelle, 1995; Inoue et al., 2001). This result demonstrates that Root-Scape can be used as a sensitive screening tool to explore the RSA plasticity space of mutant lines (alleles or ecotypes) exposed to different environments in Arab-idopsis. Furthermore, with ANOVA and/or MANOVA analysis, this plasticity of RSA and sensitivity can be visualized and quantified.
The experimental design presented here provides quantification of RSA at a single time point, at 12 d after germination. However, there is a need to observe the dynamics of root development, as recently advised (De Smet et al., 2012; Wells et al., 2012). In a pilot ex-periment, we tested if RootScape is able to distinguish RSA changes in different developmental stages of the Col-0 genotype grown on a single medium, 1 mM
KNO3. In this analysis, PC110vs.14showed a significant difference between day 10 and day 14 (Supplemental Fig. S3; Supplemental Text S1), confirming that Root-Scape can also be used for the quantification of RSA dynamics.
RSA differs between species by an enormous degree. We have developed RootScape, and its current tem-plate, using Arabidopsis as a model system. To be able to apply RootScape to other species, it will be neces-sary to adapt an optimal landmark template. This could potentially be a complex task, since the diversity of RSA is vast among ecotypes of the same species and even more diverse among different species. The current
20-landmark template developed for Arabidopsis is suitable for the quantification of any root system that has a dominant primary root. Therefore, we tested this 20-point template on a pilot set ofMedicago truncatula
ecotypes. Five M. truncatula ecotypes (Longi, A17, 2HA, Gaerta, and Tribu) were grown on 1 mM KNO3
for 14 d, and RSA was quantified with RootScape us-ing the current template. This pilot study on a small number of ecotypes and replicates reveals a set of PCs that capture differences in RSA between the ecotypes captured mainly in the first five PCs (Supplemental Fig. S4; Supplemental Text S1).
In summary, RootScape, a rapid, cost-effective method to capture RSA allometry, is appropriate for studying and quantifying a wide range of questions in root biology in the model Arabidopsis and can be adapted to other species. We demonstrate that RootScape is able to quantify and recapitulate known root pheno-types from the literature. Characterization of RSA plasticity among different genotypes (e.g. mutants, alleles, or ecotypes) on a range of treatments could also be investigated by the same analysis. These examples support the notion of a potentially wide application of RootScape in different areas of high-throughput root studies in plants.
MATERIALS AND METHODS Plant Material
Arabidopsis (Arabidopsis thaliana) genotypes used in this study were Col-0,
axr4-1(Hobbie and Estelle, 1995),abi4-1(Signora et al., 2001), andcre1-2(Inoue et al., 2001).Medicago truncatulaecotypes used were 2HA, Gaerta, Longi (M. truncatulavarlongispina), Tribu (M. truncatulassp.tribuloides), and A17.
Experimental Design and Treatments
To generate variation in the RSA, wefirst grew 15 seeds per plate of the Col-0 wild type on full MS basal medium (M 5524; Sigma) with 0.1% Suc as a carbon source, 0.05% MES sodium salt (Sigma), pH 5.7, and 1% Bacto Agar (BD) for 7 d. Seeds werefirst surface sterilized, plated on 10-310-cm2plates
(without tape or Parafilm), and then stratified for 3 to 5 d in the dark at 4°C. Plates were set up vertically in a Percival growth incubator (Intellus) at 22°C with a 16-h/8-h light/dark cycle and a light intensity of 50mmol m22s21. After 7 d on each plate,five out of the 15 most uniform plants were chosen and transferred onto a new plate with different media as described in Supplemental Figure S1: full MS control or full MS supplemented with 500 nmol of IAA (Sigma), 500 nmol of CK (Sigma), or 1mmol of ABA (Sigma). Each experiment was performed twice, with a total of 24 to 25 plants per treatment. The same procedure was applied for the mutant genotypes, where we carried out two experimental replicates and used a total of 10 to 15 plant replicates per genotype per treatment. Five days after the transfer of the 7-d-old plants to different media, plates were scanned (Epson Perfection V350 Photo) at 300 dots per inch and images were obtained.
Individual Trait Analysis of RSA
We scored 12 individual root traits quantified as described previously (Remans et al., 2006; Ruffel et al., 2011; Dubrovsky and Forde, 2012). Briefly, we used Optimas6 software (MediaCybernetics) or Image J (Abramoff et al., 2004) that allows one to completely draw the root system and export the main numerical values. We note that Optimas software is no longer commercially available, however, Image J (Abramoff et al., 2004) and other freely available software give the same results. We measured primary root length on the transfer day, primary root length growth after 5 d from the transfer, lateral root number, lateral root number in primary root, root branching zone, root
formation zone, and average lateral root length. Other traits are obtained from these main traits by applying appropriate calculations (for details, see Supplemental Text S1 and Supplemental Fig. S1). Using this analysis, we quantified Col-0 plants (24–25 plants per treatment) in four different treat-ments (control, IAA, CK, and ABA) and later performed PCA in order to compare with RootScape.
RootScape, Integrative and Allometric Quantification of RSA
The same plants quantified by the individual trait analysis were also measured by RootScape. Three insertion mutations (axr4-1,cre1-2, andabi4-1; 10–15 plants per treatment per genotype) were quantified by this method. Twenty landmarks (six primary and 14 secondary) werefitted along the length of the primary (main) and lateral (secondary) roots by placing the landmarks at key and recognizable positions of RSA: the start and end of the primary root, thefirst and last lateral roots on the main root, and the widest points of lateral roots on each side of the main root (Fig. 1). The PCA model of root shape and size was created from the 20-point model in the wild-type Col-0 treatment data set. In this wild-type plasticity space, we projected the model shapes for the three mutant lines and obtained PC values for later statistical analysis. Models were generated using version 1 of the AAMToolbox MATLAB plugin, available free at http://cmpdartsvr1.cmp.uea.ac.uk/wiki/BanghamLab/ index.php/Software. The user manual can be downloaded at the following link: http://lemur.cmp.uea.ac.uk/Research/cbg/Documents/Bangham-Coen-Group/ AAMToolbox/AAMToolbox.htm.
Procrustes Alignment, Normalization, and Representation of Shapes
For each analyzed root, root outlines were normalized using the Procrustes method, where each root shape is transformed to a mean shape using iterative translation and rotation of the landmark data generating superimposition that minimizes the aberrations from the overall mean root shape (Bensmihen et al., 2008).
Statistical Analysis
One-way ANOVA for treatment in the wild-type Col-0 data set for the 12 individual traits was performed in JMP 9. In JMP, we also performed two-way ANOVA, PCA of individual traits, correlation, and multiple regression anal-ysis. RSA shape and size images (RootScape) were obtained in AAMToolbox in MATLAB. PCA for RootScape was also performed in AAMToolbox in MATLAB. Pairwise MANOVA comparison was done in R.
Supplemental Data
The following materials are available in the online version of this article.
Supplemental Figure S1. Experimental design of the study.
Supplemental Figure S2. Application of 20-landmark template of Root-Scape.
Supplemental Figure S3. Quantification of developmental stages with RootScape.
Supplemental Figure S4. Quantification ofM.truncatulawith RootScape.
Supplemental Table S1. Multiple regression of each of thefirstfive prin-cipal components of RootScape.
Supplemental Table S2. Multiple regression of each of thefirstfive prin-cipal components of individual trait analysis.
Supplemental Video S1. Variability of the root system shape and size of Arabidopsis Col-0 quantified with RootScape.
Supplemental Text S1. RootScape template.
ACKNOWLEDGMENTS
We thank Lawrence Hobbie for providing axr4-1 seeds and Thomas Schmülling and Michael Riefler for providingcre1-2seeds. We thank Miriam
L. Gifford for providing seeds ofM. truncatula ecotypes. We thank Daniel Tranchina for guidance on multiple regression analysis and Miriam L. Gifford and Amy Marshall Colon for helpful comments and suggestions.
Received November 15, 2012; accepted January 15, 2013; published January 18, 2013.
LITERATURE CITED
Abramoff MD, Magelhaes PJ, Ram SJ(2004) Image processing with Im-ageJ. Biophotonics Int11:36–42
Adams DC(2010) Parallel evolution of character displacement driven by competitive selection in terrestrial salamanders. BMC Evol Biol10:72
Armengaud P, Zambaux K, Hills A, Sulpice R, Pattison RJ, Blatt MR, Amtmann A(2009) EZ-Rhizo: integrated software for the fast and ac-curate measurement of root system architecture. Plant J57:945–956
Bensmihen S, Hanna AI, Langlade NB, Micol JL, Bangham A, Coen ES
(2008) Mutational spaces for leaf shape and size. HFSP J2:110–120
Bishopp A, Benková E, Helariutta Y(2011) Sending mixed messages: auxin-cytokinin crosstalk in roots. Curr Opin Plant Biol14:10–16
Den Herder G, Van Isterdael G, Beeckman T, De Smet I(2010) The roots of a new green revolution. Trends Plant Sci15:600–607
Depuydt S, Hardtke CS (2011) Hormone signalling crosstalk in plant growth regulation. Curr Biol21:R365–R373
De Smet I, White PJ, Bengough AG, Dupuy L, Parizot B, Casimiro I, Heidstra R, Laskowski M, Lepetit M, Hochholdinger F, et al(2012) Analyzing lateral root development: how to move forward. Plant Cell
24:15–20
Dubrovsky JG, Forde BG(2012) Quantitative analysis of lateral root de-velopment: pitfalls and how to avoid them. Plant Cell24:4–14
Fitter AH(1987) An architectural approach to the comparative ecology of plant-root systems. New Phytol106:61–77
Fitter AH, Stickland TR(1991) Architectural analysis of plant-root sys-tems. 2. Influence of nutrient supply on architecture in contrasting plant-species. New Phytol118:383–389
Hobbie L, Estelle M(1995) The axr4 auxin-resistant mutants of Arabi-dopsis thaliana define a gene important for root gravitropism and lateral root initiation. Plant J7:211–220
Inoue T, Higuchi M, Hashimoto Y, Seki M, Kobayashi M, Kato T, Tabata S, Shinozaki K, Kakimoto T(2001) Identification of CRE1 as a cytokinin receptor from Arabidopsis. Nature409:1060–1063
Iyer-Pascuzzi AS, Symonova O, Mileyko Y, Hao YL, Belcher H, Harer J, Weitz JS, Benfey PN(2010) Imaging and analysis platform for auto-matic phenotyping and trait ranking of plant root systems. Plant Physiol
152:1148–1157
Langlade NB, Feng XZ, Dransfield T, Copsey L, Hanna AI, Thébaud C, Bangham A, Hudson A, Coen E(2005) Evolution through genetically controlled allometry space. Proc Natl Acad Sci USA102:10221–10226
Lobet G, Pagès L, Draye X(2011) A novel image-analysis toolbox enabling quantitative analysis of root system architecture. Plant Physiol157:29–39
Lynch J(1995) Root architecture and plant productivity. Plant Physiol109:
7–13
Malamy JE(2005) Intrinsic and environmental response pathways that regulate root system architecture. Plant Cell Environ28:67–77
Matthews I, Cootes TF, Bangham JA, Cox S, Harvey R(2002) Extraction of visual features for lipreading. IEEE Trans Pattern Anal Mach Intell24:
198–213
Nibau C, Gibbs DJ, Coates JC(2008) Branching out in new directions: the control of root architecture by lateral root formation. New Phytol179:
595–614
Perret JS, Al-Belushi ME, Deadman M(2007) Non-destructive visualiza-tion and quantification of roots using computed tomography. Soil Biol Biochem39:391–399
Remans T, Nacry P, Pervent M, Filleur S, Diatloff E, Mounier E, Tillard P, Forde BG, Gojon A(2006) The Arabidopsis NRT1.1 transporter partic-ipates in the signaling pathway triggering root colonization of nitrate-rich patches. Proc Natl Acad Sci USA103:19206–19211
Rock CD, Sun X (2005) Crosstalk between ABA and auxin signaling pathways in roots of Arabidopsis thaliana (L.) Heynh. Planta222:
98–106
Ruffel S, Krouk G, Ristova D, Shasha D, Birnbaum KD, Coruzzi GM
(2011) Nitrogen economics of root foraging: transitive closure of the nitrate-cytokinin relay and distinct systemic signaling for N supply vs. demand. Proc Natl Acad Sci USA108:18524–18529
Shkolnik-Inbar D, Bar-Zvi D(2010) ABI4 mediates abscisic acid and cy-tokinin inhibition of lateral root formation by reducing polar auxin transport inArabidopsis. Plant Cell22:3560–3573
Signora L, De Smet I, Foyer CH, Zhang H(2001) ABA plays a central role in mediating the regulatory effects of nitrate on root branching in Arabidopsis. Plant J28:655–662
Topp CN, Benfey PN (2012) Growth control of root architecture.In A Altman, PM Hasegawa, eds, Plant Biotechnology and Agriculture. Elsevier, London, UK, pp 373–386
Tracy SR, Roberts JA, Black CR, McNeill A, Davidson R, Mooney SJ
(2010) The X-factor: visualizing undisturbed root architecture in soils using X-ray computed tomography. J Exp Bot61:311–313
Van As H (2007) Intact plant MRI for the study of cell water relations, membrane permeability, cell-to-cell and long distance water transport. J Exp Bot58:743–756
Wells DM, French AP, Naeem A, Ishaq O, Traini R, Hijazi HI, Bennett MJ, Pridmore TP(2012) Recovering the dynamics of root growth and development using novel image acquisition and analysis methods. Philos Trans R Soc Lond B Biol Sci367:1517–1524
Zhu J, Ingram PA, Benfey PN, Elich T(2011) From lab tofield, new ap-proaches to phenotyping root system architecture. Curr Opin Plant Biol
![Figure 3. Range of PC values obtained for Col-0 (diamonds) and three mu-tants, abi4-1 (squares), axr4-1 (circles), and cre1-2 (triangles), on the four dif-ferent media (control [C], gray; IAA, red; CK, green; and ABA, blue) for the allometric Col-0 model](https://thumb-us.123doks.com/thumbv2/123dok_us/528380.2562236/6.877.72.593.795.1081/figure-obtained-diamonds-squares-circles-triangles-control-allometric.webp)