The Effect of Marketing Mix and Service Performance to
Customer Loyalty Through Customer Satisfaction
Yacobus Sutarmo Suharno Sri Mintarti Tetra Hidayati Martinus Robert Hutauruk* Doctoral Program of Economic and Business Faculty, Mulawarman University, Indonesia
Abstract
This paper aims to investigate the mediating effects of service performance and customer satisfaction on the relationship between marketing mix and the customer loyalty in the customer business rates of PT Perusahaan Listrik Negara (Persero) Samarinda Area. Based on a sample of 181 customers and using structural equation modeling approach, the one dimensions of customer convenience are found to have positive effects on service performance, the five dimension of customer solution – customer satisfaction, customer convenience – service performance, customer convenience – customer satisfaction, service performance – customer satisfaction and service performance – customer loyalty are found to have positive effects on customer business rate of PT Perusahaan Listrik Negara (Persero) Samarinda Area. The finding of the study suggest that service performance and customer satisfaction partially mediates the effects of customer solution and customer convenience on customer loyalty. The effects of customer convenience on customer satisfaction and customer loyalty are fully mediated by service performance.
Keywords: marketing mix, service performance, customer satisfaction, customer loyalty
1. Introduction
The development of electricity in East Kalimantan Province in getting better because the Mahakam System’s capable power is sufficient after power plant operates and enters to the Mahakam Electric System. This is in contrast to the electricity suppley in previous years of East Kalimantan Region, including those experiencing power deficits. In 2014 the condition is illustrated by the number of State Electricity Company customers in East Kalimantan of approximately 775,519 of which 529,203 subscribers (68%) are served by Mahakam Systems (Balikpapan, Samarinda and Tenggarong). The load that must be fulled reaches 375 megawatt, while the optimum able to power of Mahakam 344 megawatt. To avoid blackout, at night big customers have to be released or exit form Mahakam system 30 megawatt so there is still have 1 megawatt power reserve, this is not safe, if there is planned maintenance or disruption in one unit of power plant, blackout can not be avoided, is very decrimental to the public and the state electricity company it self because of disrupted service.
According research by Voss et al., (1998), entitled “The Roles of Prices, Performance, and Expectations in Determining Satisfaction in Service Exchange”. This study aims to explain the price, performance, and expectations in the derivate of satisfaction in the service received. Researchers maintain that the usual price fluctuations in many service industries show demand-price orientation. The results support the likely framework and provide empirical support for the so-called normative guidelines of creating realistic performance and over money back. The result of Voss et al., (1998) is certainly a gap in this research, where according to the research that normative guidances is able to describe a realistic performance and over money back. While in this research, where the use of electricity is only charged based on basic tariff usage and promising results of performance and services that are able to satisfy and meet the price to the services provided and all tend to apply equally to each level of the consumer.
PT Perusahaan Listrik Negara (PLN) (Persero) is a service company, so the quality factor of service and satisfaction received by the customer become the main concern even through the above mentioned problem is still far expected by company and customer. Given the increasing demands of the environment of the quality of service, it is also necessary to increase. Service performance becomes an important topic of discussion for the company. Research result shows that better service delivery to consumers has an effect on strengthening and supporting long-term relationships with consumers. The results of this study also mentions that better service delivery canb improve consumer satisfaction that will give a signal to the market for the company to achieve competitive advanted (Kashyap 2001).
According to Zeithaml and Bitner (2003), there are factors that affect consumer satisfaction, among others comprising: product and service features (e.g., price level with quality or with employee friendliness), customer emotions, attribution to service success or failure, perception of fairness and fairness (equity and fairness), other customers, family and colleagues. These things need to be considered, because customer satisfaction is usually very dependent on service performance. Implementation of service performance performed by a company engaged in services is to provide the best quality of service for customers with the aim to create customer satisfaction. Quality provided by the company, will lead to customer perceptions of the quality given to him. There is often a difference between expectations and customer perceptions of the quality of the company. To know the company has provided quality services in accordance with customer expectations, it is necessary to
evaluate.
Marketing strategies that consider satisfaction effect to consumers in the determination are: segmentation strategy, targeting and positioning, and marketing mix strategy, which includes product, price, distribution and promotion. Observation of consumer behavior becomes an important consideration in the process of setting marketing strategy. This is because generally many companies in running their business with an emphasis on consumer-oriented marketing philosophy, known as the concept of marketing. With the concept of marketing, the company always strives to provide higher satisfaction to consumers or customers. Customers generally expect products in the form of goods or services consumed can be received and enjoyed with good service and satisfactory. Customers generally place great emphasis on the second dimension of service or service that is essential and expected, that is to be trusted or reliability. This is certainly part of the things that affect the perception of value and customer satisfaction. In general, service quality factors consisting of reliability, responsiveness, assurance, empathy, and tangibles are the factors that determine the customer in giving the perception of value and satisfaction. Reliability demonstrates PLN's ability to deliver customer service as originally promised. The existence of responsiveness shows the alertness of PLN in handling customer complaints and technical problems in the field quickly and accurately. In addition, the assurance factor also supports PLN in providing warranty for 24 hours service to all electrical disturbances. The existence of services supported by all technical personnel are adequate and full of patience and informative and have complete facilities and equipment that support officers in the field will increasingly support the perception of value and customer satisfaction. In addition to the quality of services provided will further support the perception of value and customer satisfaction is to provide evidence of the marketing mix, which includes product, price, promotion, place from the manufacturer side, and from the customer customer solution, customer cost, communication and convenient.
Thus, it appears that the choice of alternative energy sources for customers is a crucial thing, where in addition to the cost and convenience or convenience factors also contribute to the achievement of a service performance that impact on customer satisfaction and the creation of a good consumer loyalty. In this case PLN is the only state company that provides energy sources and is trusted to date. Increasingly the day consumers become better maintained, through the form of high service performance achievement. Starting from the ease of installation listrik, regular maintenance, energy stability, relatively low cost and minimal blackouts. In addition PLN has also set up service power failures for 24 hours non-stop even though the day off, and the public electricity users are also free to make complaints against the PLN electricity disturbance through online channel 123 and in the shortest tempo will be served maximally by the officer who is always ready. These are the things that make consumer loyalty more and more day is higher, begins from customer solution and customer's convenience then mediated by service performance and consumer satisfaction which perceived directly able to make loyal consumer, even if not one hundred percent.
2. Theoretical Frameworks 2.1 Marketing Concepts
The core concepts of marketing are the need, desire, demand, production, utility, value and satisfaction; exchanges, transactions and market relationships, marketing and markets. Needs, wants and demands are differentiated by everyone. Needs are a state of perceived lack of certain basic satisfaction. Desire is a strong will for specific satisfiers of deeper needs. While Demand is a desire for a specific product that is supported with the ability and willingness to buy it. These things lead or show activities related to marketing that actually occur in everyday life.
According to Alma (2011) is known some understanding of marketing as follows:
1) Charles F. Philips and Delbert J Duncan in his book "Marketing Principles and Methods states that" Marketing Who is often reffered to as distribution by businessman-include all the activities of consumers and users. This means that marketing by traders is meant to be equal to the distribution intended for all activities to deliver goods to consumers (household) and to industrial consumers. It is further added that excluding only such activities as involve a significant change in the form of goods. So in the marketing activities that does not include the activities of changing the form of goods that we encounter in the industry.
2) Maynard and Beckman in his book Principles of Marketing states "Marketing embraces all business activities involved in the flow of goods and services form physical production to consumption". This means marketing means all usha that includes the distribution of goods and services from the production sector to the consumption sector.
3) Paul D. Converse et al., In their book entitled "Elements of Marketing" is written as follows: "Marketing has been defined as the business of buying and selling, as well as business entities engaged in the flow of goods and services between producer and consumers ". That is, marketing consists of activities creating the use of place, time and ownership.
a. Marketing is connecting sellers with potential buyers.
b. Marketing is selling goods and the goods do not return to the seller. c. Marketing is providing a standard of living.
Based on the definition of marketing that has been put forward by these experts it can be concluded that as a vision, marketing must be a strategic business concept that can provide sustainable satisfaction, not a momentary satisfaction for the three main stakeholders in each company is customers, employees and owners of the company.
Service industry at this time is a very large economic sectors and grow very rapidly. Growth is in addition to the result of the growth of types of services that already existed, also caused by the emergence of new types of services, as a result of demands and technological developments.
These developments are ultimately able to provide strong pressure on regulatory overhaul, particularly the relaxation of protection and utilization of new technologies that directly impact on the strengthening of competence in the industry (Lovelock 2001).
This condition directly exposes the business to the increasingly high business competition issues. They are required to be able to identify the forms of competition to be faced, to set various standards of performance and to recognize their competitors well (Grant, 1997 and Smith 1997).
According to Payne (2000) service marketing is a process of perceiving, understanding, stimulating and meeting the needs of specially chosen target markets by channeling the resources of an organization to meet those needs. Thus, marketing management services is a process of aligning the resources of an organization against market needs. Marketing draws attention to the dynamic interrelationships between the company's products and services, the desires and needs of its customers and the activities of its competitors. Marketing function is composed of components, namely: 1) marketing mix; 2) market power and 3) alignment process. 2.2 Service Concepts
Kotler (2000) put forward the notion of service (service) is as follows: "A service is any act or performance that one party can offer to another that is essentially intangible and does not result in the ownership of anything. Its production may or ma not be tied to a physical product ". In this sense it is argued that a service is any action or performance offered by one party to another in principle intangibles and does not cause transfer of ownership. Production services may be bound or unbound to a physical product.
Stanton (2002) proposes the following definitions of service: "Service are identifiable, intangible activities that are the main object of a transaction designed to provide want-satisfaction to consumers. The services can be identified, intangible activity is the main object of a transaction designed to consider the satisfaction of the desires of the consumers. Through this definition we do not include support services that which supports the sale of other goods and services.
Further, in the opinion of Zeithaml and Bitner (2000) put forward the definition of services as follows: "Include all economic activites, the output is not a physical product or construction. as convenience, amusement, timelines, comfort or health) that are essentially intangible concerns of tis first purchaser ". Service is essentially all economic activity with output other than product in physical terms, consumed and produced at the same time, providing value added and intangible principle to its first buyer.
Based on the above definition it can be concluded that the service is basically something that has the following characteristics:
a. An intangible, but can meet the needs of consumers.
b. The service production process may use or not use the help of a physical product. c. Services do not result in the transfer of rights or ownership
d. There is an interaction between service providers and service users 2.3 Service Performance
Service performance is the performance of the service received by the consumer itself and assesses the quality of the service they actually feel (Cronin and Taylor 1994). Based on some researchers who disagree with Parasuraman, Zeithaml, and Berry are Cronin and Taylor (1992,1994) which states that the measurement of service quality as proposed by SERVQUAL model has caused confusion and meaning of double meaning. This author states that a performance-based measure will better reflect the quality of services. In addition, the researchers also acknowledge that the measurement of service quality with the SERVQUAL model forms a less powerful paradigm (Bitner, Bolton, and Drew 1992) because consumer expectations of service quality refers to consumer expectations of service providers in general, while perceptions of service performance leads to a more specific service company.
There is a serious problem in service quality that is expressed as the difference in value between consumer expectations and perceptions, so that the most appropriate use of service quality measurement is performance-based (Peter, Churchil, and Brown 1994). There is little evidence to support the relevance of distance or gaps
between expectations and perceptions as a basis for assessing service quality so SERVQUAL performance is a good predictor of both service quality and consumer satisfaction (Alford and Sherrell 1996).
Service performance is more able to answer the problems that arise in determining the quality of services because consumers will only be able to judge the quality they receive from a particular producer not on their perceptions of the quality of service in general (Bolton and Drew, 1991; Cronin and Taylor 1992; 1994 ; Teas 1993; Gotlieb, Grewal and Brown 1994)
Based on the above theories above can be concluded that service performance is the overall assessment of consumers on the results of services perceived when receiving services from service providers, so the quality of service / service more precise and specific using the service performance model.
2.4 Customer Satisfaction
Today the attention to customer satisfaction and dissatisfaction is getting bigger. The more parties are paying attention to this. The parties most directly related to customer satisfaction or dissatisfaction are consumer marketers, consumers, and consumer behavior researchers.
Tighter competition, where more and more producers are engaged in fulfilling the needs and wants of consumers, causes each company to place an orientation on customer satisfaction as the primary goal. This is reflected in the growing number of companies that include its commitment to customer satisfaction in its mission statement, and public relations release. Today it is increasingly believed that the key to winning the competition is to provide value and satisfaction to customers through the delivery of quality products and services at competitive prices.
In the context of product quality (goods and services) and customer satisfaction is reached the consensus that customer expectations play a important role as a comparative stasis in evaluating quality and satisfaction. According to Olsen & Dover (quoted in Zeithaml, et al., 1993), customer expectations or expectations are the beliefs of customers before trying or buying a product or service, which is used as a standard or reference in assessing the performance of the product or service concerned. However, the conceptualization and operationalization of customer expectations remains a controversial issue, especially regarding the characteristics of specific expectations standards, the number of standards used, and the source of expectations. Each consumer may have several different pre-consumption expectations. In addition, different consumers may also apply different types of expectations for different situations.
The word satisfaction derives from that latin "satis" (meaning good enough, adequate) and "facio" (do or make). Decisions can be interpreted as "an attempt to accomplish something" or "make an adequate". Oxford Advanced Learner's dictionary (2000) describes satisfaction as "the good feeling that you have when you reach something or when something that you want to happen does happen"; "the act of fullfilling a need or desire"; and "an acceptable way of dealing with a complaint, a debt, an injury, etc". As long as these definitions seem so simple, yet so attuned to the context of consumer management and behavior, the term becomes so complex. Even Richard L. Oliver (1997) in his book "Satisfaction: A Behavioral Perpective on the Consumer" states that everyone understands what satisfaction is, but once asked to define it, nobody seems to know.
In a customer satisfaction literature review conducted by Giese & Cote (2000), they identified 20 definitions referred to in customer satisfaction research over a 30-year period. Although these definitions vary (some are inconsistent with each other), the two experts from Washington State University have found similarities in terms of three main components: (1) customer satisfaction is a response (emotional or cognitive); (2) the response involves a particular focus (expectation, product, consumption experience, and so on); and (3) responses occur at any given time (after consumption, after product / service selection, based on accumulated experience and others). In short, customer satisfaction consists of components: a response to a particular focus that is determined at a given time.
Among the various variations available, so far the paradigm of disconfirmation is the most widely used and reference model (Churcill & Surprenant 1982; LaTour & Peat 1979; Oliver 1999; Spreng, Mac Kenzie & Olshavsky 1996; Tse & Wilton 1988). This paradigm asserts that the satisfaction/satisfaction of after-sale is determined by the evaluation of the consumer against the difference between initial expectations (or other comparative standards) and perceptions of actual product performance after product use.
2.5 Customer Loyalty
Companies are required to be able to foster their own competitive advantage through creative, innovative and efficient efforts, thereby becoming the choice of many customers who in turn are expected to be "loyal" (Javalgi 1997). Loyality is defined as non-random purchase expressed over time by some decision making unit. Based on these definitions, it appears that loyalty is directed to a behavior, shown in routine purchases, based on the decision-making unit (Griffin 2002). Oliver (1996) discloses the definition of customer loyalty as follows: "Customer loyalty is deefly held commitment to rebuy or repatronize a preferred product or service consistently in the future, despite situational influences and marketing efforts having the potential to cause switching behavior”.
From the above definition it can be seen that loyalty is a deep-seated customer commitment to re-subscribe or re-purchase consistent products / services consistently in the future, even though the influence of the marketing situation and efforts has the potential to cause behavioral change.
According to Smith (2002) it is revealed that customer loyalty can not be created simply, but must be designed by the company, as for its stages are: 1) Define customer value; 2) Design the branded customer experience; 3) Equip people and deliver consistency; and 4) Sustain and enhance performance. According to Hill (1996), customer loyalty is divided into six stages: suspect, prospect, customer, clients, advocates and partners.
Furthermore, Griffin (2002) also suggests the benefits that will be obtained if the company has a loyal consumer, among others: 1) Reduce marketing costs (because the cost to attract new customers is more expensive); 2) Reduced transaction costs, contract negotiation fees, order processing, and more; 3) Reduce the turn-over of consumers (due to fewer consumer turnover); 4) Increase cross selling, which will enlarge the company's market share; 5) Word of Mouth is more positive, assuming that loyal consumers also mean those who are satisfied, and; 6) Reduce the cost of failure (eg. replacement cost).
In addition also presented by Griffin (2002) that the characteristics of loyal customers include: 1) Perform repeat purchase regularly (repeat); 2) Buying outside the product / service line, 3) Inviting others (referrals); and 4) Demonstrate immunity from the pull of competition of other similar products (retention).
To be a loyal customer, one must go through several stages. This process takes a long time, with different emphasis and attention to each stage of the fund meeting the needs of each stage. By paying attention to each phase and meeting the needs in that phase, the company has a greater opportunity to form potential buyers into loyal customers and corporate clients.
3 Hypotheses
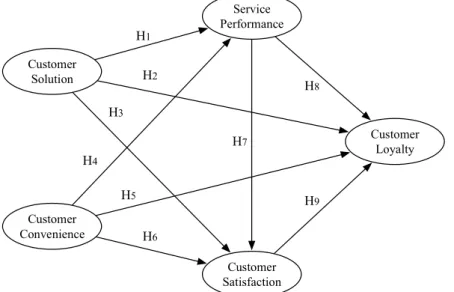
Based on the previous explanations, this study aims to test the following models and hypotheses:
H1 H2 H3 H4 H5 H6 H7 H8 H9 Customer Solution Customer Convenience Service Performance Customer Satisfaction Customer Loyalty
Figure 1. The Researh Conceptual Model and Findings
H1. Customer solution has a positive effect on service performance of business rate customer on PT Perusahaan Listrik Negara (Persero) Samarinda area.
H2. Customer solution has a positive effect on customer satisfaction of business rate customer on PT Perusahaan Listrik Negara (Persero) Samarinda Area.
H3. Customer solution has a positive effect on customer loyalty of customer business rates on PT Perusahaan Listrik Negara (Persero) Samarinda Area.
H4. Customer convenience has a positive effect on service performance of customer business rates on PT Perusahaan Listrik Negara (Persero) Samarinda Area.
H5. Customer convenience has a positive effect on customer satisfaction of customer business rates on PT Perusahaan Listrik Negara (Persero) Samarinda Area.
H6. Customer convenience has a positive effect on customer loyalty of customer business rates on PT Perusahaan Listrik Negara (Persero) Samarinda Area.
H7. Service performance has a positive effect on customer satisfaction of customer business rates on PT Perusahaan Listrik Negara (Persero) Samarinda Area.
H8. Service performance has a positive effect on customer loyalty of customer business rates on PT Perusahaan Listrik Negara (Persero) Samarinda Area.
Listrik Negara (Persero) Samarinda Area.
4 Research Method
This study was designed to analyze the relationship between the variables used, including the practice of marketing management, customer solution, customer convenience, service performance, customer satisfaction and customer loyalty. This study uses quantitative approach. Thus, the logic is hypothetical verification. The approach begin deductive reasoning to derive the hypotheses, and then testing in the field. The conclution drawn based on empirical data. Thus there are more emphasis on quantitative research indices and empirical measurement. Quatitative researches to developing design is always a plan of activities that are a priority and definitive.
The population in this study were all 330 customer business rates on PT Perusahaan Listrik Negara (Persero) Samarinda Area. Determination of the samples was done by using Slovin method, with error rate of 5% to produce a sample of 181 respondents.The samples were taken by distributing a list of questionnaires with semantyc differential type to all respondents including customers of business rates at PT PLN (Persero) of Samarinda area, at least in the last 6 months as the customers.
5 Analysis and Results
5.1 Outer Loading Variable Indicator
The results of all respondents' responses are recapitulated and processed into a model of Structural Equation Modeling with the help of Smart PLS 3.2.7 software. The result of statistical analysis is then further processed up into the final result of the research. Smart PLS could be simultaneously to analyze the constructs formed with reflective and formative indicators, but in this research all is used reflective indicator.
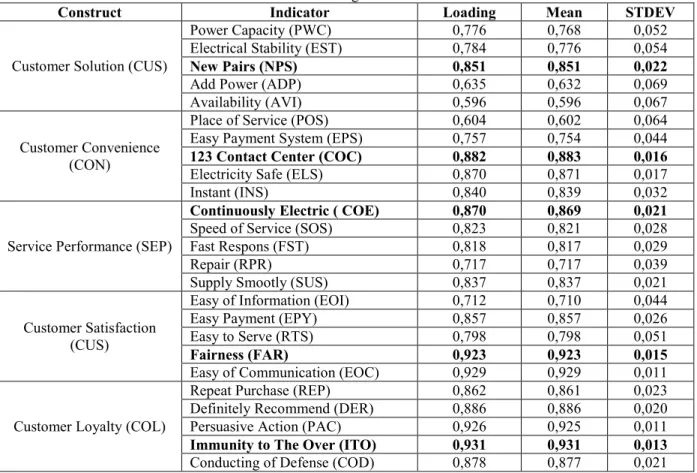
Table 1. Outer loading variable indicator
Construct Indicator Loading Mean STDEV
Customer Solution (CUS)
Power Capacity (PWC) 0,776 0,768 0,052
Electrical Stability (EST) 0,784 0,776 0,054
New Pairs (NPS) 0,851 0,851 0,022
Add Power (ADP) 0,635 0,632 0,069
Availability (AVI) 0,596 0,596 0,067
Customer Convenience (CON)
Place of Service (POS) 0,604 0,602 0,064
Easy Payment System (EPS) 0,757 0,754 0,044
123 Contact Center (COC) 0,882 0,883 0,016
Electricity Safe (ELS) 0,870 0,871 0,017
Instant (INS) 0,840 0,839 0,032
Service Performance (SEP)
Continuously Electric ( COE) 0,870 0,869 0,021
Speed of Service (SOS) 0,823 0,821 0,028
Fast Respons (FST) 0,818 0,817 0,029
Repair (RPR) 0,717 0,717 0,039
Supply Smootly (SUS) 0,837 0,837 0,021
Customer Satisfaction (CUS)
Easy of Information (EOI) 0,712 0,710 0,044
Easy Payment (EPY) 0,857 0,857 0,026
Easy to Serve (RTS) 0,798 0,798 0,051
Fairness (FAR) 0,923 0,923 0,015
Easy of Communication (EOC) 0,929 0,929 0,011
Customer Loyalty (COL)
Repeat Purchase (REP) 0,862 0,861 0,023
Definitely Recommend (DER) 0,886 0,886 0,020
Persuasive Action (PAC) 0,926 0,925 0,011
Immunity to The Over (ITO) 0,931 0,931 0,013
Conducting of Defense (COD) 0,878 0,877 0,021
Based on the description of Table 1, it can be seen indicator of each construct that has dominant influence. Customer solution (CUS) is dominated by New Pairs (NPS) as variable indicator, Customer Convenience (CON) is dominated by variable indicator of Contact Center 123 (COC), Service Performance (SEP) is dominated by Continuously Electric (COC) as variable indicator, Customer Satisfaction (CUS ) is dominated by indicator of Fairness variable (FAR) and Customer Loyalty (COL) is dominated by variable indicator of Immunity to The Over (ITO).
5.2 Evaluate of Outer Model Reflesive Construct
AVE in Table 2. as follows:
Table 2. Value of average variance extracted (AVE)
Cosntruct Loading Mean STDEV
Customer Solution 0,540 0,537 0,037
Customer Convenience 0,636 0,636 0,033
Service Performance 0,663 0,663 0,027
Customer Satisfaction 0,719 0,719 0,029
Customer Loyalty 0,805 0,804 0,021
Based on AVE values generated by all or all of the reflexive constructs that are above > 0.50 so as to meet the requirements of convergent validity and reliability (Chin, 1998), (Chin, 2010b), (Hair et el., 2011), (Hair et.al, 2012).
The evaluation of reliability in the structural model in the reflexive construct can also be seen with Composite Reliability, so it can be seen in Table 3. as follows:
Table 3. Composite reliability
Construct Loading Mean STDEV
Customer Solution 0,852 0,849 0,020
Customer Convenience 0,896 0,895 0,014
Service Performance 0,908 0,907 0,011
Customer Satisfaction 0,927 0,926 0,010
Customer Loyalty 0,954 0,953 0,014
Based on the value of Composite Reliability generated by all reflexive constructs that are above > 0.70 so it can be concluded that all reflexive construction indicators are reliable or meet the reliability test (Chin. 1998), (Chin, 2010b), (Hair et el., 2011), (Hair et.al, 2012).
5.3 Evaluate of Inner Model
The next is the evaluation of the inner model in this study, presented in Table 4. as follows: Table 4. Evaluation of R square value
Construct R Square T Statistics P Values
Customer Loyalty 0,693 15,752 0,000
Customer Satisfaction 0,683 17,627 0,000
Service Performance 0,665 16,162 0,000
Based on Table 4. it can be seen that R Square for service customer loyalty is equal to 0.693 or belong to a strong category, R Square customer satisfaction is equal 6,683 as strong category and while R Square service performance is equal to 0.665 or included also into a strong category.
In general, structural models can also be measured using predictive-relevance (Q2) values. The predictive-relevance value is calculated by the formulation:
Q2 = 1 - (1 - R
2) (1 - R
) ... (1 - R
)
1 2 2 2 p As for the value of R2 for each endogenous variable, as follows:Table 5. Endogenous variable of R square value
Cosntruct R Square
Customer Loyalty 0,693
Customer Satisfaction 0,683
Service Performance 0,665
Predictive Relevance (Q2) 0,845
Based on Table 4. it can be seen that Q2 predictive-relevance is 0.845 or Q2 > 0 indicates the model has predictive relevance, and in this case q2predictive relevance 0.687 > 0.35 is quite strong (Cohen, 1988), (Chin. 1998), (Chin, 2010b), (Hair et el., 2011), (Hair et.al, 2012). These results also show that in general the model of 68% is explained by service performance and job satisfaction, while the remaining 32% is explained by other variables as well as error factors, whether in the form of customer loyalty, service quality and others.
5.4 Test of First Order Construct Reflexive Indicator
The results of path analysis can be presented in appendix 4 in the results of this study and the hypothesis testing of this study was conducted by looking at the pathways on a significant structural model. Significant pathways and effects can be seen in the partial path coefficient test, using the t test (t-test), or by looking at the significance level. Partial test results on the path coefficient on each path with the value of loading or coefficients can be seen in Figure 2. as follows:
Figure 2. First Order Confirmatory Factor Analysis Reflexive Indicator 5.5 Summary of Hipotheses Test Result
Based on the results of the CFA it can be seen the direct and indirect effects between constructs, including the level of significance into Table 5. as follows:
Tabel 6. Summary of research hypotheses test result
Exogenous Veriables Mediator Variables Endogenous Variables
Direct Effects Indirect Effects Path
Koef. Statistic T- Koef. Path Statistic T- Value P Inf
Customer Solution Service Performance 0,031 0,616 0,538 NS
Customer Solution Customer Satisfaction 0,176 3,541 0,000 S
Customer Solution Customer Loyalty 0,041 0,847 0,397 NS
Customer Convenience Service Performance 0,801 22,563 0,000 S
Customer Convenience Customer Satisfaction 0,287 3,342 0,001 S
Customer Convenience Customer Loyalty -0,026 0,281 0,779 NS
Service Performance Customer Satisfaction 0,479 6,031 0,000 S
Service Performance Customer Loyalty 0,824 11,152 0,000 S
Customer Satisfaction Ciustomer Loyalty 0,015 0,186 0,853 NS
Customer Solution Customer Satisfaction Customer Loyalty 0,003 0,176 0,861 NS Customer Solution Service Performance
Customer Satisfaction Customer Loyalty 0,006 0,182 0,855 NS Customer Solution Service Performance Customer Loyalty 0,026 0,611 0,541 NS Customer Solution Service Performance Customer Satisfaction 0,015 0,609 0,543 NS Customer Convenience Customer Satisfaction Customer Loyalty 0,004 0,176 0,860 NS Customer Convenience Service Performance
Customer Satisfaction Customer Loyalty 0,000 0,091 0,928 NS Customer Convenience Service Performance Customer Loyalty 0,660 9,418 0,000 S Customer Convenience Service Performance Customer Satisfaction 0,348 5,580 0,000 S Explanation:
H0 accepted if -1.96 > = Z < = 1.96 (Not significant/NS) H1 accepted if Z > 1.96 or Z < -1.96 (Significant/S) P Values > 0.05 (Not significant/NS)
P Values < 0.05 (Significant/S)
5.6 Matrix of Influence Between Latent Variables
Tabel 7. Results matrix of influence between variables Variables Performance Service Satisfaction Customer Customer Loyalty
Service Performance > Customer Loyalty Service Performance > Customer Satisfaction Customer Satisfaction > Customer Loyalty Service Performance >Customer Satisfaction > Customer Loyalty Customer
Solution Positive and not significant
Positive and
significant Positive and not significant
Positive and
not significant Positive not significant and Positive and not significant Positive significant and not Customer
Convenience Positive and significant Positive and significant Negative and not significant
Positive and
significant Positive significant and Positive and not significant Positive significant and not Service
Performance
Positive and
significant Positive and significant Customer
Satisfaction Positive and not significant
6 Conclution
This result has provided the first empirical insight, namely the direct influence of variables without mediation. In the first finding, the customer solution has no effect on service performance, which in this case indicates that every new electrical installation has not shown optimal performance of PLN and after enjoying some time then it will show the actual service performance. There is a serious problem in service quality that is expressed as the difference in value between consumer expectations and perceptions, so that the most appropriate use of service quality measurement is performance-based (Peter, Churchil, and Brown, 1994). Customer solution has a positive and significant impact on customer satisfaction, which in this case indicates that the installation of new electricity will be able to make consumers feel their needs can be met as expected. Customer solution has no significant effect on customer loyalty, which is caused by any new installation of electrical energy by PLN not necessarily can be directly seen the performance given in a short time so that the customer is still uncertain. Customer convenience has a positive and significant impact on service performance, in which PLN has provided 123 call centers capable of serving every customer's complaint at all times and this shows that there is a responsibility of PLN to its customers. Among the various variations available, so far the paradigm of disconfirmation is the most widely used and reference model (Churcill & Surprenant, 1982; LaTour & Peat, 1979; Oliver, 1999; Spreng, Mac Kenzie & Olshavsky, 1996; Tse & Wilton, 1988). Customer convenience has a positive and significant impact on customer satisfaction and it shows that every customer's complaint and desires can be handled properly and ready to complete all the time by PLN through a call center system that can make customers feel their expectations can be met well. Customer convenience has no significant effect on customer loyalty and this condition indicates that there could be a time when PLN is unable to provide services expected by the customer, for example when there is heavy rain or other non-technical disorder suddenly and of course personal serving has not been able to provide its servants optimally due to delays. Service performance has a positive and significant impact on customer satisfaction and this situation indicates that PLN is able to perform well and provide professional servant to every customer request. This result are able to represent the opinion of Zeithaml and Bitner (2000) put forward the definition of services as follows: "Include all economic activities, the output is not a physical product or construction. as convenience, amusement, timelines, comfort or health) that are essentially intangible concerns of tis first purchaser". Service performance has a positive and significant impact on customer loyalty, which shows that through professional service provided by PLN can make customers more satisfied and always have a high dependence on PLN although there are alternative energy sources in the form of generator sets and other machines, but PLN service expertise is able to captivate the customers. In addition also presented by Griffin (2002) that the characteristics of loyal customers include: 1) Perform repeat purchase regularly (repeat); 2) Buying outside the product / service line, 3) Inviting others (referrals); and 4) Demonstrate immunity from the pull of competition of other similar products (retention). Customer satisfaction does not have a significant effect on customer loyalty, in which case there could be a mistake or a long-term PLN power outage, caused by PLN engine maintenance periodically and it takes up to one day. This can disrupt the activities of customers in their each life, especially those who have business in his house will be disturbed. These findings are in line with opinions Olsen & Dover (quoted in Zeithaml, et al., 1993), customer expectations or expectations are the beliefs of customers before trying or buying a product or service, which is used as a standard or reference in assessing the performance of the product or service concerned.
In the second finding, where the mediation effect of intermediate variables is able to be a bridge between the latent variables. The findings of this study indicate that only service performance variables are able to mediate between customer convenience variables to customer satisfaction and customer loyalty. This shows that PLN has a good service performance, in which they guarantee that the electricity energy generated and distributed to each customer will be sustainable and have good electrical stability. Even PLN has been using
technology Repair without Electricity Repair, meaning that customers do not have to worry, the electricity will remain alive and distributed despite being repaired by PLN officers who are specialized in this field. This is what can be a means that bridges the convenience of customers to give birth to a better loyalty to PLN. These result also represent form the statement by Griffin (2002) that the characteristics of loyal customers include: 1) Perform repeat purchase regularly (repeat); 2) Buying outside the product / service line, 3) Inviting others (referrals); and 4) Demonstrate immunity from the pull of competition of other similar products (retention).
These findings are in line with opinions, that service performance is more able to answer the problems that arise in determining the quality of services because consumers will only be able to judge the quality they receive from a particular producer not on their perceptions of the quality of service in general (Bolton and Drew, 1991; Cronin and Taylor, 1992, 1994; Teas 1993; Gotlieb, JB Grewal and Brown, 1994). In line with according to Payne (2000) service marketing is a process of perceiving, understanding, stimulating and meeting the needs of specially chosen target markets by channeling the resources of an organization to meet those needs.
References
Alma, Buckhari. 2011. Manajemen Pemasaran dan Pemasaran Jasa. Bandung: Alfabeta.
Andrian, Payne. (2000). The Essense of Service Marketing, New Delhi: Prentice Hall of India Private Limited. Bolton, R.N. and Drew,J.H. (1991). “A Longitudional Analisis of the impact of service changes on customer
attitudes,” Journal of Marketing, 55 (January): 234-345.
Chin, W.W. (1998). The partial least squares approach for structural equation modeling in G.A Marcoulides (Ed.), Modern methods for business research (pp.295-236), London: Lawrence Erilbaum Associates. Chin, W.W. (2010a). Boostrap Cross-Validation Indices for PLS Path Model Assessment In V.E Vinzi, W.W,
Chin, J, Henseler, & H, Wang (Eds.), Handbook of partial least squares: concepts, methods and applications in marketing and related fields (pp.83-97), Berlin: Springer.
Chin, W.W. (2010b). How to write up and report PLS analysis In V.E. Vinzi, W.W. Chin. J. Henseler, & H. Wang (Eds.), Handbook of partial least squares: Concepts, methods and applications in marketing and related fields (pp.655-690). Berlin: Srpinger.
Cronin, J. and Taylor, SA. (1992). “Measuring service quality: A Re-examination and Extension,” Journal of Marketing, 56 (July): 55-67.
Churchill, G.A. and Suprenant, C. (1982),”An Investigation into the determinants of customer satisfaction”, Jurnal of Marketing Research 19 (November): 491-504.
Javalgi, G., Rajshekhar, Cristopher R Moberg, (1997). Service Loyalty Implications for Service Providers, The Journal of Service Marketing, Vol.11, No.3, 165-179.
LaTour, S.A., Peat, N.C. (1979). Conceptual and Methodological Issue in consumer satisfaction research, Ralp dan, Bloomington Wilkie, W/L/ (Eds.), In: Indiana University Press.
Gotlieb, J.B.: Grewal, D and Brown SW (1994). “Consumer satisfaction and perceived Quality: Complimentary or divergent constructs,” Journal of Applied Psycology, 79(6): 875-885.
Giese, J.L., & Cote, J.A. (2000). Defining Consumer Satisfaction, Academy of Marketing Science, Vol. 2000, Number 1, p.1-24.
Grant, Allison. (1997). Standards Measure and Performance Indicator, Handbook of Customer Service, England, Gower Publishing Limited.
Hair, J.F., Ringle, C.M., and Sarstedt, M. (2011). “PLS-SEM: Indeed A Silver Bullet,“ Journal of Marketing Theory and Practice (19:2), pp. 139-150.
Hair, J.F., Sarstedt, M., Ringle, C.M., and Mena, J.A. (2012). “An Assessment of the Use of Partial Lesat Squares Structural Equation Meodeling in Marketing Research,” Journal of The Academy of Marketing Science (40:1), pp.414-433.
Hill, Niegel, (1996). “Hand Book of Customer Satisfaction Measurement”, England: Gower Publishing.
Kashyap R., (2001). The Effects of Service Guarantees on External and Internal Markets, Academy of Marketing Science Review.
Smith, Jan, E. (1997). Customer Service as a Product, Handbook of Customer Service, England: Gower Publishing
Oliver, Richard L. (1999). When Customer Loyalty, Journal of Marketing, Vol.63.pp.33-34 (Special Issues). Philip Kotler. (2000),”Principle of Marketing”. New Delhi 110001: Prentice Hall of India Private Limited. Parasuraman, a., Zeithaml, V.A and Berry, L.L. (1988), “SERVQUAL: A Multiple item scale for measuring
consumer perceptions of service quality, “ Journal of Retailing, Vol.64(1): 12-40.
Spreng, R., MacKenzie & Olshavsky. (1996). A Re-examination of the determinants of consumer satisfaction. Journal of marketing, 60(3), 15-32.
Teas, K.R. (1994). “Expectations as a Comparison standard in measuring service quality: An assessment of Re-assessment,” Journal of Marketing, 58 (January): 132-139.
Research, 25, 204-212.
Voss, G.B. and Parasuraman, A. et al., (1998). “The role of Price: Performance and Expectations in Determining Satisfaction in Service Exchange”, In: Journal of Marketing, Vol.62 October, S.46-61.