User manual
Database Import Wizard
For the latest news and the most
up-to-Document history
Version Comment
Version 1.0 Database Import Wizard for version 2.1 of the QSAR
Toolbox
Issue date:
April 2011Language:
EnglishTable of Contents
Document history ... 1
Document history ... 2
1 Executive summary ... 4
2 QSAR Toolbox data model ... 4
3 Import layouts ... 5
3.1 Vertical layout ... 5
3.2 Horizontal layout ... 6
4 Endpoint tree path ... 7
5 Building the dynamic tree ... 8
6 Running the import wizard ... 12
6.1 Vertical ... 13
6.2 Horizontal ... 16
Appendix I: Preparing a file for horizontal import ... 19
Appendix II: Import example for a database with ecotoxicological information31 Appendix III: Import example for database with Human health hazards Information ... 47
Appendix IV: Import example for database with Human health hazards Information ... 59
1
Executive summary
The QSAR Toolbox Database Import Wizard, together with the IUCLID 5 import wizard (see guidance document “IUCLID 5 Import/Export via Webservices”), is the entry point for importing custom user data to the QSAR Toolbox database. It can import XLS files (Excel 97-2003 version) as well as TXT (UNICODE) plain text files. Both file types pertain to how the data is read by QSAR Toolbox, but not how the data is parsed afterwards.
2
QSAR Toolbox data model
The QSAR Toolbox operates with the following data model:
Value*
Metadata(type String)
Title String value
Title 1 Value 1
: :
Title N Value N
Data point record
Endpoint (string)
Endpoint description(string) Duration (Value)
Is Private (Boolean) Is Observed (Boolean)
Metadata (type Value)
Title Value
Title 1 Value 1
: :
Title N Value N
The Import’s function is to translate the information in a file (be it XLS or TXT), separate it in different chunks (see the figure above) and write them into the database. The information consists of the chemical connected with numerical and meta-data. In other words the point of the import is to define a list of data points (the number that the user sees in the data-matrix and uses for gap-filling) with its corresponding metadata, namely the additional information on duration, test organisms, endpoint etc. In order to properly parse the information the import expects one of two file layouts as outlined below.
3
Import layouts
The two layouts the QSAR Toolbox can parse are the so called Vertical layout and the Horizontal layout. The Horizontal layout has each data point, with its
corresponding chemical and metadata, defined in a single row. In a way each
row is a single record (hence “horizontal”). The Vertical layout on the other
hand can have multiple records on each row with the metadata for each
record defined on a column by column basis (hence “vertical”).
3.1
Vertical layout
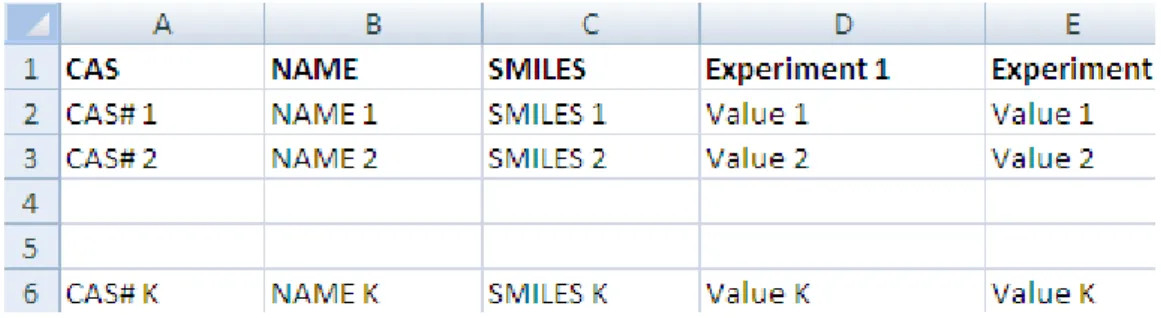
This layout is used where there is a list of chemicals and a result for each chemical, but all results have the same metadata. So the chemical is defined in the first columns, and the next columns are used for the data points. For each data column there is one set of metadata. This means the vertical layout can import multiple values for a chemical.
Figure 2: Vertical layout
Figure 2 illustrates the format of an XLS file for import. The first three columns represent the chemical identity information and column D and E represent results from two different “experiments” (a package of metadata such as Organ,
Duration, Temperature, Dose, Species, Endpoint etc.).
3.2
Horizontal layout
This layout is used when each data point is defined in a row. Here the user specifies in which column is the data, the metadata and the type of metadata.
Figure 3: Horizontal layout
Figure 3 shows how an XLS file could look like for horizontal import. Each row defines a record in its entirety. At import time the user specifies which columns
4
Endpoint tree path
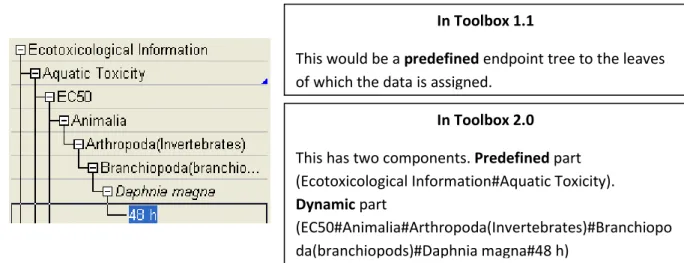
When a data point is imported into the QSAR Toolbox, the database engine needs to assign it to a leaf node in the endpoint tree. However, the way the endpoint tree is constructed differs significantly from version 1.1 of the QSAR Toolbox. For the user the tree looks similar in both versions, but the underlying logic has changed.
Figure 4: Endpoint tree in Toolbox version 1.1 vs. Endpoint tree in QSAR Toolbox version 2.0
In Toolbox 1.1 the tree displayed in the data-matrix was predefined and data could be imported to any of its leaves. In the QSAR Toolbox 2.0 however the
data-matrix displays not only the predefined part of the endpoint tree but also
builds a dynamic part based on the metadata of the currently displayed data points and/or QSARs.
To check which part is predefined and which part is dynamic press the Ctrl key and the predefined part of the tree will be underscored.
In Toolbox 1.1
This would be a predefined endpoint tree to the leaves of which the data is assigned.
In Toolbox 2.0
This has two components. Predefined part (Ecotoxicological Information#Aquatic Toxicity).
Dynamic part
(EC50#Animalia#Arthropoda(Invertebrates)#Branchiopo da(branchiopods)#Daphnia magna#48 h)
5
Building the dynamic tree
The dynamic tree is a feature of the QSAR Toolbox where the endpoint tree is expanded with nodes that organize the data point’s metadata. In essence it is a way to visualize the data the user has gathered from the database. The data is
assigned to a path (what we call predefined path). The dynamic part of the
tree is a function of the data point’s metadata. It is an instruction that the user has given to the QSAR Toolbox software requiring that the data point’s metadata are connected with metadata fields in a specific order. The metadata fields and
their hierarchy are called the Set tree hierarchy feature.
It is important to make the distinction between what is the data point’s
endpoint tree path and on what node the data point is displayed on the data-matrix. The first one is an immutable attribute of the data point, and the latter is
an undefined path that is build at runtime based on the endpoint tree path, the
loaded data point’s metadata and the current settings of the Set tree hierarchy
feature.
How does the above pertain to the import?
All the Aquatic Toxicity data in the QSAR Toolbox is assigned to the
Ecotoxicological Information#Aquatic Toxicity path. However, whenthe user installs the QSAR Toolbox and loads data for aquatic toxicity, the entire tree
Where do the other fields come from?
The other fields come from the data point’s metadata. The metadata fields build the dynamic part of the endpoint tree -
LC50#Animalia#Arthropoda(Invertebrates)#Branchiopoda(branchiopod s)#Daphnia magna#48 h.The data point itself is associated to the shallow (predefined part) of the tree - Ecotoxicological Information#Aquatic Toxicity.
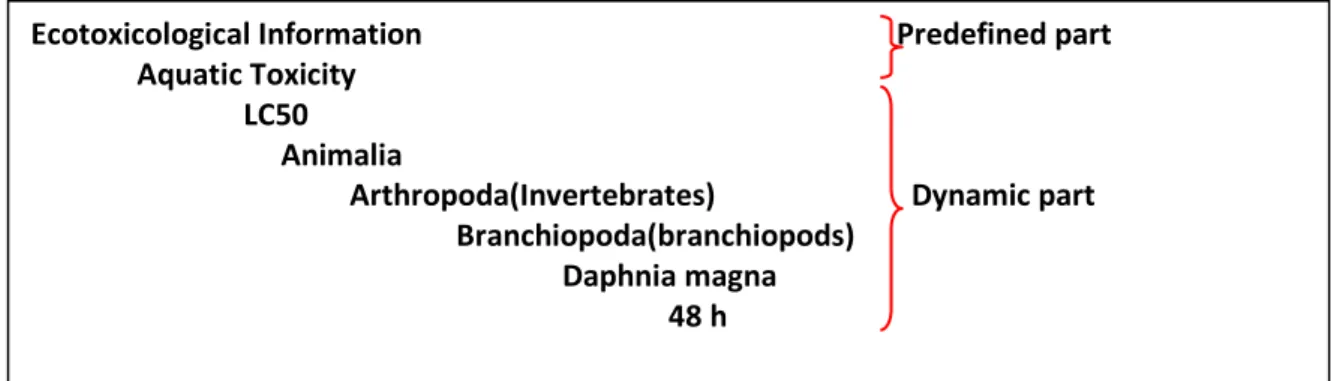
When a data point is read from the database and needs to be displayed to the data-matrix, the tree is expanded to display the metadata of the data points (Set tree hierarchy feature):
Figure 5: Endpoint tree hierarchy
*Taxonomy data – A large diversity of species has been stored and organized in Toolbox Taxonomy library including more than12,295 biological species. Species have been distributed in five kingdoms: Animalia, Plantae, Fungi, Protozoa and Monera. Biological information is organized in the following taxa: Kingdom/Phylum/Class. Scientific information is associated automatically to each of the biological species. LC 50 Daphnia magna Kingdom Phylum Class 48 h *Taxonomy data Ecotoxicological Information Predefined part
Aquatic Toxicity LC50
Animalia
Arthropoda(Invertebrates) Dynamic part Branchiopoda(branchiopods)
Daphnia magna
The QSAR Toolbox has default settings regarding which metadata is displayed. The default fields used are Endpoint, Duration, Test organisms (species), Effect, Effect type, Metabolic activation, Sexual maturation (offspring), Strain, Test type, Type of genotoxicity, Type of method, Tissue, Organ, Route. The list with
default fields pertains to the whole endpoint tree. For Ecotoxicological
Information#Aquatic Toxicity the default hierarchy is
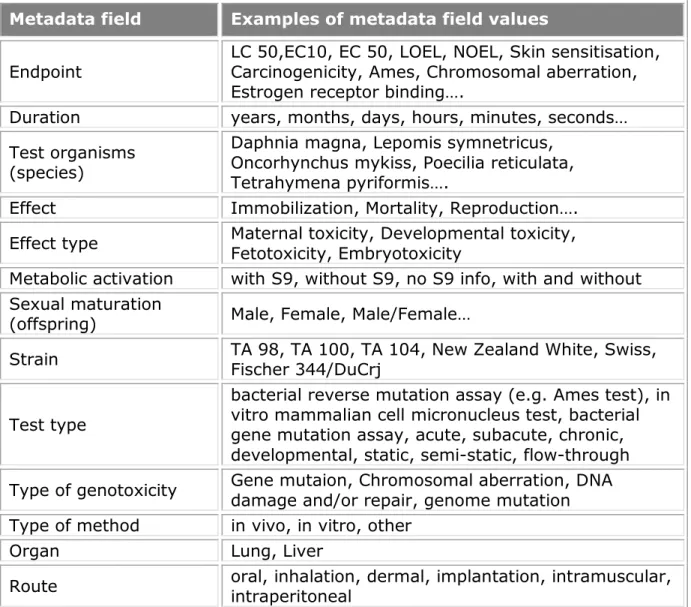
Effect#Endpoint#Duration#Test organisms (species). Table 1: Examples of metadata field values
Metadata field Examples of metadata field values
Endpoint LC 50,EC10, EC 50, LOEL, NOEL, Skin sensitisation, Carcinogenicity, Ames, Chromosomal aberration,
Estrogen receptor binding….
Duration years, months, days, hours, minutes, seconds…
Test organisms (species)
Daphnia magna, Lepomis symnetricus, Oncorhynchus mykiss, Poecilia reticulata, Tetrahymena pyriformis….
Effect Immobilization, Mortality, Reproduction….
Effect type Maternal toxicity, Developmental toxicity, Fetotoxicity, Embryotoxicity
Metabolic activation with S9, without S9, no S9 info, with and without
Sexual maturation
(offspring) Male, Female, Male/Female…
Strain TA 98, TA 100, TA 104, New Zealand White, Swiss, Fischer 344/DuCrj
Test type
bacterial reverse mutation assay (e.g. Ames test), in vitro mammalian cell micronucleus test, bacterial gene mutation assay, acute, subacute, chronic, developmental, static, semi-static, flow-through
This means that if a user wants to have a consistent display of the endpoint tree, he/she must import the metadata to the aforementioned fields before defining additional fields. For instance the above long path has two components – predefined and dynamic:
• Predefined: Ecotoxicological Information#Aquatic Toxicity
• Dynamic:LC50#Animalia#Arthropoda(Invertebrates)#Branchiopod
a(branchiopods)#Daphnia magna#48 h
In the Import wizard these two translate to Endpoint tree path (Figure 5) and
metadata (Figure 6). The
Animalia#Arthropoda(Invertebrates)#Branchiopoda(branchiopods) part is a separate feature in which Kingdom#Phylum#Class information is inserted
before the field Test organisms (species). In this respect the user should take
extra caution to import species information to the Test organisms (species)
metadata field.
Figure 5: Endpoint tree path
Metadata information should always be provided for the fields Test
organisms (species), Duration and Endpoint.
6
Running the import wizard
The import wizard is organised in a three step process:
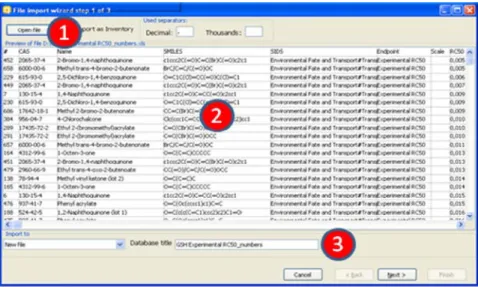
First step (Figure 7): The first window of the import wizard outlines the open
file control [1], the file review pane [2], database name edit box[3], the used
decimal and thousands separators and the import as inventory check box. It is very important that the thousands and decimal separators are properly set while importing. Especially with TXT file this could lead to erroneous parsing of results.
6.1
Vertical
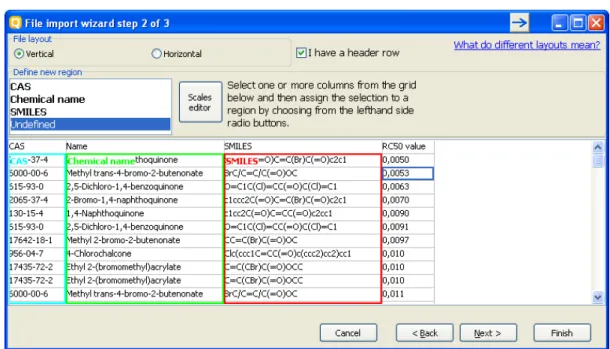
Figure 8: Import wizard step 2 (vertical import)
The second step window (Figure 8) contains the CAS, Chemical name and
SMILES columns. Here is also a button that invokes the Scales definitions editor in case the user wants to import categorical data that has no available scale.
The type of the column is specified by clicking on the column and then selecting its type (CAS/Chemical name/SMILES) from the list box above.
To remove designations click a column and then click on Undefined from
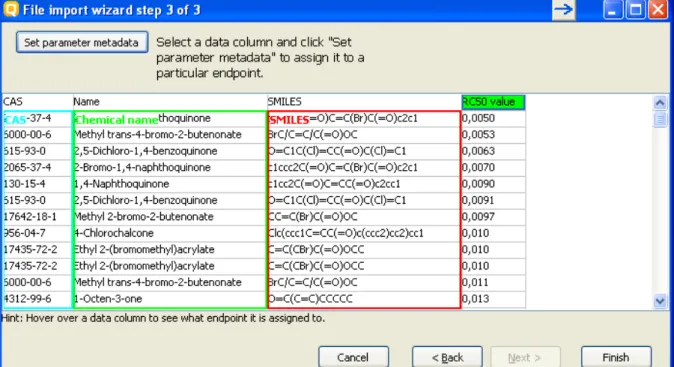
Figure 9: Import wizard step 3 (vertical import)
The third step of the vertical import (Figure 9) is where the user specifies the meaning of the different results columns. In the example above it is only one (RC50 value), but the import can handle multiple columns at once. To set the column metadata double-click on the column or click on the column and press “Set parameter metadata”. This will bring up the metadata editor (Figure 10).
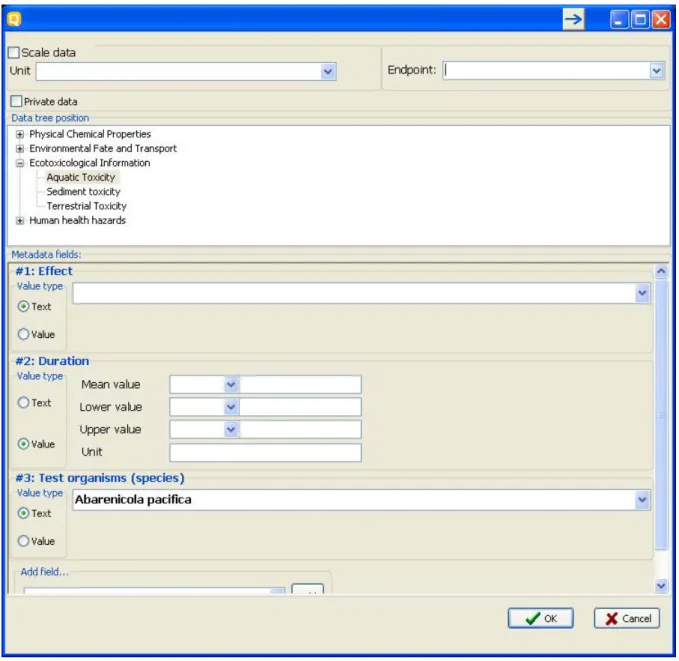
Figure 10: Metadata editor
The most important part of the metadata setup is setting the “Data tree
position” it should be a leaf from the displayed endpoint tree. If the column
contains categorical data the user should check the “Scale data” checkbox and
specify the Scale for the values in the column.
In the “Metadata fields” panel the user can enter a list of the metadata for the
simple string while the latter is a Mean/Lower value/Upper value
combination.
The Vertical import imports the data column without qualifiers and only to the Mean part of the data point record. If the user wants to enter qualified numbers or Mean/Low/Max combinations it is recommended to use the
Horizontal layout.
After all metadata is set for all columns the user should press Finish. After the
process is finished, an “Import successful” message will be displayed and the
wizard will close.
6.2
Horizontal
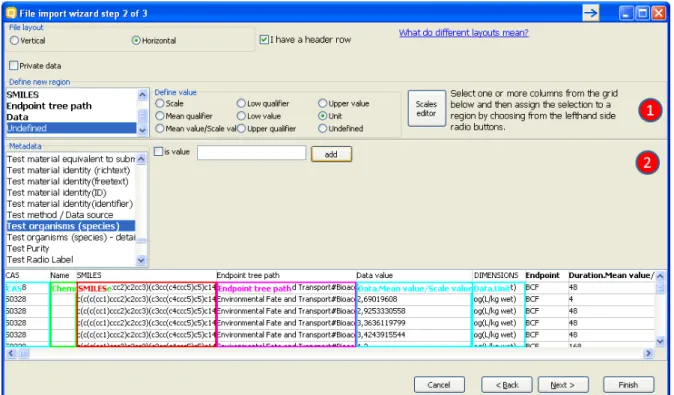
The Horizontal layout is selected from a radio-button group in the second step of the import. There are basically two things the user can define, marked (1) and (2) in figure 11 below.
First, in the “Define new region” panel are the CAS, NAME, SMILES,
Endpoint tree path and Data items. When they are defined the minimum is met.
Figure 11: Import wizard step 2 (horizontal import)
The type of the column is specified by clicking on the column and then clicking its type (CAS/Chemical name/SMILES) from the list box in the
Define new region panel or selecting a metadata field label from the list
box in the Metadata panel. To remove designations click a column and
then click on Undefined from the list box.
The definition of the Data region has its particularities. The data-record can
contain categorical data - which would require two columns, one for the Scale, and one for the Value of the record. On the other hand the data-record can contain a value – which in the QSAR Toolbox is a packet of Mean/Min/Max value
plus corresponding qualifiers and a Unit. These two are combined in the Define
When defining the data record the user should define:
I. For categorical data – Scale column for the scale name. This
should contain a name of a scale exactly as defined in the scales
list in the QSAR Toolbox database. The Mean value/Scale
value column should contain a value that is exactly one of the scale’s members
II.For value data – At least one column for the Mean/Min/Max
values. Qualifiers and Unit are optional
Second is the “Metadata” panel. The data there is not mandatory for the import
but can be used to import additional data to the data value. Defining numerical metadata is just like the data-record value definition process.
The third stage of the horizontal import is for review purposes. It is
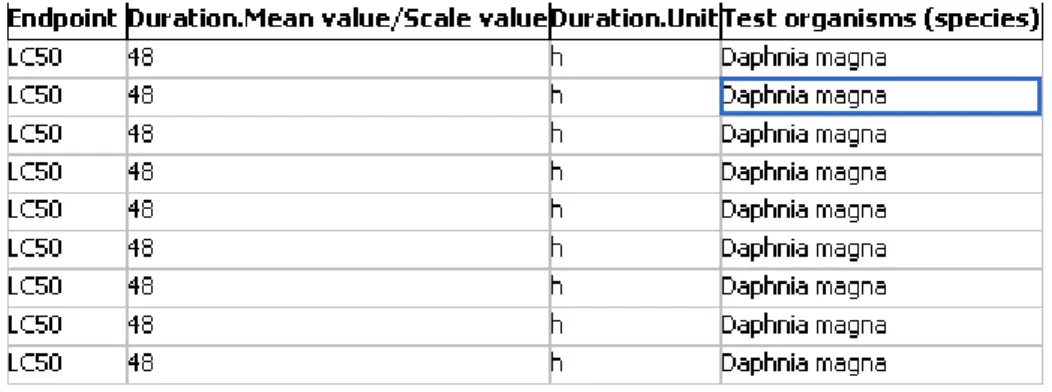
recommended that the user should look again at each column that is to be imported. The data record regions will be marked with color and text. The metadata fields are marked with a bold text over the first row for each column. The metadata of type value will be marked with <name of
metadata>.<data_subtype> (for example “Duration.Units”).
Where all columns are set and double-checked, the user should press Finish.
After the process is finished, an “Import successful” message will be displayed
Appendix I: Preparing a file for horizontal import
File layout
A file prepared for import should follow the layout as shown in chapter 3.
Horizontal layout - this layout is used when the file is in the form where a row defines a single data point. Here the user specifies which column is the data, which column is metadata and the type of metadata.
Figure 1. File layout for horizontal import
Figure 1 illustrates the format of an XLS file for horizontal import. Each row defines a record in its entirety. At import time the user specifies which columns has chemical identity information (CAS, Name, SMILES), which columns contain the values (what is seen in the Data-matrix and used in Data-gap filling) and which columns contain the metadata (Organ, Duration, Temperature, Dose, Species, Endpoint etc.).
Content of file for import:
Any file to be imported should contain:
o fields with structural information (chemical identity)
o a field with the Endpoint tree path
o fields with endpoint data information (experimental results and
metadata)
The endpoint tree path should point to a leaf of the predefined endpoint
tree. For more information check chapter 4: Endpoint tree path of this
Structural information (chemical identity)
1. CAS field – Column with CAS Registry numbers
2. Name field – Column with Chemical Name(s)
o Field with Endpoint tree path (Predefined path)
Endpoint tree path
This is a field containing the endpoint tree path related to the endpoint for which experimental data is to be imported. The endpoint tree is separated in a
predefined and a dynamic part:
o The predefined part determines the basic structure of the endpoint tree, e.g.
substance identity, physical chemical properties, environmental fate and
transport, ecotoxicological information, human health hazard.(ordinary endpoint
data is related to this predefined part)
o The dynamic part of the endpoint tree builds additional layers of the tree
depending on the data implemented in the databases. (ordinary metadata is
related to dynamic part)
Enpoint data is assigned to a predefined part of the endpoint tree, i.e. it is
assigned to a leaf of the endpoint tree:
Important: The endpoint tree path should point to a leaf of the predefined
endpoint tree. For more information check chapter 4 Endpoint tree path of this document.
The predefined part can be visualized by holding the Ctrl button and
Endpoint data information
The QSAR Toolbox oparates with the following data structure:
Value*
Metadata(type String)
Title String value
Title 1 Value 1 : : Title N Value N Mean Qualifier(<, >, >=, etc.) Mean Value (floating point number) Low Qualifier(<, >, >=, etc.)
Low Value (floating point number)
Upper Qualifier
Upper Value (floating point number)
Unit
*Value is defined as
Data point record
Endpoint (string)
Endpoint description(string) Duration (Value)
Is Private (Boolean) Is Observed (Boolean)
Metadata (type Value)
Title Value
Title 1 Value 1
: :
Title N Value N
Link to chemical ID(CAS, SMILES)
When the user defines data of a Categorical type (e.g. positive/negative) s/he should follow a scale definition:
1. The file for import should have a Scale column for the scale name. This
should contain a name of a scale exactly as defined in the scales list in the
QSAR Toolbox database for example “Gene mutation I” is a scale from the QSAR
Toolbox database scale list (red colored fields):
2. The Mean value/Scale value column should contain only values that scale
3. A new scale could be defined during the process of import:
When defining the data record the user should define:
I. For categorical data – Scale column for the scale name. This
should contain a name of a scale exactly as defined in the scales
list in the QSAR Toolbox database or as defined by the user. The
that scale members
II.For value data – At least one column for the Mean/Min/Max
values. Qualifiers and Unit are optional
Metadata information
These are fields for metadata such as Duration, Organ, Tissue, Route of administration etc., which are not mandatory for the import:
Metadata fields can be used for building the dynamic part of the endpoint tree. The feature is accessible through the “Set the hierarchy” option. The user sets what categories metadata he/she wants displayed on the endpoint tree and their hierarchy. Then, when the data are loaded the tree is build with the contents of the corresponding fields.
Metadata field Examples of metadata field values
Endpoint LC 50,EC10, EC 50, LOEL, NOEL, Skin sensitisation, Carcinogenicity, Ames, Chromosomal aberration,
Estrogen receptor binding….
Duration years, months, days, hours, minutes, seconds…
Test organisms (species)
Daphnia magna, Lepomis symnetricus, Oncorhynchus mykiss, Poecilia reticulata, Tetrahymena pyriformis….
Effect Immobilization, Mortality, Reproduction….
Effect type Maternal toxicity, Developmental toxicity, Fetotoxicity, Embryotoxicity
Metabolic activation with S9, without S9, no S9 info, with and without
Sexual maturation
(offspring) Male, Female, Male/Female…
Strain TA 98, TA 100, TA 104, New Zealand White, Swiss, Fischer 344/DuCrj
Test type
bacterial reverse mutation assay (e.g. Ames test), in vitro mammalian cell micronucleus test, bacterial gene mutation assay, acute, subacute, chronic, developmental, static, semi-static, flow-through
Type of genotoxicity Gene mutaion, Chromosomal aberration, DNA damage and/or repair, genome mutation
Type of method in vivo, in vitro, other
Organ Lung, Liver
Metadata field Examples of metadata field values
intraperitoneal
When defining the metadata record the user should organize his/her own metadata by using existing field labels. This ensures that the same fields do not multiply under different names. For example effects from the experiment should be placed in a column named “Effect”, the type of the test method such as “Ames test” should be placed in a column named “Test type” etc.
The metadata fields can be organized in “Set tree hierarchy” panel. Right click on endpoint tree to set the hierarchy.
Appendix II: Import example for a database with
ecotoxicological information
The example below uses a file that is already prepared. Guidance on how to prepare file for horizontal import can be found in Appendix I.
The destination for example files is [Install folder]\Examples
The default path is: C:\Program Files\QSAR Toolbox\QSAR Toolbox 2.1\Examples\Ecotoxicological example.xls
It is very important that the thousands and decimal separators are properly set while importing. Especially with TXT file this could lead to erroneous parsing of data values.
Important: The endpoint tree path should point to a leaf of the predefined
endpoint tree. For more information check chapter 4 Endpoint tree path in this document.
I. The type of the column is specified by clicking on the column and then clicking its type (CAS/Chemical name/SMILES) from the list box
in the Define new region panel or selecting a metadata field label
from the list box in the Metadata panel. To remove designations
click a column and then click on Undefined from the list box.
II. All fields fields defined with the Define new region panel are
Appendix III: Import example for database with Human
health hazards Information
The example below uses a file that is already prepared. Guidance on how to prepare file for horizontal import can be found in Appendix I.
The destination for example files is [Install folder]\Examples
The default path is: C:\Program Files\QSAR Toolbox\QSAR Toolbox 2.1\Examples\ Carcinogenicity&mutagenicity_example.xls
It is very important that the thousands and decimal separators are properly set while importing. Especially with TXT file this could lead to erroneous parsing of data values.
Important: The endpoint tree path should point to a leaf of the predefined
endpoint tree. For more information check chapter 4 Endpoint tree path in this document.
then clicking its type (CAS/Chemical name/SMILES) from the list box
in the Define new region panel or selecting a metadata field label
from the list box in the Metadata panel. To remove designations
click a column and then click on Undefined from the list box.
II. All fields fields defined with the Define new region panel are
Appendix IV: Import example for database with Human
health hazards Information
The example below uses a file that is already prepared. Guidance on how to prepare file for horizontal import can be found in Appendix I.
The destination for example files is [Install folder]\Examples. The default path is C:\Program Files\QSAR Toolbox\QSAR Toolbox 2.1\Examples\GENOTOXICITY_example.xls
It is very important that the thousands and decimal separators are properly set while importing. Especially with TXT file this could lead to erroneous parsing of data values.
Important: The endpoint tree path should point to a leaf of the predefined
endpoint tree. For more information check chapter 4 Endpoint tree path in this document.
then clicking its type (CAS/Chemical name/SMILES) from the list box
in the Define new region panel or selecting a metadata field label
from the list box in the Metadata panel. To remove designations
click a column and then click on Undefined from the list box.
II. All fields fields defined with the Define new region panel are
75775 Paris Cedex 16 France
Tel.: +33 1 45 24 82 00 Fax: +33 1 45 24 85 00