Policy, Planning, and R.esaroh
WORKING PAPERS
World Development Repo"t
Office of the Vice President
Development Economics
The World Bank
March 1989
WPS 164
Background Paper for the 1989 Wodd Development Report
Intersectoral
Financial Flows
in Developing
Countries
Patrick Honohan
and
Izak Atiyas
The business sector in developing countries relies on extemal
funding for about half of its investment. If the availability of
in-vestable funds is to be freed from its dependence on the vagaries
of the international capital markets, developing country
finan-cial systems will have to attract more household savings with
new types of instruments and adequate returns.
Public Disclosure Authorized
Public Disclosure Authorized
Public Disclosure Authorized
Plc,Planning, and Research
World Development Report
A review of flow of funds data for 17 develop- channeled from the household to the business ing countries reveals that most years in most sector much more by means of bank deposits
countries: and loans than through issue of equities.
- The household sector is a net lender, The foreign sectr.r cannot be relied upon as a lending on average 7 percent of GNP - and passive or residual provider of funds to the do-more in countries that are do-more open and have mestic economy. A shortfall in foreign financ-higher income. The household sector typically ing or an increase in govermment borrowing saves more than twice what it needs to finance typically force the business sector to reduce its its accumulation of real assets, lending the rest investment. Households and the government to other sectors. typically do little to absorb foreign financing
shocks by adjusting their net lending. * The business sector is a net borrower,
bonrowing on average 7 percent of GNP. About The vulnerability of the business sector to half of real capital formation by business is the availability of foreign funds points up the extemally financed. need for the financial sector in developing
countries to find more ways to attract domestic * The government sector is sometimes a net savings to finance worthwhile investment lender but more often a net borrower. projects. This will require that savers are
ensured a fair share of the retums on investment Intersectoral flows in developing countries projects - which means realistic interest rates are achieved mostly through the banking system. for savers and the development of financial The rest of the financial system is typically instruments that allow savers to share in high-relatively underdeveloped. Thus savings are risk high-yield projects.
This is a background paper for the 1989 World Development Report. Copies are available free from the World Bank, 1818 H Street NW, Washington DC 20433. Please contact Wilai Pitayatonakarn, room N9-005, extension 60353.
'Pe PPR Working Paper Series disseminates the fidings of work under way in the Bar's Policy. Plarming, and Research Complex. An objective of the series is to get these findings out quickly, even if presentations are less than fully polished.
Table of Contents
1 INTRODUCTION ... 1
2 FLOW OF FUNDS DATA . ... 4
2.1 The elements of the flow of funds. ... ... 4
2.2 Financial assets ... 9
2.3 Data pitfalls ...-.-.---12
3 ANALYTICAL ISSUES .15 3.1 Sectors and instruments ....--- ...- 15
3.2 Intersectoral flows: theoretical framework ...6
3.2.1 Interactions between the savings behavior of the domestic sectors ... 16
3.2.2 The fluidity of international flows ... 7
3.3 Instruments: sharing of risks .. 18
3.3.1 Types of sharing ... 19
3.3.2 Ability of instruments to shs.re ... 21
4 FINANCIAL ASSETS AND FLOWS IN DEVELOPING COUNTRIES ... 31
4.1 Main features of the data ... ...31
4.2 Exogenous determinants ... ... 35
4.3 Pulling and pushing sectors ... ... 39
4.4 Cyclical factors in individual countries ... 44
4.5 The message from the principal components ... 48
5 INSTRUMENTS IN DEVELOPING COUNTRY FLOWS ... 51.
6 SUMMARY AND CONCLUDING REMARKS ... 56
INTERSECTORAL FINANCIAL FLOWS IN DEVELOPING COUNTRIES
1 INTRODUCTION
This paper is about financial flows in developing countries. It reviews the
evidence on who are the borrowers, who the lenders. It asks questions such
as: to what extent is the financing of business investment dependent on the
availability of foreign funds? Does the degree to which households
accumulate financial assets vary according to the state of development of the economy or according to availability of foreign sources of finance? What
kinds of assetr characterize financial intermediation?
Quantitative information exists on these matter&, for many developing countries, though the coverage is uneven, and much remains unknown. The present exercise is an attempt to draw on information from some of the best
documented countries.
Apart from collecting and summarising available data from some seventeen
countries the paper presents the results of an econometric analysis of the
interactions between the net lending behavior of the different sectors. The
main conclusions of this analysis are as follows:
- The business sector, though it finances a substantial proportion of its own investment needs from savings, also relies heavily on external
finarncing. This reliance varies widely, but a typical figure would be 50
per cent of investment. The household sector is a net supplier of funds.
- Intersectoral financial flows in developing countries are achieved to a notable extent through the banking system. The remainder of the
financial system is typically relatively underdeveloped. To the extent
000 94
sufficient efficiency to ensure that worthwhile investment projects are financed out of domestic savings, the economy must look to foreign
sources of financing.
- In a world of perfectly functioning international capital markets such
sources would be readily forthcoming. But our analysis suggests that the
foreign sector does not smoothly provide needed financing. A more realistic description would be to say that foreign sector financing is determined by factors other than domestic net financing needs.
Furthermore, a shortfall in foreign finance, or an increase in government
borrowing, typically forces the business sector to reduce its investment.
On average, households and the government do little to absorb external
financing shocks by adjusting their net lending.
= The vulnerability of the business sector to the availability of
external funds points to the need for improvements in the effectiveness
with which the financial sector in developing countries can attract
domestic savings in order to finance worthwhile investment projects. This will require that savers are assured of a fair share of the returns
to investment projects. This in turn requires realistic interest rates
for savers as well as the developmenat of instruments which can allow
savers to share in high-risk high-yield projects.
The paper is organized as follows. Section 2 clarifies some terms and in
particular explains what a complete set of flow of funds accounts looks like.
Some of the serious data pitfalls which exist are noted.
Section 3 provides an analytical framework for the consideration of flow of
funds data. (The reader who is mainly interested in the quantitative
findings may proceed directly to Section 4.) Some theoretical propositions concerning the interaction between the savings and surpluses of different
sectors in an idealized economy are reviewed (in Section 3.2). The obstacles to an efficient intersectoral flow of funds may be traced to shortcomings in
the development of certain financial markets and instruments. Some of these
shortcomings, such as those resulting from interest rate controls, have been widely discussed. Others, familiar from the modern theory of finance, have not been so much discussed in the developing country context though they will become increasingly relevant as developing country financial systems become
more sophisticated. It is these points which are discussed in Section 3.3.
Section 4 reports the main data on sectoral surpluses and deficits and summarizes the empirical findings on their mutual interaction and on their
determinants.
Section 5 describes the typical pattern in developing countries of financial
flows by instrument.
2 FLOW OF FUNDS DATA
2.1 The elements of the flow of funds.
The 1968 United Nations System of National Accounts (SNA)1 provides a
statistical framework for presenting flow of funds accounts. The two main
accounts of the SNA that are relevant for our purpose are together referred
to as flow of funds accounts. The caRital accumulation account shows, for
each sector, the saving of that sector including provision for capital consumption (or depreciation), any capital transfers to the sector,
together with the non-financial assets accumulated by the sector, whether through capital formation, land acquisition and purchase of intangible assets. A balancing item of this account is net lending, the breakdown of which is the subject of the other account, namely the caoital finance account..
For only a handful of developing countries are data for these two accounts
collected. Even where data exist, they are generally incomplete in certain
respects. An exception is Korea, which has detailed statistics presented,
generally speaking, in the SNA format and going back a number of years.
Tables 1, 2 and 3 display the Korean flow of funds data for 1984, together
with the corresponding stocks. A review of this data set will serve to
illustrate many of the characteristics of the flow of funds found in
diverse countries, as well as allowing us to fix some conceptual ideas.
Table 1, the capital accumulation account, represents the transition between the national income accounts concepts of savings and capital
formation, and the financial accounts concept of net surplus or :.et
1 United Nations, 1968, A Svstem of National Accounts, (Department of Economic and Social Affairs-, Statistical Office of the United Nations, New York), Studies in Methods, Series F, No. 2. A revised methodology for the SNA is in preparation.
TABLE 1: XOREA, CAPITAL ACCUMULATION ACCOUNT. 1984
Billions of won Households Business Government Financial Institutions Accun. Finance Accun. Finance AcctIn. Finance Accux. Finance Saving (net) 7237.0 1800.0 4539.0 474.4 Consumption of fixed capital 896.4 4890.4 143.7 139.7 Capital transfers (net) 122.5 143.3 -390.2 124.4 Gross fixed capital formation 4562.9 12657.8 3179.8 394.5
Increase in stocks 139.0 243.3
Purchases of land* -1010.6 872.9 -16.2 153.9 Purchases of intangible assets* -- '.8 60 . 0.3 21.1 Net Lending 4646.4 -703j.7 1128.6 169.0 Source: Bank of Korea, Financial Statements Analysis, 1985.
TABLE 2: KOREA, CAPITAL FINANCE ACCOUNT. 1984
Bitlions of won Households Business Governmwent Financial Institutions Assets Liabs Assets Liabs Assets Liabs Assets Liabs Net Lending 4285.7 -7533.1 1147.5 272.7
Gold 0.2
Currency and transferable deposits 42.8 -14.7 461.9 675.6 1165.7 Other deposits 2895.6 2591.7 486.7 885.3 6859.4 Life insurance reserves** 1804.8 1804.8 Short-term securities 162.5 -410.8 90.4 9.3 1427.9 1098.5 Long-term securities 839.7 % 463.3 1440.6 66.1 -116.5 901.8 946.8 Stocks 887.4 584.1 1575.6 19.2 340.0 255.0 Loans by financial institutions 3133.5 7171.0 104.2 12413.3 2004.5 Goverrmlent loans 17.4 -8.7 313.5 304.8 Equities other than stocks 730.8 10.7 872.0 210.4 -0.2 79.6 Trade credit 1327.6 2648.1 1320.4
Foreign exchange holdings 596.2
Foreign claims and debts 1400.8 -171.2 -607.4 505.9 82.5 2436.4
miscellaneous 471.3 1851.7 139.5 65.5 785.5 879.8
Source: Bank of Korea, Financial Statements Analysis, 1985. *(net)
**(and pension funds); Net equity of households.
lending2. In broad terms, the excess of each sector's gross savings (inclusive of capital consumption provisions) over its gross capital formation (inclusive of stock accumulation), will approximate its
accumulation of financial claims on other sectors - shown as net lending. Adjustments must however be made for capital tranqfers, and for purchases
and sales of land and intangible assets.
An example of capital transfers would be a government grant for the purpose
of capital accumulation. Net capital transfers to a sector allow it to
augment the resources provided by savings to increase the sector's acquisition of real or financial assets. However, this item tends to be relatively small3.
Purchases and sales of land do not enter into the current income and outlay
account. But land is not capital either. A particular sector may,
however, use some of its savings to acquire land instead of capital or financial assets. Conversely, the sale of land by a sector augments the funds available to it for the purchase of capital or of financial assets.
Of course appreciation in the capital value of a given piece of land is
invisible to these accounts which are flow accounts4.
"Intangible assets" refers to such things as patent rights which are neither capital nor financial assets.
2 The term "net lending' will be used interchangeably with the term "(net)
financial surplus".
3 Host, though not all, transfers from abroad tend to be current rather than
capital in nature.
4 Over time the more valuable land may yield a higher rental income; this
The Korean statistics display several features which are typical of many
other countries. First, the individuals or h2ushold sector is the
largest domestic saving sector, in this case with gross saving totalling
8133 billion won6, or over 12% of GNP. To this is added 122 of capital
transfers (evidently from the government) giving 8256 to be allocated to
the acquisition of assets. In this particular year the household sector
sold land and intangible assets in the net amount of 1092, which further
augmented to 9348 the funds available for this sector's investment in capital and financial assets. The household sector's accumulation of real
capital, at 4702, is well below this, leaving a financial surplus (of 4646,
or 7% of GNP) to be lent to other sectors.
The pattern for the corporations or business sector (which here includes
both public-owned and private enterprises) is the opposite to that of the individual sector. While its capit&l consumption provisions are sufficient to cover almost two-fifths of gross capital formation, remaining savings fall well short of covering the business sector's remaining needs for investment, and the sector has a net accumulation of indebtedness of 7031, or 10.6% of GNP.
As will become evident, the net position of the government sector varies
widely: in Korea in 1984 the general government ran a surplus, not only on
current account (positive net savings) but overall, with capital formation falling short of savings allowing net accumulation of financial assets in
the amount of 1129 or 1.7% of GNP.
5 The practice is to include unincorporated business with the household sector, while corporate and quasi-corporate enterprises are included in the business sector. It is not always possible, however to adhere strictly to these categories.
The savings and capital formation of the financial sector is comparativoly small: its role is as an intermediary and it therefore plays a bigger part
in Table 2. The foreiln sector is a residual: its net lending will equal
the sum of that of remaining sectors. Naturally, the gross saving and
capital formation of the rest of the world is not recorded in the national
statistics of any one country; only the rest of the world's dealings with
the country in question are included.
Table 2, the capital finance account, shows the financial assets and
liabilities which were accumulated in the year by each sector. In
principle these should sum to the net lending total for the sector shown in
Table 1, but in practice there is a discrepancy resulting from the
deficiencies of the different sources of data on which the two tables are
based. While Table 1 is drawn primarily from information in the income
outlay accounts, Table 2 is typically based on balance sheets and asset market transactions.
Consulting the columns for the household sector, the accumulation of financial assets corresponding to the net lending position of this sector
is evident from the assets column. The sector acquired bank deposits alone
in an amount equivalent to 4.5% of GNP. Its accumulation of claims on the
funds of life assurance companies and pension schemes was only somewhat smaller, and there was considerable acquisition of long term securities and
stocks, and other equity claims. But what is noteworthy is that the net
surplus of the sector conceals considerable heterogeneity of behavior. Thus the household sector also borrowed appreciable sums from financial
institutions as can be seen from the liabilities column. There was also an
accumulation of indebtedness in trade credit. It is thus important to bear
in mind that even a single entity may at the same time accumulate financial
household sector does not issue securities or equity; but the corporate sector does, and there are correspondingly fewer blanks in the columns relating to the corporate sector.
Once again it emerges that the business sector both borrows from and lends
to (places diposits with) the financial sector. But the story is even more
complex than with the household sector, as the entities in the business sector acquire claims on other eatities in the business sector. For
instance about one-half of trade credit is issued within the business sector.
The relevance of the financial sector becomes evident in this Table 2, as
it has entries on both sides of almost all the rows: only those rows which
relate by definition to claims of or on other sectors or to gold have
blanks under the financial sector. The gross acquisition of financial
claims by the financial sector is equivalent to over 27% of GNP - some 66
times its net lending, and this pattern is not untypical.
2.2 Financial assets
Continuing our perusal of the Korean data, we turn to Table 3 showing
stocks of financial assets and liabilities. The total value of outstanding
financial assets recorded comes to 264,500 billion won of which 38,100 are
held by the rest of the world. The total if financial assets held by
residents is thus 226,400 or over 325% of GNP. But this figure involves an element of double-counting including, as it does, both bank deposits and
TABLE 3: KOREA: FINANCIAL ASSETS AND LIABILITIES BY SECTOR end-1984
Trillions of won Total Household Business Government Financial Rest of World Assets Liabs Assets Liabs Assets Liabs Assets Liabs Assets Liabs
Gold 0.0 0.0 0.0
Currency and transferable deposits 10.2 3.2 2.8 1.5 2.6 10.2
Other deposits 32.9 20.8 8.1 1.4 2.5 32.9
Life insurance and pension furds 7.3 7.3 ,.3
Short-term securities 8.7 1.8 1.8 4.2 0.0 5.0 4.5
Long-term securities 16.9 4.9 1.3 7.9 0.4 0.3 10.3 8.7
Stocks 12.5 7.3 2.8 10.3 0.4 2.0 2.1 Loans by financial institutions 70.6 18.0 39.4 3.6 70.6 9.5 Govermuent loans 6.3 0.5 3.3 6.3 2.5 Equities other than stocks 10.6 3.4 1.8 8.7 4.7 0.7 1.9 Trade credit 18.2 3.4 18.2 14.8
Foreign exchange holdings 6.3 6.3 6.3
Foreign claims and debts 41.8 2.4 11.4 7.2 1.3 19.5 38.1 3.7 Miscellaneous 22.4 3.7 11.3 14.4 1.6 1.2 5.9 6.9
Net financial position 30.6 -63.8 3.9 1.3 28.0
Total 264.5 52.5 21.9 50.7 114.4 16.2 12.3 107.1 105.8 38.1 10.0 0
Percentage of GNP CGNP= 69.4):
Gold 0.0 0.0 0.0
Currency and transferable deposits 14.6 4.7 4.1 2.1 3.8 14.6 Other deposits 47.4 30.0 11.7 2.0 3.6 47.4
Life insurance and pension funds 10.5 10.5 10.5 Short-term securities 12.5 2.6 2.7 6.1 0.0 7.2 6.4 Long-term securities 24.4 7.1 1.9 11.4 0.6 0.5 14.8 12.6
Stocks 18.0 10.5 4.1 14.9 0.5 2.9 3.1
Loans by financial institutions 101.8 26.0 56.8 5.2 101.8 13.7
Govern ent loans 9.0 0.7 4.8 9.0 3.6
Equities other than stocks 15.3 5.0 2.6 12.5 6.8 0.9 2.8 Trade credit 26.2 4.9 26.2 21.3
Foreign exchange holdings 9.1 9.1 9.1
Foreign claims and debts 60.2 3.5 16.5 10.3 1.8 28.1 54.9 5.3
preferable to net out such multi-layered claims 7 . Netting out the domestic assets of financial intermediaries, we arrive at a smaller figure of
146,400 or about 210% of GNP.
The assets figures, unusually detailed in Korea, allow us to observe the detailed pattern of intersectoral claims and liabilities at a moment in
time.
The biggest single liability for the business sector is loans from financial institutions, accounting for over one-third of that sector's gross financial liabilities. Securities, short and long term, account for
only about 13% of gross liabilities, with stocks and other equities
estimated at 16.6%. The business sector also holds financial assets,
totalling almost 45% of the value of its financial liabilities. To some
extent this reflects a borrowing and lending between different enterprises
- as with trade credit, which represents over one third of the business
sector's financial assets. To some extent it reflects simultaneous
holdings of financial assets and liabilities by individual enterprises, as when an enterprise issues equities or securities, but also holds liquid
7 Nevertheless it may be useful for some purposes to include both sides of
the balance sheet, and thus to use the larger figure. This point may be
worch elaborating. Consider a very simple economy with just three agents, a
mining company, a wealthy family and a conglomerate. The mining company has
issued 200 worth of debentures, one half of which are held by each of the
other two. In addition the conglomerate is partly owned by the family, whose shareholding is worth 95. The total value of financial assets in this
economy will generally be accepted as 295. Now consider another economy,
differing only in that instead of a conglomerate there is a bank, and instead
of the shareholding there is a deposit of 95. Some might be inclined to
treat the bank as a transparent intermediary, and count only 195 of financial
assets. But after all the economy is financially more complex than one in
which the family simply lent 195 directly to the mining company. The gross
figure of 295 has as much claim to being a measure of the value of total
financial assets as the lower figure. In fact, it becomes clear from this
discussion, that any measure of total value of financial assets is a very
imperfect summary of the size of the financial system. Financial
intermediaries do more than channel funds from one agent to another, on the
way they transform the characteristics of the assets involved. The asset
obtained by the depositor is very different to that which he would have obtained by lending directly to the bank's borrower.
assets such as bank deposits. More than one-fifth of business sector
financial assets are in the form of money and time deposits. This
highlights the important asset transfor.ation function of the financial sector.
For the household sector over four-fifths of indebtedness is to financial
institutions, while almost one-half of financial claims are on financial
institutions. Overall, household financial assets are almost two and a
half times household financial liabilities. Nevertheless these liabilities
themselves are not negligible, being equivalent to almost one-third of GN!P.
The financial institutions are primarily intermediaries, their net financial position coming to little over one per cent of their gross financial assets. Of the identified financial assets held by domestic non-financial sectors, almost two-fhirds are intermediated through the
financial institutions.
The principal domestic financial claims of the government sector arise from loans made to the business and corporate sector, its principal domestic
borrowings are from financial institutions.
There is a broad correspondence between the instrument structure of the
asset holdings (Table 3) and that of the flow figures (Table 2), though
this need not always be the case. The remainder of the paper is concerned
only with flow iigures.
2.3 Data pitfalls
Various practical difficulties mean that the reliability of flow of funds
statistics lags behind that of the national income and expenditure
accounts. Furthermore, though the methodology for preparing flow of funds
not rigorously followed by all researchers. These considerations imply that one must, especially when comparing data from different sources, be aware that there may be rather wide divergences between the data presented
and the concepts they purport to measure. It is our impression that data
problems are more serious in flow of funds data than in most other
macroeconomic data sets, but we believe that it is worthwhile to examine
the existing data.
One of the most common conceptual problems relates to capital value
changes. Many elements in the flow of funds are derived from comparison of
successive balance sheets of financial institutions. To the extent that
the differences between these balance sheets reflect not only flows in and
out of the institution, but also capital value changes, the year-to-year
changes should not be entered as net flows without adjustment for the
capital value changes. In principle, the valuation changes should be shown separately in a reconciliation account. However, it is not clear that such corrections have been made systematically in the data sources which we have used.
The second major problem - actually a variant of the first - relates to the
problem of inflation. Even where inflation is fully anticipated, contracts
denominated in mcney terms involve a transfer of real resources betweer. the
parties over time that is concealed by money accounting. Some authors have
recommended that analysis of sectoral savings and financial surpluses
should be carried out in inflation adjusted terms. When this is done, the
patterns can change dramatically8. For example, the savings of the
8 Cf. Kennedy, N.O., "Inflation-adjusted sectoral saving and financial balances", Bank _o England Ouartrlv Bulletin, May 1988.
household sector, as a net holder of money-denominated assets, tends to be
lower in inflation-adjusted data. The data analyzed in this paper are
based on money and not on inflation-adjusted accounting.
A third major difficulty derives from the existence of discrepancies
between the sectoral income and outlay accounts and the financial data
sources on which the flow of funds tables are based. These discrepancies
have already been noted in the case of Korea, but they exist in all
countries, and are often very large, by comparison with the sector
surpluses. The treatment of these discrepancies can strongly influence the data.
The fourth problem, which is pervasive, is comprehensiveness. For the most
part, the balance sheets of financial institutions and the records of organized securities markets provide the basis for much of the capital
finance accounts of the flow of funds. The equity injections by owners of
closely-held or quasi-corporate enterprises may often fail to be captured
in the accounts, as may much of trade credit. Intra-sectoral claims are frequently netted out or omitted, and omissions are not evident because
they do not violate adding-up constraints.
In the present paper, no attempt has been made to refine the flow of funds
estimates prepared by other authors. Reliance is thus being implicitly
placed on ar. assumption that the discrepancies and errors in the data are
sufficiently random and non-systematic to allow the true systematic
3 ANALYTICAL ISSUES
3.1 Sectors and instruments
As illustrated by the elements of the flow of funds tables, there are two principal ways of approaching the analysis of financial flows and their
determinants. The first takes the economic sectors as the main focus, the
second looks at the different financial instruments. Each approach has its
merits from the point of view of achieving an understanding of how the
financial system works
On ths one hand, an important function of the financial system is to channel resources from surplus to deficit units in the economy in an efficient manner. The sectoral approach addresses this issue9. Some theoretical propositions concerning intersectoral flows are discussed in Section 3.2 below. The statistical analysis provided in section 4 is motivated by the self-evident proposition that the business sector is
likely to have more worthwhile investment opportunities at the margin than
the household sector, and that a function of the financial system is to
ensure that investable funds flow smoothly to take advantage of these
opportunities.
On the other hand, the financial system is preeminently a network of assets and corresponding liabilities; the financial instruments approach
emphasizes this aspect. Section 3.3 below elaborates the function
performed by different financial instruments in enabling different agents (or sectors) to pool risk or diverse timepaths of net receipts. Section 5 provides a brief factual report on the use of different financial
instruments in developing countries.
9 Though the data distinguishes sectors on the basis of their ownership
structure, and not on whether they are borrowing or lending sectors. Indeed
3.2 Intersectoral flows: theoretical framework
3.2.1 Interactions between the savings behavior of the domestic sectors
It is not, of course, the case that the various economic sectors
identified in a flow of funds analysis are hermetically sealed from one
another and interact economically only through their borrowing and lending activities. Indeed, private enterprises are owned by households, and the borrowings of government have ultimately to be serviced by recourse to taxation which may be thought of as falling on
households too. So it is often thought that households are the ultimate
focus of economic decision-making. According to this view, private
firms act under the general direction of their shareholders and the actions of government are also noted and taken account of in the
economic decisions of households. This line of reasoning underlies the
much discussed 'neo-Ricardian" theory of debt and taxation, and the .Adely used value maximization approach to enterprise financial
decision-making.
If these stories were taken to the limit, the relations between the savings behavior of households and those of the other sectors would be exactly offsetting. Enterprise and government savings would simply be
household savings at one remove. An increase in enterprise savings
which does not result form a change in household preferences or
opportunities would be fully offset by a reduction in the savings
undertaken by the household. The same goes for government savings. If
this were wholly true, then the analysis of flows of funds between
sectors would be of secondary importance. It would not contribute to an
Whatever about the validity of the neo-Ricardian approach and value
maximization theory in industrial countries (and they are much debated),
it seems clear that the serious imperfections of capital markets make the idealised models of integrated saving behavior quite unrealistic for
developing countries.
3.2.2 The fluidity of international flows
A simplistic model of international capital movements has resources flowing from countries which would otherwise have a relatively low marginal efficiency of capital to those which would otherwise have a relatively high marginal efficiency of capital. The flows would be sufficient to equalize the marginal efficiency of capital in all
countries. A shift in savings behavior in one small country would not,
according to this extreme view, result in any reduction in the
investment funds available: the reduction in local savings would be made up by the inflow of capital in search of what would tend to become a higher marginal return on a smaller capital base.
The empirical evidence on the fluidity of international capital flows is
somewhat ambiguous. For industrial countries Feldstein and Horioka
(1980) observed a high correlation across countries in national savings
and investment rates. This correlation would not be anticipated if the
international capital flows always move to equate the marginal return on
capital in all countries. This finding has generated considerable
controversy, notably over how it should be interpreted1 0 . A recent extension of the study included a sample of 50 developing countries"1.
10 Cf. Obstfeld, M. "Capital Mobility in the World Economy", Carnegie Rochester Series on Public Policy, Vol. 24, 1986.
11 Dooley, M.P., J. Frankel and D. Mathieson: "International Capital Mobility", IMF Staff Papers, Vol. 34, September 1987, pp. 503-30.
This analysis found that the correlation between savings and investment was generally weaker for the developing countries; in fact there is a clear link only since 1974 and only for those developing countries not primarily reliant on official development assistance. For these
countries, however, the link remains. The countries included in the
data sample discussed in this paper all fall into this category.
The question of whether or not the foreign sector is an efficient
residual supplier of funds is a central one. As is argued later,
domestic financial markets may not be very efficient at channeling the savings of the household sector to the enterprise sector. In
particular, they may be less able to absorb or cope with risk than is
the financial system in some industrial countries. From a welfare point
of view, this may not matter very much if the foreign sector can
efficiently close any financing gap for the business sector that
results. However if, as we will argue appears to be the case, the
foreign sector's provision of funds is based on exogenous factors and
not on the needs of the domestic business sector, then the potential
distortions are considerable12.
Foreign intermediation can play an important role in achieving
investment efficiency. But when foreign flows do not flow smoothly in
response to yield differentials there is a need for policies to improve
the efficiency of domestic intermediation.
3.3 Instruments: sharing of risks
Even an economy in which each agent had no net acquisition of financial
assets could involve a network of financial intermediation serving to pool
12 The sources of this inefficiency are discussed in the Annex, which also
risks and provide a smoother consumption pattern for all. This consumption smoothing or risk-sharing feature of the financial system tends to be
neglected if there is too much emphasis on intersectoral net flows.
Financial instruments are essentially contracts which rearrange the
distribution of claims on economic resources in different time periods and
4n different contingencies. Perfect financial markets allow the full
resources of the economy to be allocated in an optimal manner. Financial
market imperfections will result not only in a misallocation in each period
of the resources that are available, but, through its effects on investment
decisions, will tend to reduce the total amount of resources available over time.
A distinction can be drawn between the traditional loan contract, which
promises a fixed payment except in the case of insolvency, and financial
assets whose terms are tailore to the specific risk characteristics being
faced by either borrowers or lenders. The archetypical tailored instrument is the equity, whose value is linked to the value of the enterprise'3.
Another example of a tailored instrument is the insurance policy. The financial systems of developing countries emphasize non-tailored
instruments such as bank deposits. As will be discussed below, this limits
the degree to which rearrangement of claims can take place.
3.3.1 Types of sharing
Intertemnoral. A slightly artificial distinction can be made between
the use of financial instruments to effect an intertemporal sharing of resources and their use to pool or share risk. Intertemporal sharing is the simplest kind.
13 The equity is an extremely flexible instrument for rearranging the claims on economic resources. By defining the enterprise suitably, the equity can
Even without considering risk, financial instruments can allow economic
agents to pool the resources available to them so that each agent can
smooth her consumption over time. In this way financial instruments can not only improve the welfare of all by achieving a better allocation of a given amount of resources, but by influencing investment decisions, they can result in a more resources being produced.14
In terms of inter-sectoral flows, this story is clearly crucial for borrowing by enterprises for projects which have long gestation periods. It is also an important element in household firnancial savings'5, which release the resources for investment by enterprises in projects that
will yield a return which is higher than both the marginal rate of time
preference and the potential yield on household investments such as housing. It is likewise important for the borrowing by government to the extent that this is underlain by high-yielding public expenditure on infrastructure, both physical and social. A driving force behind
foreign sector lending to developing countries may also be a higher marginal efficiency of capital in developing countries16
Risk. But the risk sharing function is also important, both for the
sellers and the purchasers of financial instruments. The risk of
failure of an investment project will make the small entrepreneur
reluctant to undertake it unless he can reduce his exposure to the the
risk by selling participations in the project. If his total wealth is
14 The argument is familiar, and illustrated in figure A2 in the Annex.
15 Life-cycle models of consumption predict a build-up of individual
household wealth beforp retirement or old-age; much of this wealth will take the form of housing and other durables without the benefit of financial intermediation, especially in developing countries.
16 On the other hand for public borrowing, and as a result also for foreign
borrowing, it may be the private rate of return on the expenditure to those
in power for the time being, rather than a higher social rate of return which
large, the entrepreneur can also reduce his vulnerability to failure by purchasing participations in other schemes whose success is likely to be
negatively correlated with his own.
But it is arguably the household that is most influenced by
considerations of risk in deciding to acquire financial assets and in the choice it makes between the different financial assets that are
available. Unlike the enterprise, which may often be able to foresee
the time-path of its financing needs over the years ahead and will make
financing decisions accordingly, the typical household plans on a relatively smooth income and consumption pattern over time, but is buffeted by unexpected shocks. Households need a stock of wealth to achieve the optimum consumption pattern in the face of unfavorable shocks17; the stock can be built up on a planned basis, as well as being
augmented by favorable shocks. To be useful, this wealth needs to be
liquid or tailored to the possible shocks. These are characteristics
offered more by financial assets than by most non-financial assets.
Considerations of risk-pooling also influence the willingness of the
rest of the world to make loans to a particular developing country. But
this consideration is symmetrical, and therefore may have little impact
on net financial savings of the foreign sector.
3.3.2 Ability of instruments to share
Households and enterprises in developing countri*s interact on the
financial markets by using a variety of instrumen: and institutions.
The government and the foreign sector also participate. But not all
instruments are equally well developed in these countries. Banking
17 Which could take the form of special consumption opportunities (such as the relaxation of a ration) as well as unexpected income shortfalls.
forms the bulk of the financial system in most developing countries. It must substitute for well-functioning1 8 equity and bond markets in
achieving a sharing between the sectors (and between individual
households and enterprises) of risk and of the timepazh of resource
flows.
The banking system is limited in the degree to which it can perform this
function. To take just one aspect, it provides to depositors as assets
mainly or solely deposits which are denominated in money terms19. These
do not, for example, protect against unexpected inflation. Furthermore,
bank deposits do not enable saving households who do not own the
borrowing enterprises to benefit from increases in the value of the
assets of those enterprises. Many households would be willing to accept
some increased risk in order to obtain such an opportunity. The limited
menu necessarily offered by banks results in lower economic welfare than
if a full range of well-functioning financial markets existed. This is only one illustration of the unfulfilled potential of a bank
dominated system. In order to provide a context for assessing the
statistical findings of Section 5 below on the use of financial
instruments in developing country flows, the following paragraphs Drovide an account of the particular characteristics of different
inancial institutions and instruments for sharing resources.
18 The relative importance of the role of equities does not depend only on their relative share of total financing, but on the degree to which their use
is widespread among enterprises, and also on the efficiency with which the
equity markets function.
19 Except in countries where, because of chronic inflation, indexed deposits have become widespread.
£gouit. From an economic point of view20, equity is the archetypical
tailored financial instrument. This is because it defines any project,
enterprise or asset, and transferi claims to the returns on that asset. Most other financial assets can be regarded2l as special cases of the
equity contract. Any particular enterprise or prospect can be packaged
in such a way as to di-ride the resources generated by the prospect
between agents in any desired manner through the use of an equity
contract. No other financial instrument is as versatile: a fixed
interest security, for example, cannot allow the holder to share in exceptionally favorable outcomes22.
In order to be attractive to saving households in terms of risk and liquidity, equities may need to be packaged, either by a financial
institution, or, if a well-developed equity market exists, by the formation of a portfolio by the household itself.
The major drawback of equities is the problem of control over the
management of the prospect or enterprise. Having obtaine't ;he resources
to finance the project through the sale of shares, the entrepreneur may be in a position to divert some of the proceeds of the enterprise to himself, for example by overcharging for services that he himself
provides to the enterprise, directly, or indirectly. While some control
can be achieved through devices such as the appointment by the outside shareholders of directors, and independent audits of the enterprise's
activities, this supervision is costly and likely to be only partially
20 As opposed, for example, to a legal perspective. Much of the following
discussion is not at all applicable to the legal forms of the various financial contracts discussed.
21 From the economic point of view; see the previous footnote.
22 The so-called "junk-bond" with its high coupon and high risk of default is
effective in many circumstances. This is probably the most important type of imperfection in the capital markets and it has severely limited the growth of equity markets in developing countries23.
Financial asset markets. If well-functioning financial asset markets
(such as equity markets) exist, then all of the risk that is specific to a given prospect can be diversified away, if that is desired, by the
construction of well-mixed portfolios. Thus the expected rate of return
an entrepreneur will need to offer to the potential purchaser of a share
may be much lower, in the presence of well-functioning equity market, than would be indica"ied by the specific riskiness of the project. The pubiic sale of marketable shares thus offers external benefits to other potential share-issuers, by enhancing the comprehensiveness of the
market and reducing the degree to which any given prospect carries
specific, non-diversifiable risk.
This risk-pooling function of asset markets also applies to the risks
facing agents other than the issuers of securities. For example a
household which owns a tradable asset can realize its value quickly in a well-functioning market, thereby using the market to insure against the risk of a sudden shortfall in income or a sudden consumption need.
Few developing countries have well-functioning financial asset markets in this sense, but the trend is clearly towards their emergence.
Securitte. Securities, or bonds, differ from equities in that they
promise a fixed return, not normally dependent on the success of the
23 It also appears that entrepreneurs have been reluctant to share ownership rights with outside shareholders, and this has restricted the supply of
project or enterprise24. In the event of non-fulfilment of this
promise, a penalty, such as the transfer of ownership of the enterprise
itself, or some collateral asset, is suffered by the obligator. The
bond contract escapes the problem of control by removing the dependence
of the promised payment on the performance of the enterprise. At the
same time, however, and by the same token, the contract does a much less efficient job in transferring the claim on the underlying asset25. If there existed only bonds, there would be comparatively little the entrepreneur with a risky venture could do to achieve a smooth
consumption stream. That is not to say that bonds are always riskless
instruments, with all of the risk of the project remaining with the
issuer. Far form it: the probability of default may be very high. But
the risk transfer which can be effected by the bond contract is very restricted, and cannot really be tailored Lo the risk-pattern of each
project or enterprise.
Bonds transfer purchasing power between different time periods. A single traditional bond does this in a fairly rigid way: a transfer of purchasing power now is balanced by a regular stream of interest payments followed by a larger capital repayment26. A combination of
24 Of course there is a great variety of financial instruments intermediate
between the pure bond which is described here and the traditional equity
share. So far, however, the growth of such intermediate type instruments has not been conspicuously faster in developing countries than that of
traditional equities.
25 For example, the bond-holder does not benefit if the project is
outstandingly successful.
26 In inflationary times the real value of the interest payments declines as time goes on, and the effective average duration of the purchasing power
transter is much lower. The real value of a bond with original maturity of,
say, twenty years, will be a fraction of its original value only a few years after issue in inflationary times: despite the long initial maturity, the
several bonds, or more complex bond-type transactions, can allow two partias to tailor the sharing of a stream of payments to their mutual satisfaction.
InsurancA contracts. While the holding of liquid financial assets can provide insurance against the uncertainty of timing of income and of consumption needs, it is not practicable or efficient for a household to
hold financial assets in such an amount as to provide coverage against
rare and very large shocks. Early death or incapacitation of the head of household, or accidental destruction by fire of the home could be examples. Similar reasoning applies to enterprises, for example with
regard to fire, damage of goods in transit, and liability for accidents
to workers and others.
This is the motivation behind the establishment of insurance enterprises
which accept small premiums from many policyholders in return for
coverage against such risks. The pooling of a large number of
individually rare and large risks results in a steady stream of payments to policyholders commensurate with the inflow of premium income.
Insurance enterprises interact with other aspects of the financial
system in a variety of ways. First, the policies have many of the
characteristics of unconditional financial assets. They are a claim on
resources even though the claim can be exercised only in certain
contingencies. Indeed they are an example of what has been referred to
above as a tailored financial instrument. They serve as a cushion against unforeseen shocks and enable holders to retain a smooth
consumption path in the face of income shocks or to meet unusual
consumption needs. Second, the management of insurance enterprises typically involves them holding a more or less large portfolio of
of premium income and the issue of payments to policyholders means that.
an insurance enterprise will tend to build up a fund. The longer the
period over which insurance is provided for each premium payment, the
larger this fund will tend to be. Third, their expertise in
fund-management, and sometimes their ability to benefit from a favorable fiscal or regulatory environment, has induced insurance companies in some countries to offer "policies" which are essentially long-term
savings media, rather than being specifically tailored to an insurable
contingency.
Insurance enterprises facilitate the transfer of risks in two ways. First, they provide tailored contracts to the policyholders essentially eliminating diversifiable2 7 (and for the most part non-business) risks. Second, their large funds can be composed of a diversified portfolio of financial assets which, though individually risky, are stable in the aggregate. In the absence of a well-functioning assets market, the large funds of insurance companies may provide a substitute, allowing individual entrepreneurs to fund projects more easily. In many
countries, however, strict controls (designed to enhance the security of
policyholders) govern the investment policies of insurance enterprises,
and these limit the degree to which this risk diversification of assets
can be achieved.
Bank deposits and loans. Bank deposits form the bulk of financial
assets in developing countries. Like insurance enterprises, banks
perform a risk-transformation function on both sides of their balance sheet. On the deposit side, banks provide a liquid asset which serves
27 Some risks are too big for insurance enterprises to insure. On the global
level this could include climatic changes or global war. On a national level, floods or earthquakes could pose risks too large for enterprises to bear. International reinsurance of large risks serves to diversify such
to pool the individual stochastic needs for spending power. Only a. small fraction of the deposit claims on the bank needs to be kept in
liquid form, the remainder can be held in illiquid and higher yielding
forms of asset. If each depositor owned a fraction of the bank's asset
portfolio instead of having a deposit claim, he or she would not be
assured of ready access to spending power to meet an unexpected
consumption need. Especially in the absence of well-functioning asset markets, then, the bank performs an important liquidity generating
function: the risk of unexpected cash requirements is transferred from
the individual to all of the depositors, is pooled and thereby
essentially eliminated2 8.
Apart from liquid assets and government securities, banks hold in their
portfolio loan claims. These are normally analogous to non-traded
bonds, though in some countries banks may also hold equities. The
degree to which banks accept a transfer of risk in their loan operation
depends on the degree to which their loans are collateralized. Fully or
over-collateralized loans transfer little or no risk since the bank is assured of full recovery of the amount borrowed with interest. In
practice, however, collateral values are themselves risky; furthermore
they may be correlated with the results of the project or enterprise.
Even cautious banking systems accept and pool considerable amounts of risk.
Likewise, banks are reasonably good at transferring resources across
time. While it is in the nature of the bank-borrower relationship that
28 Except where financial distress may threaten to compromise the bank's
ability to meet deposit withdrawals, a situation which has become more
banks will generally be reluctant to make long-term loans, a performing borrower will typically be able to rollover his loan, thereby converting a sequence of short-term loans into a long-term one.
However, controls over interest rates, both for depositors and lenders,
has been a major obstacle preventing the banks from intermediating
effectively in developing countries. Other controls, such as directed
credit programs and lending at the behest of government have also weakened the ability of the banks to function in the way we have
discussed. Such controls are arguably the most important single factor
in limiting the effectiveness of the financial systems in developing
countries.
The external sector. It is documented for many countries that residents
have large holdings of financial assets outside the home country. Administrative and legal restrictions on outward capital movements are generally insufficient to inhibit recourse by savers to savings media offered by financial institutions abroad. Clearly part of the
motivation for domestic savers in placing their funds abroad is
political risk. In many cases interest rate controls at home also mean
that foreign financial assets offer higher expected returns. But there is also a considerable gain from portfolio diversification along the lines we have discussed for other instruments, particularly when the domestic availability of such savings media is limited.
If one could be sure of fairly easy access by developing country
implications of this intenation0al intermediation of domestic savings may not be too serious2 9. As discussed below, however, such easy access is not apparently the case.
29 Admittedly it holds back the development of the domestic financial sector
with the value added which might be retained in the developin world.
Furthermore it can often distort incentives by requiring the Involvement of
developing country governments to guarantee private borrowings. But it would
not result in a reduction of the total volume of investable resources to the
4 FINANCIAL ASSETS AND FLOWS IN DEVELOPING COUNTRIES 4.1 Main features of th- data
The data used in this section are drawn from a variety of sources, some unpublished, some official, some based on the work of independent
researchers, some drawn from World Bank sources30. Data for seventeen
countries have been used. For most of the countries, the data are an
elaboration of the national income and expenditure accounts, with savings
and real investment data broken down by sector. In other cases the
financial surplus figures are built up from flow of funds accounts based on
balance sheet data from the financial system.
Financial Surpluses
This section is primarily based on the data for sectoral financial'
surpluses (net lending) for four sectors32
-
household, business,government and foreign - for seventeen countries. State enterprises (where separately available) are included in the business sector.
Each surplus (or deficit if negative) is expressed as a percentage share of
GNP. For each country there is data for at least three years; the longest
time series is for Colombia (16 years). Except for four countries, the
30 See annexed list of sources. It should be noted in particular that no
attempt was made to improve on the statistics obtained from other studies. The underlying methodology is not necessarily the same in all sources and it
is likely that significant conceptual differences remain.
31 Henceforth the word "financial" will be omitted; except where explicitly stated, the discussion refers to financial surplus or equivalently net
lending. A financial deficit (net borrowing) is treated as a negative
surplus.
32 For most of the countries these four sectors are exhaustive. For a few
countries a separate financial sector was identified in the data. This sector, where separately identified, was omitted from the data set being reviewed here. In other cases statistical discrepancies prevented the sectoral surpluses from adding to zero.
TABLE 4: SECTORAL SURPLUSES AS % SHARE IN GNP Selected countries
Average for sample years
Hhold Business Govt Foreign
Algeria, 82-5 7.33 -14.57 4.12 0.25 Cameroon, 80-4 4.02 -9.44 2.65 2.77 Chile, 83-5 3.65 -6.92 -4.32 7.59 China, 82-6 7.01 -8.08 0.27 0.80 Colombia, 70-86 3.54 -4.63 -0.21 1.29 Cote d'Ivoire, 71-8 1.45 -7.74 1.29 4.40 Ecuador, 80-5 5.13 -6.77 -2.47 4.95 India, 70-82 5.52 -1.15 -5.47 1.10 Indonesia, 82-6 3.01 -4.06 -2.97 5.02 Korea, 80-5 6.97 -13.35 1.12 5.15 Malaysia, 80, 85-6 16.79 -7.15 -12.24 1.71 Philippines, 83-5 9.07 -6.96 -3.64 2.93 Portugal, 77-9, 81 14.31 -16.06 -7.28 7.58 Thailand, 81-3 6.78 -6.52 -4.28 5.72 Tunisia, 77, 80-4 2.05 -13.65 2.45 9.10 Turkey, 71-81 7.73 -10.99 -0.86 3.16 Yugoslavia, 70-85 7.02 -8.24 0.69 1.19 Average 6.66 -7.38 -1.69 2.37
time series are not really long enough to carry out statistical analysis.
Instead we have pooled the data to yield 118 country-year observation
points33.
The most salient features of this data set are that (for all but one point)
the household sector is a surplus sector, and that (for all but two points)
the business sector is a deficit sector. The mean surplus of the household
sector is 6.7% of GNP; the mean deficit of the business sector is 7.4%.
Household surpluses range as high as 20% of GNP in a particular year.
There is much wider variation in the goverrment surplus (mean -1.7% of GNP)
and the foreign surplus (mean 2.4% of GAIP). The full data set is presented
in Appendix Table 1, the country averages in Table 434.
There is no systematic variation by region evident in the data. Even for
the household surpluses (shown in figure 1, with the countries grouped by
region) Asia does not have uniformly high figures.
Self-financing ratios
Table 5 and Appendix Table 2 show the estimated self-financing ratios, i.e.
the ratio of gross sector savings to gross sector investment for each of
33 Econometric techniques exist for improving the e' iciency of parameter
estimates in data which is a pooled cross section arLd time series. These
techniques exploit the possible existence of country-specific and
date-specific contributions to the disturbance terms. Without using these
techniques estimation efficiency may be compromised to the extent that the
error terms are not classical (for example they might display
heteroskedasticity). Our data set spans seventeen years (1970-86) for
seventeen countries, but of a potential total of 289 observations for that
number of years and countries we have only 118 observations. This large
ratio of missing observations precluded use of cross section-time series techniques.
34 A small data series for four industrial countries is shown in Appendix
TABLE 5: SELF-FINANCING RATIOS
Country averages
Country, date Hhold Business Govt
Cameroon 80-4 10.16 0.41 1.22 China 82-6 2.26 0.63 1.07 Colombia 70-86 1.67 0.53 1.20 Cote d'Ivoire 71-8 1.42 0.37 1.13 Ecuador 80-5 1.88 0.36 0.70 India 70-82 1.59 0.62 0.43 Korea 80-4 2.07 0.42 1.38 Malaysia 80, 85-6 6.95 0.54 -0.08 Portugal 77-81 2.45 0.02 -0.52 Thailand 81-3 2.94 0.58 0.04 Tunisia 77, 80-4 1.50 0.30 1.79 Turkey 71-81 3.08 0.23 0.88 Yugoslavia 70-85 2.11 0.73 1.29 Average 2.36 0.55 0.84
the household, business and government sectors in thirteen countries. Of greatest interest is the ratio for business. It shows that this sector has had, on a-erage, a substantial net external financing need in all
countries3 5. On average over a period of years, the weighted average for the thirteen countries comes to just over one-half, so that, as a rough
rule of thumb we could say that the data indicates that about one-half of
business's needs for financing capital accumulation are met by external
funding 3 6 .
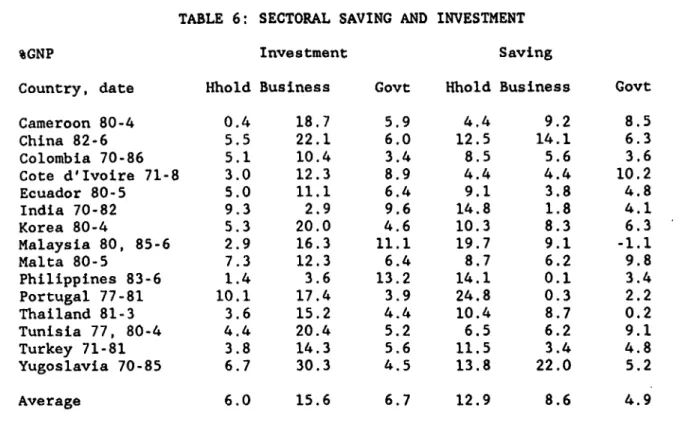
The self-financing ratios are based on data for gross saving and gross
investment, as a share of GNP37. This data is of interest for its own
sake, and is shown in Table 6 and Appendix Table 3. For the sample of
countries and time periods covered, the household sector saved on average about one-half as much again as the business sector.
4.2 Exogenous determinants
What exogenous factors determine the sectoral financial surpluses? The question of whether the foreign, or the government net lending are exogenous to the household and business sectors will be reviewed later. For this section "reduced form" regressions were estimated purporting to explain variations in each of the sector surpluses without reference to each other.
The exogenous factors for which data were collected are openness (measured
by the sum of import and export shares in GNP), per capita income, GNP
growth rate, real interest rate (measured as a differential over the real
35 Other than the Philippines. The Philippines data covers a rather
disturbed period and records gross disinvestment by the business sector in
some years: self-financing ratios have little meaning in such a context.
36 Ratios for a few industrial countries are also in Appendix Table 4.
37 Gross saving includes provision for capital consumption; gross investment
TABLE 6: SECTORAL SAVING AND INVESTMENT
%GNP Investment Saving
Country, date Hhold Business Govt Hhold Business Govt
Cameroon 80-4 0.4 18.7 5.9 4.4 9.2 8.5 China 82-6 5.5 22.1 6.0 12.5 14.1 6.3 Colombia 70-86 5.1 10.4 3.4 8.5 5.6 3.6 Cote d'Ivoire 71-8 3.0 12.3 8.9 4.4 4.4 10.2 Ecuador 80-5 5.0 11.1 6.4 9.1 3.8 4.8 India 70-82 9.3 2.9 9.6 14.8 1.8 4.1 Korea 80-4 5.3 20.0 4.6 10.3 8.3 6.3 Malaysia 80, 85-6 2.9 16.3 11.1 19.7 9.1 -1.1 Malta 80-5 7.3 12.3 6.4 8.7 6.2 9.8 Philippines 83-6 1.4 3.6 13.2 14.1 0.1 3.4 Portugal 77-81 10.1 17.4 3.9 24.8 0.3 2.2 Thailand 81-3 3.6 15.2 4.4 10.4 8.7 0.2 Tunisia 77, 80-4 4.4 20.4 5.2 6.5 6.2 9.1 Turkey 71-81 3.8 14.3 5.6 11.5 3.4 4.8 Yugoslavia 70-85 6.7 30.3 4.5 13.8 22.0 5.2 Average 6.0 15.6 6.7 12.9 8.6 4.9
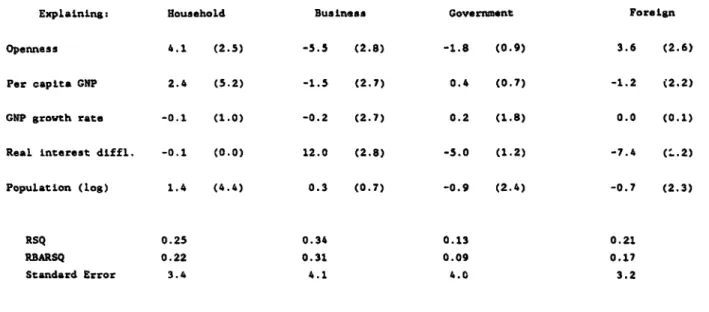
US dollar interest rate)38, and population size. The regression results were somewhat sensitive to the exact specification of the equations39, but a "best" set of results is shown in Table 7. The implications of the
estimated equations may be summarized as follows:
More 9= economies have larger business deficits and larger household
surpluses. More finance comes from abroad. As an indication of
magnitudes, an increase of 10 percentage points in the combined share of imports plus exports increases business sector borrowing by 0.6% of GNP (or by almost one-tenth of its mean level in the sample of 7.4% of GNP).
High =er capita income countries have a higher household surplus and a
higher business deficit. There is less finance from overseas. An
increase of $500 in per capita income is associated with more
household lending to the extent of 1% of GNP.
Faster growth countries have more business borrowing financed by less
government borrowing. A growth rate 5% per annum higher is associated
with more business borrowing to the extent of 1% of GNP.
More Dopulous countries have more household lending, more government
borrowing and less borrowing from abroad.
38 This variable is intended to capture the competitiveness of domestic financial assets relative to foreign financial assets.
39 In particular a decision had to be made whether to opt for results in
equations which included country dummies, or whether to leave such dummies out. In favor of reporting results based on exclusion of country dummies is
an expectation that this will increase the efficiency of the estimate of the
TABLE 7: REDUCED FORff EQUATIONS FOR SECTORkL SURPLUSES
Explaining: Household Business Government Foreign
Openness 4.1 (2.5) -5.5 (2.8) -1.8 (0.9) 3.6 (2.6) Per capita GNP 2.4 (5.2) -1.5 (2.7) 0.4 (0.7) -1.2 (2.2) GNP growth rate -0.1 (1.0) -0.2 (2.7) 0.2 (1.8) 0.0 (0.1) Real interest dlffl. -0.1 (0.0) 12.0 (2.8) -5.0 (1.2) -7.4 (..2) Population (log) 1.4 (4.4) 0.3 (0.7) -0.9 (2.4) -0.7 (2.3) RSQ 0.25 0.34 0.13 0.21 RBARSQ 0.22 0.31 0.09 0.17 Standard Error 3.4 4.1 4.0 3.2
Higher domestic
inSteres
rate (relative to those abroad) lead to lessbusiness borrowing and less lending from abroad. A ten percentage
point increase in interest rates is associated with a reduction in
business borrowing in the amount of 1.2% of GNPM0.
4.3 Pulling and pushing sectors
The independence of foreign and government surpluses
Turning to the data on intersectoral flows, we examined the correlation between the surpluses of the various sectors and discovered that, although
these are linked by an adding-up constraint, the degree of bivariate
correlation varies widely. One striking fact is the apparent lack of
correlation between foreign and government surpluses. (Equations 1 and 2). Though least squares estimates imply a correlation, instrumental variables
correction in equation 2 shows this to be spurious. Thus, if the foreign
surplus is thought of as exogenous to the business and household sectors, we can interpret this as a lack of response of the government surplus to
changes in the availability of foreign funds. Such changes must thus be
absorbed
by the business and household sectors41.G - -0.271 - 0.286 F (1)
(0.6) (2.7)
RSQ-0.060 # of obs - 118 (full sample) OLS
G - -2.208 0.359 F (2)
(2.4) (1.3)
RSQ--0.24 # of obs - 118 (full sample) 2SLS
40 It should be noted that this result is not in line with the theory that
higher interest rates lead to more domestic intermediation.
41 In all of the regression equations, the -bsolute value of the t-statistic
The foreign and gfovernmn sctors are the pushdin:z setr x
As explained, a key question is whether the foreign surplus may be regarded
as exogenous to the business and household surpluses. Regression equations
explaining household and business surpluses respectively by foreign or42 foreign plus government surplus (FG) identified a strong negative
correlation in the case of the business sector, and a weaker negative
correlation in the case of the household sector. (For example equations 3 and 4).
These estimates were obtained by ordinary least squares. One way of
gauging the degree to which FG is exogenous is to re-estimate the equation
by an instrumental variables technique (such as 2SLS) and assess the
difference between the two estimates. Equations 5 and 6 use an instrument
list43 with this in mind. The finding is that the coefficient of the sum of foreign and government surpluses does not change very dramatically when
moving from OLS to 2SLS, especially when a reduced data set omitting three
countries which experience outlying behavior is used (equations 3' to
6')44. To the extent that there is bias, it is in the sense of
exaggerating the impact of foreign and government surplus on the household
sector. With the full sample, after correcting for simultaneous equations
bias, the estimated impact of the sum of foreign and government surplus on
42 The similarity of the coefficients on the G and F terms in the estimated
equations suggests that the business and household sectors both respond to a
financing shock to a degree which is independent of the source of the shock.
This was verified by imPosing the restriction that the coefficient on each of
F and G be the same. This restriction satisfied the appropriate F-test.
43 GNP per capita, share of exports in GNP, inflation, population, real interest differential vis-a-vis the US$ and GNP growth rate.
44 Observations for Malaysia, the Philippines and Portugal are outliers in equations (3) and (4). This suggested examining results for a reduced data set omitting these countries. The exclusion of outliers is always
controversial; in this case the uncertain quality of some of the data, and the certainty that the equations are underspecified seems to argue in favor of erring on the side of exclusion.