Chimonaki, C, Papadakis, S, Vergos, K and Shahgholian, A
Identification of financial statement fraud in Greece by using computational
intelligence techniques
http://researchonline.ljmu.ac.uk/10153/
Article
LJMU has developed LJMU Research Online for users to access the research output of the University more effectively. Copyright © and Moral Rights for the papers on this site are retained by the individual authors and/or other copyright owners. Users may download and/or print one copy of any article(s) in LJMU Research Online to facilitate their private study or for non-commercial research. You may not engage in further distribution of the material or use it for any profit-making activities or any commercial gain.
The version presented here may differ from the published version or from the version of the record. Please see the repository URL above for details on accessing the published version and note that access may require a subscription.
For more information please contact [email protected]
Citation
(please note it is advisable to refer to the publisher’s version if you
intend to cite from this work)
Chimonaki, C, Papadakis, S, Vergos, K and Shahgholian, A Identification of
financial statement fraud in Greece by using computational intelligence
techniques. Lecture Notes in Business Information Processing. ISSN
1865-1348 (Accepted)
Identification of financial statement fraud in Greece by using
computa-tional intelligence techniques
Christianna Chimonaki1, Stelios Papadakis2, Konstantinos Vergos1, Azar Shahgholian3
1University of Portsmouth, Portsmouth, UK, 2Technology Educational Institute of Crete, 3Liverpool John Moores
University, Liverpool, UK
1{christianna.chimonaki, konstantinos.vergos}@port.ac.uk, [email protected],3[email protected]
Abstract. The consequences of financial fraud are an issue with far-reaching for investors, lenders, regulators, corpo-rate sectors and consumers. The range of development of new technologies such as cloud and mobile computing in recent years has compounded the problem. Manual detection which is a traditional method is not only inaccurate, ex-pensive and time-consuming but also they are impractical for the management of big data. Auditors, financial institu-tions and regulators have tried to automated processes using statistical and computational methods. This paper presents comprehensive research in financial statement fraud detection by using machine learning techniques with a particular focus on computational intelligence (CI) techniques. We have collected a sample of 2469 observations since 2002 to 2015. Research gap was identified as none of the existing researchers address the association between financial state-ment fraud and CI-based detection algorithms and their performance, as reported in the literature. Also, the innovation of this research is that the selection of data sample is aimed to create models which will be capable of detecting the falsification in financial statements.
Keywords: Financial statement fraud, Machine learning techniques, Classification.
1
Introduction - Background
The stock and bond markets are critical components of a capitalist economy. The efficiency, liquidity, and resiliency of these markets depend on the ability of investors, lenders and regulators to assess the financial performance of businesses that raise capital. Financial statements prepared by such organizations play a very important role in keeping capital markets efficient. They provide meaningful disclosures of where a company has been; where it is currently and where it is going. Most financial statements are prepared with integrity and present a fair representation of the financial position of the organization issuing them. These financial statements are based on generally accepted accounting principles (GAAP), which guide the ac-counting for transactions.
Unfortunately, financial statements are sometimes prepared in ways that intentionally misstate the financial position and performance of an organization. Such misstatements can result from manipulating, falsifying, or altering accounting records. Misleading financial statements cause serious problems in the market and the economy. They often result in large losses for investors, lack of trust in the market and accounting sys-tems, and litigation and embarrassment for individuals and organizations associated with financial state-ment fraud.
Specifically, according to Wells (2005), financial statement fraud is harmful in many ways. These cases are: Firstly, undermines the reliability, quality, transparency and integrity of the financial reporting process, secondly jeopardizes the integrity and objectivity of the auditing profession, especially auditors and audit-ing firms for example Andersen, thirdly, diminishes the confidence of the capital markets, as well as market participants, in the reliability of financial information, fourthly makes the capital markets less efficient, fifth adversely affects the nation’s economic growth and prosperity, sixth results in huge litigation costs, seventh destroy careers of individuals involved in financial statement fraud, eighth causes bankruptcy or substantial economic losses by the company engaged in financial statement fraud, ninth encourages regula-tory intervention, tenth causes devastation in the normal operations and performance of alleged companies,
eleventh raises serious doubt the efficacy of financial statement audits and finally erodes public confidence and trust in the accounting and auditing profession.
According to the Association of Certified Fraud Examiners’ (ACFE’s) in its report to the nation on occupa-tional fraud and abuse (2014), the average financial statement fraud by survey respondents is over US $1 million. Financial statement frauds, such as the WorldCom and Enron frauds, can overstate income by bil-lions of US dollars.
Furthermore “public statistics on the possible cost of financial statement fraud are only educated estimates, primarily because it is impossible to determine actual costs since not all fraud is detected, not all detected fraud is reported, and not all reported fraud is legally pursed” (Rezaee 2002). Therefore, financial statement fraud combined with audit failure, increase the interest of investors, lenders and regulators.
As a result, there is the requirement of investors, lenders and regulators to learn how to detect financial statement fraud more effectively. Therefore, this research aims to investigate how the investors, lenders and regulators can detect financial statement fraud. Section 2 refers in details the specific efforts of previous researchers in detecting financial fraud. Section 3 refers to the proposed methodology. Section 4 is a dis-cussion of our findings. Section 5 provides a conclusion to our research
We employ well-established machine learning techniques to identify the factors which are actually con-nected with the financial statement fraud. Moreover, we provide intelligent, non-parametric models for the identification of financial fraud observational financial data of any company. Also, this research compares the effectiveness of different tools to detect fraud and find out the gaps existed between the judgments of the experts and different prediction model.
2
Review of Related Literature
There are many different types of fraud, as well as a variety of data mining, and research is continually being undertaken to find the best approach for each case (West 2015). Data mining refers to any method that processes large quantities of data to derive an underlying meaning. Within this classification (West 2015) will consider two categories of data mining: statistical and computational. The statistical techniques are based on traditional mathematical methods, such as logistic regression and Bayesian theory. Computa-tional methods are those who use modern intelligence techniques, such as neural networks and support vec-tor machines. Also (West 2015) consider that these categories share many similarities, but the main differ-ence between them is that computational methods are capable of learning from and adapting to the problem domain, while statistical methods are more rigid. In this research, we examine both types of data mining. Specifically, in this research, we compare the performance of two data mining methods including Naves Bayes, and K-nearest neighbours.
The first researchers (Zhang et al., 1998,) who investigated the fraud detection focused heavily on statisti-cal models such as logistic regression and neural networks. Recent fraud detection research has been far more varied in methods studied, although the former techniques are still popular (West 2015). The most recent studies like Kirkos et al. (2007), Ravisankar et al. (2011), which have examine the financial state-ment fraud used classification methods to detect fraud. Classification is a data mining method that separates a list of unknown samples into one of several discrete classes (Ngai et al., 2011). Binary classification is a simplified case in which there exists only two possible categories (such as fraudulent and non-fraudulent). In contrast, regression is a traditional statistical method that has been used extensively in data mining for many years. It aims to expose relationships between a dependent variable and a set of independent variables (Ngai et al., 2011).
Kirkos et al., 2007 compared statistical methods with neural networks to identify fraudulent Greek manu-facturing companies. Also in 2011, Ravisankar et al., 2011 compared a large range of methods to identify financial statement fraud within Chinese companies. In addition, to supporting vector machines they looked at genetic programming, logistic regression, group method of data handling, and variety of neural networks Ravisankar et al. Also Bose and Wang (2007) compared neural network and decision tree to explore finan-cial statement fraud with finanfinan-cial items from a selection of public Chinese companies. Furthermore, Humpherys et al., (2011) used text mining techniques to investigate the financial statement fraud with man-agerial statements for US companies. Zhou and Kapoor (2011) looked at common behaviours that are fre-quently present for financial statement fraud and created a framework to be used for designing detection methods.
The identification of financial fraud is difficult or even impossible by using first principles approach. Ac-cording to the Institute of Internal Auditors (2001) a fraud examiner commonly uses the following tech-niques to identify the relationships among the financial data that do not appear reasonable:
Comparison of current period information with similar information from prior periods. Prior period amounts normally are assumed to be the expectation for the current period. A modification of this com-parison is the incremental approach whereby prior period numbers are adjusted for known changes, such as significant purchases or sales of assets and changes in lines and volumes of business.
Comparison of current period information with budgets or forecasts. This comparison should include adjustments for expected unusual transactions and events.
Study of relationships among elements of information. Certain accounts vary in relation to others, both within a financial statement and across financial statements. For instance, commissions are expected to vary directly in relation to sales.
Study of relationships of financial information with the appropriate non-financial information. Non
-financial measures are normally generated from an outside source. An example would be retail stores where sales are expected to vary with the number of square feet of shelf space.
Comparison of information with similar information from the industry in which the organization oper-ates. Industry averages are reliable in stable industries. Unfortunately, industry trade associations re-quire months to compile, analyze, and publish information; therefore, the data may not be timely.
Comparison of information with similar information from other organizational units. A company with several stores might compare one store with another store. The “model” store should be sufficiently au-dited to assure that it is an appropriate standard.
As we can conclude for the above procedure about the techniques which a fraud examiner uses to detect financial fraud appear many gaps. On the other hand computational intelligence and statistics help to antic-ipate and quickly detect fraud and take immediate action to minimize costs.
However, we assume that there exists a relationship between specific financial attributes and the existence or absence of financial fraud (outcome). This potential relationship between these factors and the outcome is not exactly known due to the inherent uncertainty Parsons (1996), Ren et al. (2009), of the financial data. As a consequence, we are dealing with the problem as a ‘black box’ system. The input of the system is a set of specific attributes (factors), while its output is the outcome of these attributes, caused by the system in a way which is not exactly known. The only knowledge we have about the operation of the system arises from specific observations regarding what outcome causes specific inputs (attributes). The target of model-ing is buildmodel-ing a model (i.e. a mathematical function) for simulatmodel-ing the unknown system. That is a model that delivers the same outcome as the unknown system on the given data set of observations.
Over the years, various computational methods have been used for fraud detection and, like other similar problems; successful implementation of the detection methods depends on having a clear understanding of the problem domain. While some prior researchers have focused on the common issues such as problem representation for machine learning techniques problems, in general, there has been almost no analysis from the perspective of fraud detection which we aim to address here. The implementation of these tech-niques follows the same information flow of machine learning techtech-niques processes in general.
3
The proposed methodology
We formulate the problem of financial fraud detection as a classification problem, assuming that the exist-ence or the absexist-ence of financial fraud depends on specific quantitative financial attributes. These attributes, listed in Table 1, are the input to the classifier. The output of the classifier is either ‘1’=FFSs (Financial Fraud Statement) or ‘0’=Non-FFSs, indicating the existence or the absence of fraud, respectively. If suffi-cient historical data (instances, in the form attribute-label) exist, then the classifier’s workflow can be di-rected at increasing the chances to capture the opportunities for preventing loss by identifying and verifying potential financial fraud.
In this research, we follow CRISP-DM approach which follows the following steps: (i) Business Under-standing, (ii) Data UnderUnder-standing, (iii) Data preprocessing, (iv) Modeling, (v) evaluation, and (vi)
Deploy-ment. Business understanding phase was presented in section 2. In this section, data collection, data under-standing and modeling are discussed. Section 4; explain the findings, evaluation and deployment phases.
3.1 Data collection/description
A sufficient number of samples should be collected after the definition of candidate attributes. These sam-ples are raw data and usually needs preprocessing for detecting potential outliers and missing values. An-other important preprocessing data step is the normalization of attributes.
The selection of data sample is aimed to create models which will be capable of detecting the falsification in financial statements. For this reason, several factors have been examined. One of the most important factors is the sector of enterprises because the sector of enterprises affects their financial profile. Our main sources for data were the published financial statements and their notes from the Athens Stock Exchange database.
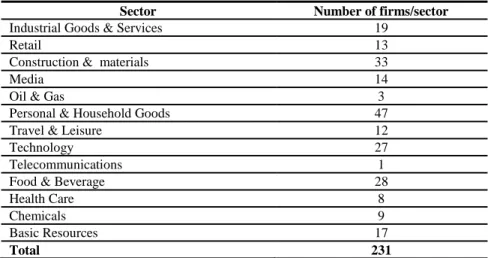
Initially, our sample contained data from 231 Greek listed on the Athens Stock exchange since 2002-2015. Our sample contains 2469 observations. We analyze the number of firms per sector in Table 1, after ex-cluding the sectors of banking, utilities, and financial services, from the sample.
Table 1: The number of firms per sector
Sector Number of firms/sector
Industrial Goods & Services 19
Retail 13
Construction & materials 33
Media 14
Oil & Gas 3
Personal & Household Goods 47
Travel & Leisure 12
Technology 27
Telecommunications 1
Food & Beverage 28
Health Care 8
Chemicals 9
Basic Resources 17
Total 231
According to Spathis (2002), and Kirkos et al. (2007), the classification of the financial statement as fraud was based on the following parameters:
The inclusion in the auditors’ reports of opinions of serious doubt as to the correctness of accounts,
The observations by the tax authorities regarding serious taxation intransigencies which seriously alter the company’s financial statements,
The application of Greek legislation regarding negative net worth,
The inclusion of the company in the Athens Stock Exchange categories of "under observation" and "ne-gotiation suspended" for reasons associated with falsification of the company’s financial data and
The size of the auditor firm.
After the selection of the fraud sample, we searched for a non-fraud sample from the same sources. The
choice of the non-fraud enterprises was carried out by using the matching method Hunt and Ord (1988),
Sibley and Burch (1979). The matching method is a common practice in financial classification researches such as bankruptcy, mergers, acquisitions, etc. Beaver (1966),. There are two main reasons which we use the method of matching. The first reason is the high cost and the time which is needed for the selection of sample (Bartley & Boardman, 1990) and the second reason is the higher information which contained in this sample in compare of a random sample Cosslett (1981), and Palepu (1986).
Therefore, the main criterion for the similarity of the two samples is the period Stevens (1973). The criteri-on of period refers to the changes in a country’s macroeccriteri-onomic envircriteri-onment and has an impact criteri-on eco-nomic conditions and business decision making. Also, there is one more main criterion which is the sector
and the total assets. Stice (1991) referred that the sector and the size are the most important factors for the matching method.
On the other hand, the matching method has accepted criticisms. Ohlson (1980) refers that the criteria which used for the matching method tend to be arbitrary. Also, Ohlson (1980) refers that there is not abso-lutely clear the advantages process of the matching method. Ohlson (1980) suggests that is more preferable to use the different factors as independent variables of the sample than to use for the purpose of matching method.
3.2 Candidate attributes
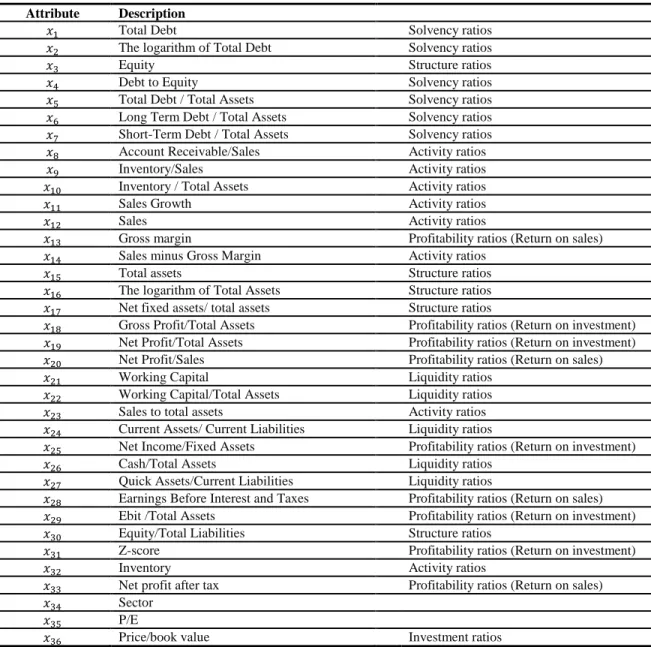
This paper adopted the related attributes based on prior researchers, who study the FFS. Such work carried out by Spathis (2002), Spathis et al. (2002), Fanning and Cogger (1998), Persons (1995), Stice (1991), Feroz et al. (1991), Loebbecke et al (1989), and Kinney (1989) contained suggested indicators of FFS. So there are a number of attributes which considered more possible to lead in the falsification of the financial statement. The financial ratios, examined in this research appear in Table 2.
Table 2: The List and description of candidate attributes. Attribute Description
� Total Debt Solvency ratios
� The logarithm of Total Debt Solvency ratios
� Equity Structure ratios
� Debt to Equity Solvency ratios
� Total Debt / Total Assets Solvency ratios
� Long Term Debt / Total Assets Solvency ratios
� Short-Term Debt / Total Assets Solvency ratios
� Account Receivable/Sales Activity ratios
� Inventory/Sales Activity ratios
� Inventory / Total Assets Activity ratios
� Sales Growth Activity ratios
� Sales Activity ratios
� Gross margin Profitability ratios (Return on sales)
� Sales minus Gross Margin Activity ratios
� Total assets Structure ratios
� The logarithm of Total Assets Structure ratios
� Net fixed assets/ total assets Structure ratios
� Gross Profit/Total Assets Profitability ratios (Return on investment)
� Net Profit/Total Assets Profitability ratios (Return on investment)
� Net Profit/Sales Profitability ratios (Return on sales)
� Working Capital Liquidity ratios
� Working Capital/Total Assets Liquidity ratios
� Sales to total assets Activity ratios
� Current Assets/ Current Liabilities Liquidity ratios
� Net Income/Fixed Assets Profitability ratios (Return on investment)
� Cash/Total Assets Liquidity ratios
� Quick Assets/Current Liabilities Liquidity ratios
� Earnings Before Interest and Taxes Profitability ratios (Return on sales)
� Ebit /Total Assets Profitability ratios (Return on investment)
� Equity/Total Liabilities Structure ratios
� Z-score Profitability ratios (Return on investment)
� Inventory Activity ratios
� Net profit after tax Profitability ratios (Return on sales)
� Sector
� P/E
3.3
Data preprocessing
Data preprocessing involves several steps, for preparing cleansing and normalizing the raw data before being used for modeling. Missing values is one of the most common issues that the data preprocessing should face. In this work, we entirely remove a sample from a data set if one or more attributes of the sam-ple have missing values. In addition, in this work, we performed the normalization step by linearly mapping each attribute’s value from its actual range within the interval [ , ]. In the next step, we considered as out-liers those instances (companies) having extreme or out of feasible range values for some attributes. Outli-ers were removed from the data set before applying any modeling technique.
We use wrapper based methods as they tend to deliver more accurate results than filter based ones Monroe and The (1993). A particular model is used as wrapper and different subsets of attributes are sequentially presented to it according to forward inclusion approach.
3.4
Description of employed models (wrappers)
We use particular models from established paradigms of machine learning and from statistics. More specif-ically, we use K-Nearest Neighbor as a representative from “instance-based learning”; From statistics, we
use Naïve Bayes method from the “Bayesian paradigm”. Although, a lot of variations of each model exist, however, we apply the “principal” model which we consider as “representative” of each paradigm. The main advantage of K-Nearest Neighbor Classifier is a very simple classifier that works well on basic
recognition problems. The main disadvantage of this approach is that the algorithm must compute the dis-tance and sort all the training data at each prediction, which can be slow if there are a large number of train-ing examples. On the other hand, the first advantage of Naïve Bayes Classifier is fast to train fast to classi-fy, Second in not sensitive to irrelevant features. Thirdly it handles real and discrete data and finally the Naïve Bayes Classifier handles streaming data well. Also the main disadvantage is that it assumes strong feature independence assumption.
4
Experimental results
4.1 Comparison with factor importance
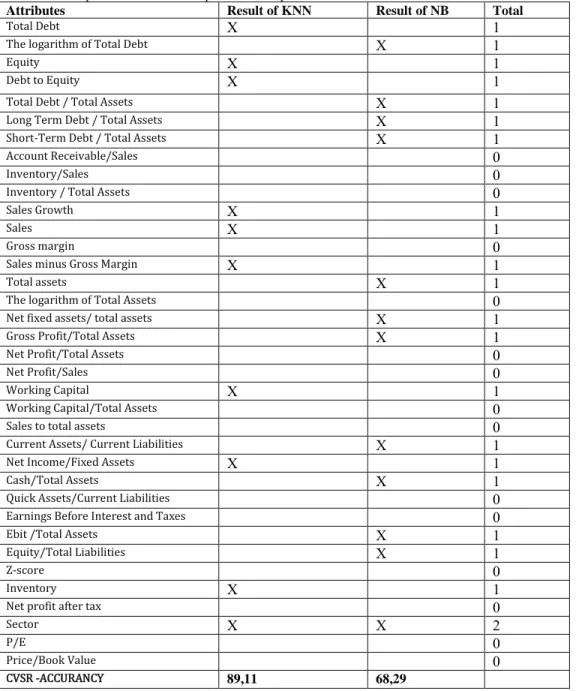
Overall, in table 3 appears the comparison results from all the methods of machine learning techniques. Also, in table 3 shows the fraud factors in different methods and the comparison of empirical data result. In addition, table 3 indicates the importance of attributes included in prediction models. The most important category of fraud detection is “poor performance”. All factors effects are consistent with prior researches. The top seven fraud factors are a log of Total Debt, Equity, Debt to Equity, a log of total assets, net fixed assets to total assets, cash to total assets and sector. Furthermore, the Profitability, Liquidity, Solvency, Ac-tivity and Structure ratios are significant predictors for fraud detection. Specifically, the significant ratios which are the most important for fraudulent financial statements appeared in table 3 and analyzed follow-ing.
Leverage proxies is a significant result as an indicator for fraud analysis. These ratios are consistent with Spathis (2002) while and Fanning and Cogger (1998) which suggest that firms with higher debt to equity ratios would be a good indicator for fraudulent firms. Furthermore, it means that firms with a high total debt to total equity value have an increased probability to be classified as fraudulent firms. Previous studies such as Persons (1995) supported that the high debt structure it is possible to motivate in the FFS. In addition, Loebbecke (1989) concluded in their research that 19% of firms of their sample appeared solven-cy problems.
Lower liquidity may be an incentive for managers to engage in fraudulent financial statements. This argu-ment is supported by Kreutzfeldt and Wallace (1986) who discovered that firms with liquidity problems
have significant more errors in their financial statement than firms without liquidity problems. In this research, the most important liquidity ratios which associate with the fraudulent financial statement are the Working capital, Current assets to Current liabilities and Cash to Total Assets.
Furthermore, lower profit may give management incentive to overstate revenue or understate expenses. Kreutzfeldt and Wallace (1986) discovered that firms with profitability problems have significantly more errors in the financial statement than firm without profitability problems. This approach is based on the expectation that management will be able to maintain or improve past levels of profitability Summers & Sweeney (1998). If this expectation is not met by actual performance, then it motivates the fraudulent fi-nancial statement. Fifi-nancial distress is a motivation for fraudulent fifi-nancial statements Loebbecke et al. (1989), Kreutzfeldt and Wallace (1986). In this research, the most important profitability ratios for FFS are gross profit to total assets, net profit to total assets, net income to fixed assets and EBIT to total assets. Table 3: Comparison with factor & predict the importance
Attributes Result of KNN Result of NB Total
Total Debt X 1
The logarithm of Total Debt X 1
Equity X 1
Debt to Equity X 1
Total Debt / Total Assets X 1
Long Term Debt / Total Assets X 1
Short-Term Debt / Total Assets X 1
Account Receivable/Sales 0
Inventory/Sales 0
Inventory / Total Assets 0
Sales Growth X 1
Sales X 1
Gross margin 0
Sales minus Gross Margin X 1
Total assets X 1
The logarithm of Total Assets 0
Net fixed assets/ total assets X 1
Gross Profit/Total Assets X 1
Net Profit/Total Assets 0
Net Profit/Sales 0
Working Capital X 1
Working Capital/Total Assets 0
Sales to total assets 0
Current Assets/ Current Liabilities X 1
Net Income/Fixed Assets X 1
Cash/Total Assets X 1
Quick Assets/Current Liabilities 0
Earnings Before Interest and Taxes 0
Ebit /Total Assets X 1
Equity/Total Liabilities X 1
Z-score 0
Inventory X 1
Net profit after tax 0
Sector X X 2
P/E 0
Price/Book Value 0
Capital Turnover proxies by receivables to revenue also have significant results. High ratios of account receivables to sales and inventory to sales are consistent with research suggesting that accounts receivables are an asset with a higher incidence of manipulation. Also, asset composition proxies by inventory to total assets indicate significant results. In addition, our research concludes that the size of the firm is statistically significant and measured by total assets. Finally, ratios sales growth, sales to total assets sales minus gross margin inventory net fixed assets to total assets equity to total liabilities, and P/E are significant in the de-tection of the fraudulent financial statement.
This result supported by the result of the research with the rate of correct classification which analyzed in the next section.
4.2
Comparison with predict performance
Performance evaluation is the final step of the framework which is used for measuring the performance and judging the efficacy of machine learning techniques.
The pre-processed dataset was further randomly divided into training and testing sets via K-fold cross
-validation. A typical experiment uses K=5. The sample was divided 5-fold via stratified 5-fold cross
-validation. Each fold contained equal numbers of fraud and non-fraud cases. Each fold of the sample was
used individually to define parameters and train classifiers, while the remaining five folds were used as test sets to assess the sample performance. After the parameters were set and the classifiers have trained the methods were evaluated by applying them to the test sets. Finally, the average classification accuracy of the test sets was calculated. After preparation of the 5-fold cross validation datasets these datasets were used by
the two classifiers. The proposed ensemble of classifiers was developed and validated based on the classifi-er results.
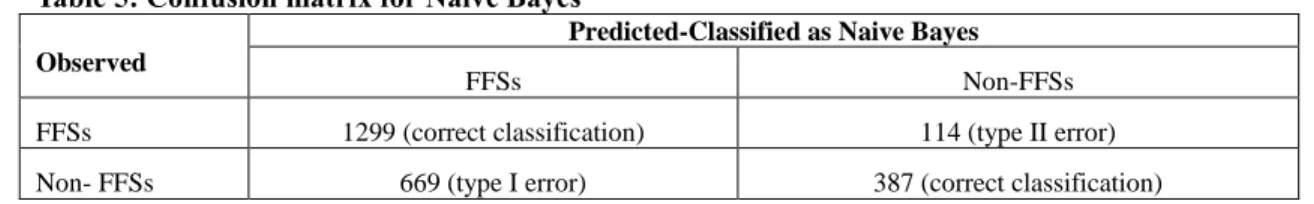
Besides classification accuracy, this research also used misclassification cost. Generally, misclassification cost is associated with two error types. A type error I occur when a non-fraud case is classified as a fraud
class. Meanwhile, a type II error is committed when a fraud case is classified as a non-fraud class. The
mis-classification costs associated with type II errors are reportedly much higher than those associated with type I error West (2014). Classifying a fraud case into a non-fraud class may result in incorrect decisions about
economic damage. Moreover, classifying a non-fraud case into a fraud class may result in expenses and
excess time associated with the additional investigation.
The 5-fold cross validation performances of the six classification methods were calculated and compared.
The KNN has the higher average accuracy (89,11%), and Naives Bayes has the lowest accuracy (68,29%) respectively.
The confusion matrix for KNN and NB are presented in Tables 4 and 5. Also, performance matrix indicat-ing the sensitivity (type I error) and specificity (type II error) of the two methods which are used in this research. Sensitivity (type I error) and specificity (type II error) have been used as a metrics for perfor-mance evaluation. The sensitivity is the measure of the proportion of the number of fraudulent companies predicted correctly as fraudulent by a particular model to the total number of actual fraudulent companies. The specificity is the measure of the proportion of the number of non-fraudulent companies predicted as
non-fraudulent by a model to the total number of actual non-fraudulent companies. In both cases, we
pre-sented the average accuracies, Sensitivity, specificity, accuracy, error rate, precision (table 6).
Table 4: Confusion matrix for KNN
Observed
Predicted-Classified as KNN
FFSs Non-FFSs
FFSs 1300 (correct classification) 113 (type II error) Non- FFSs 132 (type I error) 924 (correct classification)
Table 5: Confusion matrix for Naive Bayes
Observed
Predicted-Classified as Naive Bayes
FFSs Non-FFSs
FFSs 1299 (correct classification) 114 (type II error) Non- FFSs 669 (type I error) 387 (correct classification)
Table 6. Sensitivity, specificity, accuracy, error rate, precision
Sensitivity Specificity CVSR -Accuracy Misclassification Rate- Error rate Precision
K - Nearest Neighbours (KNN)
87.50% 92.00% 89,11% 9.92% 89.10%
Naive Bayes (NB)
36.65% 91.93% 68,29% 31.71% 77.25%
5
Conclusion
Reasons for committing financial statement fraud include improving stock performance, reducing tax obli-gations or as an attempt to exaggerate performance due to managerial pressure Ravisankar, et al. (2011). Financial statement fraud can be difficult to diagnose because of a general lack of understanding of the field, the infrequency in which it occurs, and the fact that it is usually committed by knowledgeable people within the industry who are capable of masking their deceit Maes (2002). This research studied intelligent approaches to fraud detection, both statistical and computational. There is also the opportunity to examine the performance of existing methods by adjusting their parameters, as well as the potential to study cost
-benefit analysis of computational fraud detection. Finally, further research into the differences between each type of financial fraud could lead to a general framework which would greatly improve the accuracy of intelligent detection methods.
6
References
Association of Certified Fraud Examiners’ (ACFE’s) in its report to the nation on occupational fraud and abuse (2014)
Bartley, J.W., Boardman, C.M. (1990), “The relevance of inflation adjusted accounting data to the prediction of corporate takeovers”, Journal of Business Finance and Accounting, Vol. 17, No. 1, pp. 53-72
W. H. Beaver, “Financial ratios as predictors of failure,” J. Account. Res., pp. 71–111, 1966.
I Bose,Wang J. Data mining for detection of financial statement fraud in Chinese Companies. Paper presented at the International conference on electronic commerce, administration, society and education, Hong Kong, 15–17 August 2007.
A. A. Christie, “Aggregation of test statistics: An evaluation of the evidence on contracting and size hypotheses,” J. Account. Econ., vol. 12, no. 1–3, pp. 15–36, 1990.
S. R. Cosslett, “Efficient estimation of discrete-choice models,” Struct. Anal. Discrete Data Econom. Appl.,
1981.
K. M. Fanning and K. O. Cogger, “Neural network detection of management fraud using published financial data,” Int. J. Intell. Syst. Account. Finance Manag., vol. 7, no. 1, pp. 21–41, 1998.
E. H. Feroz, K. Park, and V. S. Pastena, “The financial and market effects of the SEC’s accounting and auditing enforcement releases,” J. Account. Res., pp. 107–142, 1991.
R. W. Holthausen and R. W. Leftwich, “The economic consequences of accounting choice implications of costly contracting and monitoring,” J. Account. Econ., vol. 5, pp. 77–117, 1983.
SL Humpherys, Moffitt KC, Burns MB, Burgoon JK, Felix WF. Identification of fraudulent financial statements using linguistic credibility analysis. Decision Support Systems 2011;50:585–94
H. G. Hunt and J. K. Ord, “Matched pairs discrimination: Methodology and an investigation of corporate accounting policies,” Decis. Sci., vol. 19, no. 2, pp. 373–382, 1988.
W. R. Kinney and L. S. McDaniel, “Characteristics of firms correcting previously reported quarterly earnings,” J. Account. Econ., vol. 11, no. 1, pp. 71–93, 1989.
E. Kirkos, C. Spathis, and Y. Manolopoulos, “Data mining techniques for the detection of fraudulent financial statements,” Expert Syst. Appl., vol. 32, no. 4, pp. 995–1003, 2007.
R. Kreutzfeldt and W. Wallace (1986), Error characteristics in audit populations:their profile and relationship to environment factors.Auditing : A journal of Practice and Theory ,6. 20-43.
J. K. Loebbecke, M. M. Eining, and J. J. Willingham, “Auditors experience with material irregularities
-frequency, nature, and detectability,” Audit.- J. Pract. Theory, vol. 9, no. 1, pp. 1–28, 1989.
Maes S, Tuyls K, Vanschoenwinkel B, Manderick B. Credit card fraud detection using Bayesian and neural networks. In Proceedings of the 1st International Naiso Congress on Neuro Fuzzy Technologies. 2002. E.Ngai, Hu Y,Wong Y, Chen Y, Sun X. The application of data mining techniques in financial fraud detection: a classification framework and an academic review of literature. Decision Support Systems 2011;50:559–69.
J. A. Ohlson, “Financial ratios and the probabilistic prediction of bankruptcy,” J. Account. Res., pp. 109– 131, 1980.
O. S. Persons, “Using financial statement data to identify factors associated with fraudulent financial reporting,” J. Appl. Bus. Res., vol. 11, no. 3, p. 38, 1995.
P. Ravisankar, V. Ravi, G. R. Rao, and I. Bose, “Detection of financial statement fraud and feature selection using data mining techniques,” Decis. Support Syst., vol. 50, no. 2, pp. 491–500, 2011.
J. Ren, S. D. Lee, X. Chen, B. Kao, R. Cheng, and D. Cheung, “Naive bayes classification of uncertain data,” in 2009 Ninth IEEE International Conference on Data Mining, 2009, pp. 944–949.
Z Rezaee. In Financial statement fraud: prevention and detection. Hoboken, NJ: JohnWiley & Sons; 2002 A. Sibley and E. E. Burch, “Optimal selection of matched pairs from large data bases,” Decis. Sci., vol. 10, no. 1, pp. 62–70, 1979.
C Spathis., et al., ‘Detecting false financial statements using published data: some evidence from Greece’, Managerial Auditing Journal, Vol. 17, No. 4, pp. 179-1912002
C. Spathis, M. Doumpos, and C. Zopounidis, “Detecting falsified financial statements: a comparative study using multicriteria analysis and multivariate statistical techniques,” Eur. Account. Rev., vol. 11, no. 3, pp. 509–535, 2002 (b).
D. L. Stevens, “Financial characteristics of merged firms: A multivariate analysis,” J. Financ. Quant. Anal., vol. 8, no. 02, pp. 149–158, 1973.
J. D. Stice, “Using financial and market information to identify pre-engagement factors associated with
lawsuits against auditors,” Account. Rev., pp. 516–533, 1991.
The Institute of Internal Auditors (2001), Practice Advisory 2320-1, "Analysis and Evaluation", January 5,
2001
J. T WELLS, Principles of Fraud Examination. Wiley, 2005
J West, Bhattacharya M and Islam R (2014) “Intelligent Financial Fraud Detection Practices: An Investigation”, in Proceedings of the 10th International Conference on Security and Privacy in Communication Networks (SecureComm 2014)
G Zhang, Eddy Patuwo B, Hu MV. Forecasting with artificial neural networks: the state of the art. Int J Forecast 1998;14:35– 62
W Zhou, Kapoor G. Detecting evolutionary financial statement fraud. Decision Support Systems 2011;50:570–5.