Predicting Corporate Bankruptcy in Pakistan
A Comparative Study of Multiple Discriminant Analysis (MDA)
and Logistic Regression
ASAD ALI JAFFARI
Muhammad Ali Jinnah University, Islamabad,Pakistan ZEESHAN GHAFOOR
Riphah International University, Islamabad,Pakistan Abstract
Purpose:- The aim of the study was to predict corporate bankruptcy in an emerging market like Pakistan by employing two statistical methods which are Discriminant Analysis (MDA) and Logistic Regression (Logit). It was also aimed at identifying the predicting accuracies of these statistical methods.
Methodology:- This study had examined 35 bankrupt and 35 non-bankrupt companies which belongs to sector (non-financial) of Pakistan listed at KSE (Karachi Stock Exchange) over the period of seventeen years i.e. 1996 to 2012. Here, we had compared the accuracy and predictive ability of two statistical methods which are Discriminant Analysis (MDA) and Logistic Regression (Logit) and was expecting that Logistic Regression (Logit) accuracy and predictive ability will supercede Multiple Discriminant Analysis (MDA) accuracy and predictive ability.
Findings:- The results have proved that Logistic Regression accuracy and predictive ability (80%) is better than the accuracy and predictive ability (78.6%) of Multiple Discriminant Analysis (MDA). It is proved that both the models identified the same amount of predictors for bankruptcy prediction. The variables identified by Logistic Regression are Shareholder’s Equity / Debt (Book Value), EBIT / Current Liabilities, Retained Earnings / Total Assets and variables identified by Multiple Discriminant Analysis (MDA) are EBIT / Current Liabilities, Sales / Total Assets and Sales / Quick Assets which have shown significant contribution towards bankruptcy prediction. Originality/Value:-This paper had revealed the accuracy and predictive ability of two statistical methods which are Discriminant Analysis (MDA) and Logistic Regression (Logit) employed in this study and has shown us the better model i.e. Logistic Regression which needs to be used in future for prediction of corporate bankruptcy in Pakistan.
Limitations:- This study had used the small sample size and the focus was at Non-Financial Sector only. So it may be extended to other sectors and to other developing countries of the world.
Practical Implications:- This study will be beneficial for managers and investors. INTRODUCTION
Financial statements’ primary objective is to provide useful economic information for making appropriate decisions (Altman & McGough, 1974). Whenever, there is an investment decision it is important to consider whether the firm will be facing financial problems such as liquidation or bankruptcy in near future. To predict bankruptcy or liquidation at the earliest is an important concern to stakeholders like investors, creditors, suppliers, employees and management so that they can make their plans accordingly. Financial ratios are used to detect operating and financial difficulties of a company. From the past literature, it is evident that ratios of bankrupt companies significantly differ with ratios of non-bankrupt companies. Commonly used ratios predict the Profitability, Solvency, Operating Efficiency and Liquidity of a company. However, different studies suggest a group of different ratios as the most significant contributor. Initially Current ratio was commonly used to evaluate the credit worthiness of the companies. Nowadays, different ratios are used by lenders, investors, credit rating agencies and management of the company. However, from last sometime the significance of ratio analysis has been downgraded by theorists and emphasis is on statistical techniques. Therefore, it is needed to focus on using different statistical techniques along with ratio analysis which has been extensively used by academicians in last some years.
Financial Distress is a situation where payment to creditors is not made or made with difficulty. If this state of situation remains intact, then it can lead to bankruptcy. Bankruptcy is defined as the failure of a company to continue current operations because of its obligations (Pongstat et al., 2004). With the passage of time and especially with the departure of WorldCom and Enron, the importance of bankruptcy prediction increases which demands for a most suitable prediction model. Bankruptcy prediction is important in both developed and developing countries. Pakistan is considered as developing nation along with different rising industries. From the last some years, we can see the great number of companies became bankrupt in Pakistan and therefore, there is need to build up a model for bankruptcy prediction which better suites the Corporate Organizations of Pakistan.
There is also very less amount of work done in this field in Pakistan. So, this research may be considered an important footstep to fill this need in Pakistan. The investors, Government Agencies, State Bank of Pakistan (SBP) and Securities and Exchange Commission of Pakistan (SECP) will find this study beneficial.
In quantitative analysis different models can be found like Univariate, Discriminant Analysis (MDA), Logistic Regression, Probit and Linear Probability. Rashid and Abbas (2011) pointed out that four statistical methods have been used for bankruptcy prediction. These are Discriminant Analysis (DA), Logistic Regression, Probit and Linear Probability models. However, Altman and Saunders (1998) found that Multiple Discriminant Analysis (MDA) is the dominant technique among all other four models. Aziz and Dar (2006) also found Discriminant Analysis (MDA) as the leading model among all other statistical methods. They have also concluded that Logistic Regression model stands second to Multiple Discriminant Analysis (MDA). Therefore, we are using these two dominant models which are Logistic Regression (Logit) model and Discriminant Analysis (MDA) to check the accuracy and predictive ability of these two models together in the non-financial sector of Pakistan.
Altman (1968) was the first one who had used Multiple Discriminant Analysis (MDA) and Z-Score is commonly employed in all parts of the world. Ohlson (1980) model commonly known as O-Score model using logistic regression is also stand second to Multiple Discriminant Analysis (MDA). The following three broad questions will be answered in this study:-
A. How can we predict bankruptcy of non-financial sector of Pakistan?
B. How to determine the significant contributing variables which help us towards bankruptcy prediction of non-financial sector of Pakistan?
C. Which model will have the higher predictive ability to predict bankruptcy of non-financial sector of Pakistan?
1.6 Bankruptcy Definition used in the Study
It is commonly observed that there is no one specific model used in any part of the world for bankruptcy prediction. Same is the case related with the definition of bankruptcy. Each country has its own law or code prevalent in their country and which totally differs from the definition used in different parts of the world. In Pakistan, the company is said to be bankrupt if:-
A. It is delisted from Karachi Stock Exchange which may be because of its Winding up / Liquidation through Court Order which is a Violation of the Listing Regulation of Karachi Stock Exchange having No. 32 (1) (d).
B. Winding up by SECP (Rashid and Abbas, 2011). LITERATURE REVIEW
Default is commonly word used in previous literature. Default means when companies are unable to make their required payments when these fall due. According to the guidelines of Beaver (1966), failure may be defined as “the inability of a company to pay its financial obligations as they mature”
The usage of financial data and accounting figures for analyzing company’s performance traces back almost a century ago. Accounting and Finance literature contains a huge amount of research related to bankruptcy prediction. Perhaps, the use of accounting data for measuring the credit situation of the company was used in 1908. The main purpose of the research was whether to extend loan to that company and what would be their ability to pay back the loan. Gross profit rate, dividends, bad debts and quick assets to liabilities ratio was used in that study (Rosendale, 1908). Afterwards, Fitzpatrick (1932) was, perhaps, the first one who uses ratio analysis to discriminate between bankrupt and non-bankrupt companies but his model did not show any significant results (Pongsatat et al., 2006).
It is evident that Asian companies because of the subject companies high leverage or investments in plant and property lead them to bankruptcy (Bongini et al., 2002). The common causes of failure are poor management, overtrading , deficient accounting data, high debentures, economic change, social, political and technological and symptoms of failure includes a decrease in the quality and the service, employees low morale, growing amount of user complaints, tight credit policy, consistent crash to attain targets, declining market share, and the over drafting (Argenti, 1976).
2.1 Different Types of Models used in Bankruptcy Prediction.
A Comprehensive review of prior studies states that collapse research may be broadly categorized in three terms:- a) Statistical Methods b) Artificial Intelligence Expert Models (AIES) c) Theoretical Methods.
2.1.1 Statistical Methods.
Statistical Methods have a focus on the symptoms of failure and information is mostly taken from Company’s Financial Statements. These models may be univariate and multivariate in nature and pursue classical standard modeling procedures. Aziz and Dar (2006) pointed out that statistical methods include Univariate (Morris, 1998; Altman, 1993 ), Discriminant Analysis (MDA) (Altman, 1993; Kletch, 1981; Morris, 1998), Linear Probability
Method (Morris, 1998; Gujarati, 1998; Theodossiou, 1991; Maddala, 1983), Logistic Regression Model (Morris, 1998; Gujarati, 1998; Theodossiou, 1991; Maddala, 1983), Probit Model (Morris, 1998; Gujarati, 1998; Theodossiou, 1991; Maddala, 1983), Cumulative Sums (CUSUM) (Kahya and Theodossiou, 1999; Healy, 1987; Page, 1954) and Partial Adjustment Processes (Gujarati, 1998; Laitinen and Laitinen, 1998).
2.1.1.1 Univariate Analysis
Beaver (1966) used univariate model for predicting bankruptcy. Univariate model is used for interpreting the company’s financial statements data with the assistance of financial ratios (Aziz and Dar, 2006). His study has compared a matched pair of failed and non-failed companies with the help of ratio analysis (Altman, 1968). He is of the view that the ratio analysis may be used for failure prediction upto five (5) years before default. Beaver (1966) pointed out that ratios of bankrupt companies differ significantly than ratios of non-bankrupt companies. 2.1.1.2 Linear Probability Model
Linear probability model tells us the probability of success or failure of a company as dichotomous / dummy dependent variable, considered as linear function (role) of vector (point) of the explanatory variables (Aziz and Dar, 2006). This model looks a linear regression model but the regress is binary or dichotomous, it is said a linear probability model. There are several problems related with linear probability model, which are Disturbances Non-Normality ui, Disturbances Heteroscedastic Variances, Nonfulfillment of 0 ≤ E(Yi | X) ≤ 1, Questionable assessment of R2, a Measure of Goodness of Fit (Gujarati, 1998).
2.1.1.3 Discriminant Analysis (MDA)
This is the method used to distinguish between two and /or more groups with regard to numerous variables (Aziz and Dar, 2006). Discriminant Analysis (MDA) is used for making predictions when the dependent (reliant) variable is in qualitative category e.g. Failed or Non-Failed (Altman, 1968). Z-Score is still considered to be one of the best models employed in bankruptcy prediction. The model takes the form as:-
Z = β1X1 + β2X2 + β3X3+ ….. βnXn Where
Z is the overall score and dependent variable. β1, β2, β3, βn are co-efficients. X1, X2, X3, Xn are independent variables which are different ratios will be used in this study. As the figure of Z-Score decreases, the company’s probability of bankruptcy increases and vice-versa (Rashid and Abbas, 2011).
Multiple Discriminant Analysis (MDA) was first utilized in 1930. At the start, Discriminant Analysis (MDA) was used for biological and behavioral sciences (Altman, 1968). Discriminant Analysis (MDA) has also been applied to predict high and low Price / Earnings ratio (P/E ratio) of companies. (Walter, 1959). Discriminant Analysis (MDA) may be employed to classify two or more groups.
Altman (1968) was the first one who had used Multiple Discriminant Analysis (MDA) for bankruptcy prediction. He had extended the work of Beaver (1966) who had used Univariate analysis. He had employed twenty two (22) ratios which have been extensively used in literature. He concluded that five (5) ratios are significant at differentiating between failed and non-failed companies. He found that rations ratios which were not contributing significantly now become significant when become the part of the function used by Altman (1968). Predictive ability and predictive accuracy of Altman’s model were 95% and 94% respectively. Afterwards, there exist a number of extensions of Discriminant Analysis (MDA) model.
Izan (1984) used a linear discriminant analysis for one industrial sector to predict the corporate distress in Australia which may be extended to other industrial sectors and to other economies as well along with Australian environment. Altman and Eom (1995) developed two paired models for South Korean companies. One model was for Non-Public companies and the other model was for Private and Public companies. The measure of solvency, sales to assets, size and leverage were discussed. Both models showed outstanding classification accuracies two years prior to bankruptcy. Altman et al., (1977) evolved a model named ZETA which showed improved accuracy over the previous classification models used for bankruptcy prediction. The model developed in that study showed a classification accuracy of 96% one year before bankruptcy and 70% classification accuracy of five years before bankruptcy. In that study, different other elements were also used like the use of linear vs. quadratic analysis and comparison of ZETA model with other bankruptcy models.
Charitou et al., (2004) pointed out that although the aforesaid studies have provided the high classification accuracies with the usage of Discriminant Analysis (MDA) model, this Discriminant Analysis (MDA) is also criticized because it is based on certain assumptions which hare frequently violated in bankruptcy prediction. These are a) Independent (Exploratory) variables need to be in the form of multivariate normality and b) Two groups co-variance matrices (bankrupt and non-bankrupt) are equivalent.
It is said that classification of companies by Multiple Discriminant Analysis (MDA) is dependent on the data used in the study and there is problem arises when the data deviates from multivariate normality. When we use the dummy independent variable, the assumption of multivariable normality is violated. We can overcome this problem by eliminating the outliers and by using transformations e.g log, square root of variables. The other assumption is the one that two groups covariance matrices are equivalent. We may overcome this problem by using quadratic discriminant analysis (Richardson and Davidson, 1983). Hamer, (1983) and Altman et al., (1977)
pointed out that the classification accuracy will not improve in all cases when we improve the statistical quality of the model.
Hamer (1983) had employed the variable sets used by Ohlson (1980), Deakin (1972), Altman (1968), Blum (1974). He had used Linear Discriminant Model (LDA), Quadratic Discriminant Model (QDA) and logistic Regression (Logit) model for four sets of variables for five years prior bankruptcy. His study concluded that existing sets or variables and statistical models are likely to predict default upto three (3) years before the actual default happens.
2.1.1.4 Logistic Regression Model
Ohlson (1980) developed a model using Multiple Logitstic Regression (Logit) for bankruptcy prediction. Logistic Regression (Logit) model shows the probability / Chance of failure of a company as a dichotomous / dummy dependent variable considered as a function (role) of vector (point) of an explanatory variables (Aziz and Dar, 2006). Logistic Regression model fits the linear logit method for binary (paired) response data used by the system of the maximum likelihood. Likewise, Multiple Discriminant Analysis (MDA) this model also assigns weights to the independent (exploratory) variables and then provides a Z-Score (Cut off Score) in the shape of probability of failure of the company presents in the sample. Both Discriminant Analysis (MDA) and Logistic Regression (Logit) model employ different assumptions related to their relationship between the independent variables. Here, it is necessary to point out that logistic Regression (logit) model employs logistic cumulative (aggregate) probability function (role) in predicting failure whereas Multiple Discriminant Analysis (MDA) method is dependent on the linear combination (arrangement) of independent (exploratory) variables (Bandyopadhyay, 2006). Logistic Regression model takes the form as:-
Ohlson (1980) utilized logistic Regression (Logit) method and replaced Multiple Discriminant Analysis (MDA), the widely used model at that time. He had found the significant factors namely size, liquidity, performance and financial structure which affect the probability of failure. He had also stated that there are certain assumption which needs to be fulfilled in case of Multiple Discriminant Analysis (MDA) and to avoid this, he had applied conditional logit model. He had concluded that predictive power of the model depends when the data was made available and the other thing was that the prediction strength of a linear transforms of vector of ratios is robust across estimating large sample.
Peel et al., (1986) developed a model using financial ratios and new variables which are not taken from Profit and Loss accounts and Balance Sheet items for UK Corporate sector. They argued the model predictive ability enhances with the usage of new variables used in this study.
Keasey and Watson (1987) developed three models. These were financial ratios, non-financial data and combination of non-financial data and financial ratios. Financial ratios used in this study covered the aspects of performance like liquidity, profitability and gearing. Non-Financial Information includes age of the company, Number of current directors, New share capital, Appointment and removal of directors over the period of three years, Change in auditors over the period of three years. The results showed there is marginally better failure prediction of small company may be achieved using the non-financial information. It also pointed out that this should not be employed to large company’s failure prediction on the footings of the results showed in small company’s failure predictions.
Previous literature confirms that cash flow information is useful for predicting financially distressed companies. Ward (1994) pointed out that cash flow variables are beneficial in predicting financially distressed firms in oil, mining and gas sector and concludes, cash flow is more useful in mining, oil and gas sector as compared to other sectors. Cash flow data over variables employed in this study are Cash flow from investing, operating and financing activities.
Tennyson et al., (1990) study was planned to check the value of the data available in the narrative disclosures in the financial distress by using logistic Regression model. For this purpose, Management narrative disclosures, Prediction of financial distress and Content analysis is used. The study concluded that the narrative scores and financial ratios could be used together as compared to using information in narratives and information contained in financial ratios individually. This study also pointed out that information in the narratives is different from information contained in financial ratios.
Keasey et al., (1990) extends the work of Peel and Peel (1988) and used logistic analysis and Multilogit analysis. The study results show that the classification ability of multilogit model is better than logistic analysis for healthy firms and classification ability of multilogit and logistic Regression model are comparable for failing companies one year before bankruptcy.
2.1.1.5 Combination of Discriminant Analysis (MDA) and Logistic Regression
Altman Z-Score model and Ohlson O-Score model developed by the Altman (1968) using Discriminant Analysis (MDA) and the Ohlson (1980) using Logistic Regression are frequently applied by various researchers in different parts of the world. There are numerous studies which have employed these models individually and collectively as well. Pongsatat et al., (2004) has examined the prediction ability of Altman and Ohlson methods of small and large companies of Thailand. The authors reach to the conclusion that the prediction accuracy up to three years (3) before bankruptcy is higher for Ohlson’s model as compared to Altman’s model with an overall prediction accuracy of 70% for large non bankrupt asset companies. However, the predictive accuracy up to three years prior bankruptcy is higher for Altman’s model as compared to Ohlson’s model for bankrupt large asset companies. Bandyopadhyay (2006) has used the combination of logistic Regression and Z-Score and developed a model to predict default in Indian firms. The model developed in the study has high classification rate of 91% but also have a predictive power and it may correctly classify 92% of the failed companies and 96% of non-failed companies. Ugurlu and Aksoy (2006) also developed a model using Ohlson (1980) and Altman (1968) techniques for predicting bankruptcy of Turkish firms. It is evident from the results that logit model shows better results and gives classification rate of 95.6%. This means that the technique classifies 97.5% of non-bankrupt companies and 91.4% of failed companies.
2.1.1.6 Probit Model
In case of probit model which is a type of regression and in this model the dependent variable can take two values only like failed and non-failed. The name is derived from Probability + Unit. Developed by Chester Bliss in 1934 which is a fast model used for the maximum likelihood and was planned by Ronald Fisher which is an appendix to Bliss work in 1935.
Normal cumulative (aggregate) distribution function (role) may be substituted in the place of logit or logistic regression into P = 1/1+e and we may take the probit model which is predicted by Maximum Likelihood model. The other interpretations are same as used for logistic Regression model (Aziz and Dar, 2006). We will use a Cumulative distribution function to explain the behavior of a dichotomous dependent variable. The model that came from normal cumulative distribution function is called probit model, sometimes it is called normit model (Gujarati, 1998). We may compare the model by a) calculating the sum of squared deviations from predicted probabilities b) compare the percentages correctly predicted and c) looking at the derivates of the probabilities with respect to a particular independent variable (Maddala, 1983).
2.1.1.7 (CUSUM) Cumulative Sums Procedure
(CUSUM) Cummulative Sums are considered amongst the most influential tools used for checking a shift (change) from a bad quality distribution (BQD) to a good quality distribution (Aziz and Dar, 2006). Cumulative Sums (CUSUM) procedures are a sequential analysis technique which is developed by E.S. Page used for monitoring change detection. Page (1954) used a “quality number” Ɵ through which he means a parameter of the probability distribution. Kahya and Theodossiou (1999) developed financial distress model by using Cumulative Sums (CUSUM). The study shows that Cumulative Sums (CUSUM) outperforms other statistical models of Discriminant Analysis (MDA) and the Logistic Regression. Here, we may say that the model devised also has the power to differentiate between changes in the financial distress and changes in financial variables which are a results of the permanent shifts in the mean structure of the variables and result of serial correlation respectively. 2.1.1.8 Partial Adjustment Processes
The rationalization of Koyck model is adaptive expectation model. Other rationalization given by Marc Nerlove in partial adjustment or stock adjustement model (Gujarati, 1998). Laitinen and Laitinen (1998) pointed out that cash management means management of the cash when it enters the firm uptil it leaves the firm as a payment made to someone. If there is imbalance between cash outflows and cash inflows, it may be called failure of cash management and when this type of situation arises it leads the firm towards failure as the failure of the firm to make payment when it’s due.
2.1.2 Artificial Intelligence Expert System (AIES) Models
Computers are normally said to be intelligent and the intelligence of computers is contained in machines whereas the intelligence of human beings is in their brains. Therefore, the intelligence of computers is called “Artificial Intelligence”.
Human beings apply their intelligence for solving problems. They apply their reasoning which is based on knowledge which is lying in their brains. In this manner, knowledge plays a main role (task) in the human intelligence. Expert systems are developed in which Artificial Intelligence plays a same role which is played by Human Intelligence.
Artificially Intelligent Expert System (AIES) models are usually multivariate in nature and information is drawn from company’s financial statements. These are the result of informational development and technological advancements and heavily dependent on computer technology. These models have a focus on symptoms of failure. Artificial Intelligence Expert System Models (AIES) include Recursively Partitioned
Decision Trees (Pompe and Feelders, 1997; Friedman, 1977), (CBR) Case Based Reasoning (Kolodner, 1993), Neural Networks (NN) (Yang et al., 1999; Coats and Fant, 1993; Salchenberger et al., 1992), Genetic Algorithms (GA) (Varello, 1998; Shin and Lee, 2002) and Rough Sets Model (Ziarko, 1993; Pawlak, 1982; Dimitras et al., 1999).
2.1.2.1 Recursively Partitioned Trees / Inductive Learning Method
Machine learning which is normally supervised. Inductive learning is a type of the supervised learning. To learn from examples by way of inductive learning may be done through inductive learning program. A decision tree partitions the training data into the sub-classes (Aziz and Dar, 2006).
Recursively Partitioning Decision Tree rule was first introduced for non-parametric classification by Friedman (1977). Pompe and Feelders (1997) also pointed out that “the basic idea of recursive partitioning is to fit a tree to the training sample by successively splitting it into increasingly homogeneous subsets until the leaf nodes contain only cases from a single class or some other reasonable stopping criterion applies”
When we are going to classify the distress situation, we construct recursively partitioned decision trees training samples uptil the final (last) nodes of the tree contain companies of one type which are healthy or distressed (Aziz and Dar, 2006).
2.1.2.2 Case Based Reasoning Model
With the help of case based reasoning model, new classification problem is solved by formerly solved cases belongs to the same area. In case of distress prediction, a Case Based Reasoning Model first develops the case library of the previously solved problems. Afterwards, it recognizes, accept and characterize the new problem (trouble) of prediction. Then, it will adapt a similar case which is retrieved from the case library which means to fit a new problem and then provide prediction result. A case based reasoning model will evaluate the result of the prediction before going to store the solution in the case library (Aziz and Dar, 2006).
2.1.2.3 Neural Networks
Computers although are capable of beating human brains but when it comes to identify signs of financial distress in a company, computers become inferior to human brains. Neural Networks will perform the classification task by giving signals of the financial health of a company (Aziz and Dar, 2006).
Neural Network is basically the collection of neurons called computational elements which are interconnected. There are three (3) layers of the neurons a) Input b) Hidden c) Output Layers. Neural Network takes the information on Independent (explanatory) variables at the input nodes which are via the input layer. The (hidden) layer nodes, which are connected to the input nodes by weighted interconnections and collect, then process information suggesting a probability / chance of a company whether it is getting failed or succeeded (Aziz and Dar, 2006).
Laitinen and Kankaanpaa (1999) clarified that Neural Networks has been used in predicting failure from the start of 1990’s and the results of Neural Networks are excellent.
2.1.2.4 Genetic Algorithms
Genetic Algorithms are the one which belong to larger class of the evolutionary algorithms and which gives solution to the optimization problems by using the techniques evolved by natural evolution. Solutions in genetic algorithms are represented in binary strings of 0 and 1. However, there are other encodings also possible. When we need to solved the classification problem. Researchers have extracted a set of conditions or rules by using genetic algorithms. These rules are normally associated with the certain cutoff areas / points. By these rules or conditions, the method / model will predict whether the company is going to be bankrupt or not (Aziz and Dar, 2006).
2.1.2.5 Rough Set Models
Rough Set first used by Zdzisław I. Pawlak who was a Polish computer scientist and Rough Set is the formal estimation of a conventional set i.e. crisp set which is the pair of sets giving the upper and lower approximation of the original set. Pawlak (1991) used the upper and lower approximation set as the crisp sets which is in its standard edition of the rough set model / theory. However in other areas, the approximating set may called the fuzzy sets. The basic theory of rough sets is normally referred to as “Pawlak Rough Sets” or “Classical Rough Sets”.
When we are going to apply rough sets in predicting financial distress, the model collects and presents the available information in an information table of the companies which needs to be classified as distressed or not (Aziz and Dar, 2006).
2.1.3 Theoretical Models
Theoretical models have a focus on causes of failure. These are mutivariate in nature and theoretic arguments are used to construct prediction models. These models usually employ statistical technique for providing the quantitative strength to the theoretically argument (Aziz and Dar, 2006). Theoretical Models include Balance Sheet Decomposition Measures (BSDM) (Lev, 1973; Theil, 1969; Booth, 1983), Gambler’s Ruin Theory (Morris, 1998; Scott, 1981), Cash Management Theory (Laitinen and Laitinen, 1998; Aziz et al., 1988) and Credit Risk Theories (Merton, 1973; Black and Scholes, 1973).
2.1.3.1 Entropy Theory / Balance Sheet Decomposition Measures
Entropy Theory or Balance Sheet Decomposition Measures relates to changes occurring in the firm’s balance sheet. If the firm’s balance sheet shows the significant / major changes in the balance sheet in liabilities and assets over the year, then these changes gives us indication that there are chances of financial distress (Aziz and Dar, 2006). Balance Sheet Decomposition Measures or Entropy Theory uses the Univariate analysis and the Discriminant Analysis (MDA) to identify changes in Balance Sheet.
2.1.3.2 Gambler Ruin Theory
This was developed by Feller in 1968 on the probability that a gambler by chance wins or loses money. The gambler starts an amount of cash he has where wining a dollar has the probability (p) and losing dollar is probability (1-p) in every game. The game continuous until the person / gambler runs out of money (Espen, 1999).
As the name indicates, this theory relates with gambler who will play the game with the probability of gain or loss. Game will be continued until he /she losses all his / her money. This theory will talk about during of the game and gambler’s ruin (Aziz and Dar, 2006).
When the net-worth of a company goes to zero, the company went bankrupt. In any period, company will either have positive or negative cash flow. When the company has negative cash flow, it would lead towards bankruptcy. So, in this approach, the company will be solvent if its net-worth is more than zero (Aziz and Dar, 2006).
2.1.3.3 Cash Management Theory
Cash Management is very important function of every company. Short term cash management is also very important part of cash management and for this purpose, companies made their cash flow statements. Sometimes, there is positive imbalance when cash inflows exceed cash outflows like realization of debtors and cash sales and sometimes there is negative imbalance when cash outflows exceed cash inflows like payment for taxes and dividends (Pandey, 2005).
If there is negative imbalance between cash inflows and cash outflows and if this imbalance persists then there are chances of financial distress which may lead towards bankruptcy (Aziz and Dar, 2006).
2.1.3.4 Credit Risk Theory
There are different types of risk which the financial institutions have to cope up with. These are Exchange rate risk, Market risk, Interest Rate Risk, Operational Risk, Credit Risk, Country Risk and Concentration Risk. According to Westguard and Wijst (2001), it is the default risk of the borrower. Basel II framework having three pillars namely Minimum Capital Requirement followed by Supervisory Review and then Effective usage of public disclosure mainly focuses on Operational Risk, Credit Risk and Market Risk (Aziz and Dar, 2006). Following the guidelines in Basel II, following internal assessment models have been developed i.e. McKinsey’s Credit Portfolio View, JP Morgan Credit Metrics, CSFP’s Credit Risk+ and Moody KMV model. We may call these models as Credit Risk Theories. These models have been based on micro or macro-economic theories of corporate finance. The famous micro-economic theory is the Black and Scholes (1973) Option Pricing which was further developed by the Merton (1974). Wilson (1997a, 1997b, 1998) theory related to credit risk portfolio measurement is an example of macro-economic theory. According to this theory, a damaging economy will be attracting more downgrades and therefore defaults increase. So, failure probability is function (utility) of macro-economic factors like Un-employment rate, Interest rate and Growth rate etc.
2.2Different Types of Ratios in Prediction of Bankruptcy.
In Bankruptcy prediction, there are different types of ratios used. These are classified as profitability ratios, liquidity ratios followed by leverage or gearing ratios, activity or efficiency ratios and cash flow ratios.
2.2.1 Profitability Ratios
Profitability ratios tell us about the financial performance of the company. Profitable companies are normally considered healthy companies. If there are non-profitable companies having net losses over the year, then these companies are most likely to suffer from financial distress which may lead them towards bankruptcy (Gu, 2002). Altman (1968) pointed out that a company whose profitability is not good is going to be bankrupt. Courtis (1978) divided profitability into profit margin, return on investment and capital turnover. These are the ratios which have been found useful in previous predictive studies. Charitou et al., used different set of ratios like Financial leverage ratios, Cash flow from Operations ratios, Profitability ratios, Liquidity ratios, Activity ratios and Market ratios. Ugurlu and Aksoy, (2006) grouped the variables of their study into eight different areas namely Profitability, economic distress degrees, efficiency, liquidity, leverage, variability, solvency and size. Altman (1968) used two variables namely EBIT over Total Assets and the second one Retained earnings over Total assets which are associated with the profitability. He is of the view that when the company’s earning power of assets which is EBIT / Total assets decreases, there are more chances of firm suffering from financial pressure which may lead the company towards bankruptcy. On the other hand, the other variable which is Retained earnings / Total assets used by Altman tells us that there are more chances of financial distress with the newly
operated company as compared to other operating company. Laitinen and Kankaanpaa (1999) pointed out that low profitability may be linked with bankruptcy. They had used Operating Income over Total Assets for measuring the profitability position of a company.
Keeping in view the previous research, we have chosen eleven ratios which are used for measuring the profitability of the firms of non-financial sector of Pakistan. Based on the research made in this context and variables used in the previous literature, we may safely develop a hypothesis
The higher will be the profitability ratios; the lower will be the probability of default / bankruptcy. 2.2.2 Liquidity Ratios
Liquidity ratios tell us about the capacity of the company to pay the short term debt obligations. Companies which have the capacity to pay short term debt obligations are viewed as healthy companies. If the company’s liquid assets are lower if compared to the short term liabilities, then the said company have more chances of financial distress which may lead towards bankruptcy and if the company has high liquid assets as compared with its short term liabilities, then the said company has less chances of financial distress and bankruptcy (Beaver, 1966). Altman (1968) used a variable Working capital / Total assets for liquidity. We had found that Working capital divided by Total assets is most useful as compared to Current and quick ratios which are used for measuring the liquidity position of the company. Laitinen and Kankaanpaa (1999) explained that bankruptcy may be connected with decreased liquidity. He has identified Cash / Current liabilities for measuring the liquidity position of a company. Charitou et al., (2004) found nine different variables for measuring liquidity. Hamer (1983) used four variable sets for the period 1966-1975 that were used by Ohlson (1980), Deakin (1972), Altman (1968) and Blum (1974). He had measured the liquidity by ten different variables used by Ohlson (1980), Deakin (1972), Altman (1968) and Blum (1974). Ugurlu and Aksoy (2006) found Sales to Net WC (Working capital) significant which is a gauge of liquidity.
Keeping in view the variables used in past research, we have selected seven proxies for measuring the liquidity position of the company. Based on the previous research and variables used in past literature, we have developed a hypothesis
The higher will be the liquidity ratios; the lower will be the probability of default / bankruptcy. 2.2.3 Leverage or Gearing Ratios
Leverage or Gearing ratios inform us regarding the financial mix of a company. These are used to assess the ability of the company to pay its short and the long money owing obligations. There are many causes of bankruptcy and one major cause is high debentures that lead towards bankruptcy (Argenti, 1976). Altman (1968) used the variable (Market Value) Equity to (Book Value) Debt, the reciprocal of which is Debt / Equity often used as a measure of leverage. The ratio used by Altman tells us that how much the company assets are declined as compared to its debt and when the total liabilities are greater than its assets, the company faces financial crunch and lead towards bankruptcy. Laitinen and Kankaanpaa (1999) pointed out that high leverage may be connected with bankruptcy. He had used Total debt over Total assets for measuring the leverage position of a company. Charitou et al., (2004) found six different variables significant for measuring leverage. Ugurlu and Aksoy (2006) pointed out that leverage and size are positively related and there are possibilities that a company will opt for growth strategies and go for high leverage without keeping in mind its profitability positions which may lead that company towards bankruptcy. Hamer (1983) used seven different ratios to measure the leverage of a company. The variables are derived from Ohlson (1980), Deakin (1972), Altman (1968) and Blum (1974) models. Altman and Eom (1995) selected the variables which reflect the size, asset turnover, leverage and retained earnings by using a sample of 34 distressed companies of Korea for the year 1990-1993 matched by industry and year.
Keeping in view the previous research, five ratios are selected which we have used as a proxy for measuring the leverage of the companies of non-financial sector of Pakistan. Based on the research and variables in the past literature, we may safely develop a hypothesis
The higher will be the leverage ratios; the higher will be the probability of default / bankruptcy. 2.2.4 Activity or Efficiency Ratios
Activity or Efficiency ratios tell us about the operating performance of the various segments. These ratios are used to gauge the effectiveness and efficiency of the company in utilizing the available resources. If the company is utilizing its resources efficiently then that company will lead towards profitability and therefore less chances of financial distress and bankruptcy prevails (Eljelly et al., 2001). Charitou et al ., (2004) found seven different ratios significant for measuring the efficiency of the company. Hamer (1983) used the variables of Altman (1968) and Deakin (1972) for measuring the efficiency of a company. Ugurlu and Aksoy (2006) found Sales / Current assets significant which is a measure of efficiency. They also pointed out that failed companies have less asset turnover as compared to non-failed companies.
Keeping in view the variables used in past research, we have selected three different ratios for measuring efficiency of the company in utilizing its resources. Based on the previous research and variables used in past literature, we have developed a hypothesis
The higher will be the efficiency ratio; the lower will be the probability of default / bankruptcy. 2.2.4 Cash flow Ratios
Cash flow ratios are used to check whether there is enough cash available with the firm to pay the short term debt obligations. If the company has no cash available, then there are more chances of financial distress and bankruptcy. Charitou et al., (2004) found six different variables of operating cash flow significant / important for measuring the position of cash flow of a company. Ward (2011) found that cash flows are beneficial for predicting corporate financial distress of oil, mining and gas companies as compared to other companies. He had used the variables of Cash flow derived from the Operating, investing and the financing activities.
Keeping in view the previous literature, we have selected five different ratios used as a proxy to check the cash flow of the company. Based on the research made in this context and variables used in the previous literature, we may safely develop a hypothesis
The higher will be the cash flow ratios; the lower will be probability of default / bankruptcy. METHODOLOGY
3.1 Research Design
This study has applied Discriminant Analysis (MDA) and Logistic Regression (Logit) methods for predicting financial distress of non-financial sector of Pakistan. The research design in this research was a descriptive study. Cooper and Schindler (2001) pointed out that a study which is structured with clear stated investigative objective is a descriptive study. Keige (1991); Chong (1998); Kogi (2003); Muchira (2007) and Metho (2007) had applied the same design in their research for predicting financial distress among different companies. Trochim and Land (1982) pointed out that research design is like a glue which holds the research study together.
3.2 Target Population
Population is considered a set of people (well defined), elements, services and events or even households who are going to be investigated (Mugenda and Mugenda, 1999). The population in this study is the companies listed as well as delisted by the Karachi Stock Exchange (KSE). The delisting may be due to the winding up / liquidation by the Court Order which is the violation of the Karachi Stock Exchange (KSE) listing regulation 32(1) (d) and / or liquidation / winding up by Securities & Exchange Commission of Pakistan (SECP) (Rashid and Abbas, 2011). The period selected in this study 1996-2012 is long enough to predict corporate financial distress by using different variables.
3.3 Sampling Procedure
The sample consists of 35 bankrupt and 35 non bankrupt companies. We have used Stratified Random Sampling in this study and here each bankrupt company will be matched with the non-failed company of same industry and of same size. The selection of sample criteria was a) the company belongs to non-financial sector of Pakistan b) must have at least financial information of the year i.e. 1996-2012 c) must have a matched sample of the company in the same industry and of same size.
3.4 Data Collection
The data is collected through secondary sources. The data was obtained from company’s financial statements, different websites, Karachi Stock Exchange (KSE) website and from various issues by (SBP) State Bank of Pakistan named “Balance Sheet Analysis of Joint Stock Companies Listed on Karachi Stock Exchange (KSE)” for the time period 1996-2012.
3.5 Variables Used
The previous research gives us the large number of variables which have been used (Beaver, 1966). Ohlson, 1980, Altman, 1968). This study employs financial ratios in large number which have been extensively used in the previous studies to predict bankruptcy. In this study, we have classified these predictors of bankruptcy into five main categories namely Profitability, Liquidity, Leverage, Activity and Cash flow ratios. We have also added the predictor of size as well in this study.
3.6 Data Analysis
It is the process of providing structure, order and interpretation of the data collected (Marshall and Rossman, 1999). Data is organized systematically to facilitate analysis. Data analysis consist different steps like collected data preparation, its coding, editing and then cleaning of data for making it ready to be used by different statistical tools like SPSS. We have used SPSS because it covers a wide range of common graphical and statistical data analysis and it is also systematic.
3.7 Different Analytical Models
Rashid and Abbas (2011) pointed out that four statistical methods have been employed for bankruptcy prediction. These consists of Discriminant Analysis (MDA), Logistic Regression, Probit and Linear Probability models. However, Altman and Saunders (1998) found that Multiple Discriminant Analysis (MDA) is the dominant technique among all other four models. It is established that Multiple Discriminant Analysis (MDA) is the leading model among all other statistical methods which are Univariate, Discriminant Analysis (MDA), Logistic Regression, Probit, Linear Probability model, Cummulative Sums (CUSUM) and Partial Adjustment Processes (Aziz and Dar, 2006). They have also concluded that Logistic Regression model stands second to Multiple Discriminant Analysis (MDA). Therefore, we are going to check the accuracy and predictive ability of Discriminant Analysis (MDA) followed by Logistic Regression (Logit) model together in Pakistan.
3.7.1 Discriminant Analysis (MDA) Approach
Discriminant Analysis (MDA) is the weighted linear mixture of discriminating variables. This model is the extension of regression where the dependent variable at categorical level and the independent / exploratory variables are scale data. Discriminant Analysis (MDA) is used to predict an outcome like multiple linear regression. In case of linear regression analysis, dependent variable which is interval variable at Y axis. So the mixture of predictors produce estimated mean population numerical Y values for given values of weighted combinations of X values. However, there are many variables which are categorical like making profit or not, employed or unemployed and whether an individual is a credit risk or not etc.
The discriminant analysis (DA) is a method used to distinguish two and / or more groups with regard to numerous variables (Aziz and Dar, 2006). Discriminant Analysis (MDA) is a method used for making predictions when dependent variable is in qualitative shape e.g. Failed or Non-Failed (Altman, 1968). Z-Score is still considered to be one of the best models employed in bankruptcy prediction. The model takes the form as:-
Z = β1X1 + β2X2 + β3X3+ ….. βnXn Where
Z is the overall score and dependent variable. β1, β2, β3, βn are co-efficients. X1, X2, X3, Xn are independent variables which are different ratios will be used in this study. As the value of Z-Score decreases, the companies’s probability of bankruptcy increases and vice-versa (Rashid and Abbas, 2011).
We want from this function to give us an equation which has excellent discriminatory power to distinguish between groups. From two (2) group discriminant analysis (DA), there will be only one function because there is one less discriminant function than the number of groups.
3.7.2 Logistic Regression Model Approach
When the dependent variables are categorical and dichotomous, linear regression cannot deal with it and it is the major limitation of linear regression. Dichotomous variables are like an employee may be promoted or not, a student may pass or fail and consumer may buy or not buy. There are methods that have been built for dealing with dependent variables when they are in categorical shape including Discriminant Analysis (MDA) which is followed by logistic regression (Logit).
Ohlson (1980) developed a model using Multiple Logistic Regression (Logit) for bankruptcy prediction. In case of two (2) categories (groups) of dependent (reliant) variable, we use Logistic regression (Logit). If there is mix of categorical and numerical independent variables, we use Logistic Regression. The reason for using Logistic regression (Logit) is that it has the procedure for automatically generating the variables (dummy), fewer assumptions, more robust statistically. In cases where independent / exploratory variables are the categorical ones, or there is a mixture of categorical and continuous and dependent (reliant) variable is categorical, the usage of logistic regression (logit) is compulsory.
Logistic Regression (logit) model shows the probability / chance of failure of a company as dichotomous (dummy) dependent variable, a function of vector of explanatory variables (Aziz and Dar, 2006). In Logistic regression (Logit), there are only two values to predict a) Probability (p) is 1 rather than 0 because it uses binomial probability. Logistic regression (Logit) forms a finest fitting equation by using maximum likelihood method, increases the probability / chance of putting the observed data into the most appropriate category by giving the regression co-efficient.
Logistic regression (Logit) provides a co-efficient ‘b’, which measures every independent variables partial involvement to the variations in dependent variable. We have a goal of predicting correct category of outcome and to achieve this goal, we have developed a model which includes the useful variables for predicting response variable. Logistic Regression model fits the linear logistic regression (logit) model for binary data by method of maximum likelihood. Likewise, Multiple Discriminant Analysis (MDA) this model also assigns weights to independent variables and then assigns a Z-Score in the form of chance / probability of failure of the company presents in the sample. Both Discriminant Analysis (MDA) and Logistic Regression (Logit) model have dissimilar assumptions related to their relationship between the independent variables. Here, it is necessary to point out that logistic Regresion (Logit) model employs logistic cumulative (aggregate) probability / chance function in predicting failure whereas Multiple Discriminant Analysis (MDA) depends on the linear arrangement
of the independent variables (Bandyopadhyay, 2006). Logistic Regression model takes the form as:-
3.7.2.4 Model Fit and the Likelihood Function
Logistic Regression, maximum likelihood method is used instead of least squared deviations used in linear regression. Likelihood just means probability. It always means probability under a specified hypothesis.
In logistic regression, two hypotheses are of interest:-
a) The null hypotheses, when all the coefficients in the regression equation take the value zero.
b) The alternative hypotheses that the model differs significantly from the null of zero and predictors under consideration is accurate.
The result is usually a small number and we use natural logarithm by producing a log likelihood (LL). Probabilities are always less than 1, so log likelihoods (LL’s) are always negative. Log Likelihood (LL) is the basis for tests of a logistic model. The likelihood ratio test is based on -2LL ratio. This tests the difference between -2LL for the full model with predictors and -2LL for initial chi-square in the null model. When probability fails to reach 5% significance level, we retain the null hypotheses that knowing the Independent variables has no increased effects in predicting the dependent variable.
3.7.2.5 Advantages of Logistic Regression Model over Multiple Discriminant Analysis (MDA)
As pointed out by Ohlson (1980) and Mensah (1984), following are the advantages of using Logistic Regression model over Multiple Discriminant Analysis (MDA):-
a) No assumption needs to be made regarding prior probabilities of failure and the distribution of predictor variables.
b) The use of such models permits an assessment of the significance of the individual independent variables included in the model and
c) The models calculate the weight which each co-efficient contributes to the overall prediction of failure or non-failure and produce a probability score, which makes the results more accurate.
EMPIRICAL RESULTS
The primary motive of this research is to build up a model which would be beneficial for predicting bankruptcy of Financial Sector of Pakistan. For this purpose, we have identified 35 failed companies paired with Non-failed companies of the same industry and same size. Size is calculated in terms of Total Assets one year before bankruptcy. The required data is obtained through the various issues of Balance Sheet Analysis of Joint Stock Companies listed at Karachi Stock Exchange published by State Bank of Pakistan (SBP). We have used 32 different predictors which were identified by previous research and marked them as different categories namely profitability, leverage, liquidity, activity and Cash flow ratios. As a Statistical technique, we have used Discriminant Analysis (MDA) followed by Logistic Regression (Logit) Model.
4.1 Multiple Discriminant Analysis
This study has applied Discriminant Analysis (MDA) and Logit model for predicting corporate financial distress of non-financial sector of Pakistan. First of all, we will start with Multiple Discriminant Analysis (MDA) technique. We have decided to use Stepwise procedure for Multiple Discriminant Analysis (MDA).
4.1.1 Normality Test
Before going to start the tests, we have decided to check whether our independent variables are normally distributed or not. There are two tests used to check the normality of Independent Variables in SPSS. Kolmogorov-Smirnov test is employed when n is greater than 2000 otherwise Shapiro-Wilk test is used for samples of n=3 to 2000. Here, in our analysis, n is less than 2000, so we have used Shapiro-Wilk test. We may see that all the variables are significant which means that none of the variable is normally disbributed.
4.1.2 Descriptive Statistics
We have computed the Means and Standard Deviations of 32 variables which were grouped into different areas of profitability, leverage, liquidity, activity and cash flow used in our study for bankrupt and non-bankrupt firms for five (5) years before bankruptcy. It is evident from the analysis that non bankrupt companies have good profitability, high liquidity, low leverage and good cash flow whereas bankrupt companies have poor profitability, low liquidity, high leverage and poor cash flows.
4.1.3 Group Means Equality
We have checked Group Means equality to confirm that by using group means is there any significant disagreement between the groups on every independent variables. It is evident from the results that nine ratios were significant in the 1st Year, seven ratios were significant in the 2nd year, Six ratios were significant in the 3rd
year, three ratios were significant in the 4th year and seven ratios were significant in the 5th year. From the results, it is safely remarked that there is major (significant) mean difference between two group i.e. Failed and Non-Failed.
4.1.4 Variance Co-variance Matrices
We have checked the assumption of equlvalency of variance and the co-variance matrices. We have used Box’s M tests, which shows that null hypothesis is that the covariance matrices do not differ between groups formed by the dependent. Box M test has the significance of 0.006 which shows that the bankrupt and non-bankrupt groups have not equal co-variance matrices which indicates that the Multiple Discriminant Analysis (MDA) assumption of co-variance matrices of the failed and non-failed group equivalency is violated.
4.1.5 Results of Discriminant Analysis (MDA)
The results of Discriminant Analysis (MDA) shows that significant variables are included and insignificant variables are excluded. There are three variables which are EBIT over Current Liabilities, Sales over Total Assets and Sales over Quick Assets which are found significant and are scheduled in the table below.
4.1.6 Standardized Canonical Discriminant Function Co-efficients
Standardized Canonical Discriminant Function Co-efficients are just like weights used in regression. The sign shows the direction of the relationship. The three significant variables i.e. EBIT / Current Liabilities, Sales / Total Assets and Sales / Quick Assets have their standardized canonical discriminant function co-efficients in which Sales / Total Assets has the highest discrimination score of 0.825 which is followed by EBIT / Current Liabilities which has a score of 0.589 and Sales / Quick Assets have the lowest discrimination with a score of -0.536.
4.1.7 Group Centroids
In group centroids, we may check the predictor variables group means. We may call these grouping means as centroids. Here, we have two groups (cluster) of companies which are failed and non-failed companies. Bankrupt companies have a mean of -0.594 and non-bankrupt companies have a mean of 0.594. Companies with a score near to mean (centroid) are said to be belonging to that group.
4.1.8 Wilks’ Lambda of the Estimated Multiple Discriminant Analysis (MDA) Model
This tells us the significance and overall fitness of the estimated discriminant model. The results tell us that the model is significant (p < 0.000) and Wilks’ Lambda value of 73.4% shows the proportion of variability unexplained. The results also tells us that our model may be applied practically.
4.1.9 Discriminant Analysis (MDA) Model
The Multiple Discriminant Model or commonly called as Z-Score model which is derived from Standardized Canonical Discriminant Function co-efficients looks like
DS = 0.589*XI + 0.825*X2 – 0.536*X3 Where
DS = Discriminant Score XI = EBIT / Current Liabilities X2 = Sales / Total Assets X3 = Sales / Quick Assets
The companies with Score of 0.594 is classified as Non-bankrupt and companies with Score of -0.594 is classified as Bankrupt. The cut Score between failed and non-failed companies is zero. As the company is approaching towards more than zero than this means that company is approaching towards solvency and when the score is less than zero than this means the company is approaching towards bankruptcy.
4.1.10 Classification Results
The results tell us about the actual group membership and predicted group membership. It tells us that the overall accuracy of the model is 78.6% which is also said as hit ratio. Bankrupt companies were marked with improved accuracy (82.9%) than non-bankrupt companies (74.3%).
A Discriminant Analysis (MDA) was conducted to predict to classify company as failed or non-failed. There were 32 predictors / variables used which were classified as profitability, liquidity, leverage, activity / efficiency and cash flow ratios. We have seen means differences as significant for most of the predictors for five years prior bankruptcy. Shapiro-Wilk test has proved that none of the variable is normally distributed and Box’s M showed that assumption of variance co-variance equality matrices was violated. Here, it is pertinent to mention that with the large sample, the problem is not treated as serious. A model was developed having three significant variables namely EBIT / Current Liabilities, Sales / Total Assets and Sales / Quick Assets, having standardized canonical discriminant function co-efficients of 0.589, 0.825 and -0.536 respectively with group centroids of 0.594 for non-bankrupt and -0.594 for bankrupt with a cut value of zero. Model classification accuracy of model overall is 78.6%. Bankrupt companies were classified with better accuracy (82.9%) than non-bankrupt companies (74.3%).
4.2 Logistic Regression
This study has applied Discriminant Analysis (MDA) followed by Logistic Regression (Logit) model for predicting corporate financial distress of non-financial sector of Pakistan. Now after applying Multiple Discriminant Analysis (MDA) technique, we are applying Logistic Regression technique to check the results and compare the results with Multiple Discriminant Analysis (MDA) results. We have decided to use Stepwise procedure for Logistic Regression. We want to check whether Statistical tests gives us the results related to model fitness and how many independent (exploratory) variables create a significant (major) contribution to model.
4.2.1 Model Co-efficients Testing
The overall worth (significance) is checked through Model Chi Square, is actually derived from the likelihood of observing the actual data under the assumption that the fitted model is accurate. In Stepwise logistic regression there are number of steps listed in the table as each variable is added or removed, creating different models. The step is basically a measure of the improvement in the predictive power of the model since the previous step. In our analysis, model chi square has 3 degrees of freedom, a value of 36.990 and a probability of p<0.001. The significance value or p-value indicates our model is significantly different from the constant only model; meaning there is a significant effect for the combined predictors on the outcome variable i.e. failed or non-failed. 4.2.2 Model Summary
There is another approach towards measuring the model fitness i.e. Nagelkerke R Square. Nagelkerke R Square value at step 5 in this case is 54.7% which shows moderate strong relationship between the independent variables and bankruptcy prediction. The Cox & Snell R Square tells us that 41% dependent variable variation is explained (clarified) by logistic model. Nagelkerke R Square is the most reported of the R Squared estimates. 4.2.3 Model Fitness Test
The Hosmer and Lemeshow Test is the preferred test of goodness-of-fit. We can see model fit is acceptable as Chi Square is 7.796, p = .454, which indicates that our model expects values which are not significantly (majorly) different from the one we observed. We may safely say that our model is a good fit because it is not statistically (majorly) significant.
4.2.4 Classification Results
Here, we want to check at the quantity of cases where we have handled to correctly classify. The results show us that overall 80% companies were classified correctly. However, 88.6% of the bankrupt companies and 71.4% of the non-bankrupt companies were classified correctly. This 80% correct classification shows the considerable enhancement on the 50% correct classification which was with the stable (constant) model and tells us that the estimated model with used predictors (variables) is a significantly (majorly) better one.
4.2.5 Variables Used in the Analysis
Here, we may see that associated probabilities and Wald Statistic give us an index (guide) of significance (importance) of the every predictor (variable) in equation. The Wald statistic has a chi-square distribution. The B column tells us that by raising the corresponding measure by one unit influences the odds ratio. We may interpret the Exp (B) in terms of change in odds. If the value is greater than 1, then this means odds of an outcome occurring increase and if the value is less than 1, then this means that any increase in the predictor leads to a drop in the odds of the outcome occurring.
4.2.5 Predictive Equation in Logistic Regression
The B values are the logistic co-efficients that can be used to create a predictive equation. Probability of case = e{(1.519 × SEBVD) + (11.364 × EBITCL) + (-3.668 × RETA) + 0.06} 1+e{(1.519 × SEBVD) + (11.364 × EBITCL) + (-3.668 × RETA) + 0.06} 4.2.6 Classification Plots
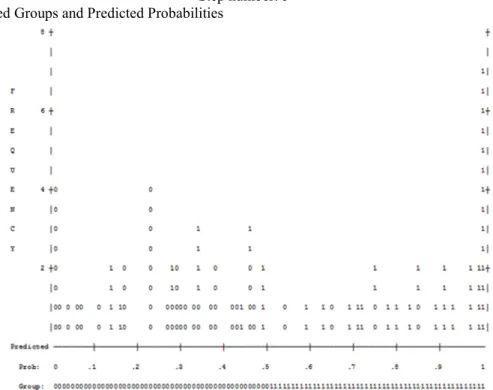
The histogram of predicted probabilities gives us a demonstration of the correct and incorrect predictions. The plot should be U shaped rather than normal distribution and there should be few errors. The 1’s to the left are false and 0’s to the right are also false. The results are listed below in Figure 4.1
Step number: 5 Observed Groups and Predicted Probabilities
Figure 4.1 Predicted Probability is of Membership for 1
The Cut Value is .50
Symbols: 0 – Bankrupt, 1 – Non-Bankrupt Each Symbol Represents .5 Cases.
4.2.7 Case-wise List
The case-wise list gives us the list that didn’t fit the model well. We may call these as outliers. There is only three cases falls into this category and this means that the model is reasonably sound. If the standardized residuals value is greater than 2.58, then these residuals should be inspected and considering removing them. Here, in our case all the values are less than 2.58. A Logistic regression analysis was conducted to predict whether the company is failed or non-failed. There were 32 predictors / variables used which were classified as profitability, liquidity, leverage, activity / efficiency and cash flow ratios. A test of the full model against the constant only model was statistically significant, indicating that the variables (predictors) as a set reliably reliably distinguished between bankrupt and non-bankrupt companies (chi square 36.990, p<0.000 with df = 3. Nagelkerke R Square value is 54.7% which shows moderate strong relationship between the independent variables and bankruptcy prediction. Prediction overall success was 80% (88.6% for bankrupt companies and 71.4% for non-bankrupt companies). The Wald criterion tells us that SEBVD, EBITCL and RETA made a significant contribution to prediction.
CONCLUSIONS AND RECOMMENDATIONS 5.1 Conclusion
We have seen that Bankruptcy prediction has always been a topic of interest among academicians for many years, while research in Pakistan in this context is limited. The main objective of this research was to check whether the information available publicly for the bankrupt and non-bankrupt companies is useful for developing the model for bankruptcy prediction. The study was conducted considering 35 bankrupt and 35 non-bankrupt companies which belongs to non financial sector of Pakistan. There were 32 predictors / variables used which were classified as profitability, liquidity, leverage, activity / efficiency and cash flow ratios and size. As a Statistical Technique, we have employed Discriminant Analysis (MDA) and Logistic Regression. While using Multiple Discriminant Analysis (MDA), it is evident that both the assumptions of data normality and variance co-variance equality are violated. The model estimated while using Multiple Discriminant Analysis (MDA) has shown that EBIT / Current Liabilities, Sales / Total Assets and Sales / Quick Assets may be used for bankruptcy prediction. Multiple Discriminant Analysis (MDA) overall prediction accuracy was 78.6%. Logistic Regression model is better than Multiple Discriminant Analysis (MDA) model because it does not imply the assumptions used in Multiple Discriminant Analysis (MDA). Logistic Regression model has shown that Shareholder’s Equity / Book Value of Debt, EBIT / Current Liabilities and Retained Earnings / Total Assets made a significant contribution