Yong-Hwan Lee1∗and Youngseop Kim2 1Far East University, Chungbuk, Korea
2Dankook University, Chungnam, Korea [email protected]
Abstract
Tone mapping of high dynamic range (HDR) images for realistic display is a commonly studied. However, scientific visualization of HDR image for analysis of scene luminance has much less atten-tion. In this paper, we have presented and implemented a simple approach for the reproduction and visualization of the color information in HDR images. We attempt several simple color visualizing functions, and estimate their effectiveness through the evaluation factors with common HDR images.
Keywords: High Dynamic Range (HDR) image, color visualization, image analysis
1
Introduction
Recently, technology of digital photography is very advanced. However, to achieve a level that is compa-rable to amazing capability of human visual system (HVS), the technology still has a problem to follow the HVS’s capability. For example, real world scenes which we experience in our daily life have a very wide range of radiance values, and HVS is capable of simultaneously perceiving scenes with dynamic ranges over five or nine orders of magnitude. But current imaging devices, such as video monitor and printing device, all have limited dynamic range. For example, digital camera stores color photos with 24 bit/pixel, and this can only capture a useful dynamic range of two orders of magnitude [5].
High dynamic range (HDR) imaging, where image file records the true radiance dynamic range and color gamut of the scene, holds potential in advancing digital photography technology. Many researchers have been developing HDR imaging technology, in both scientific and artistic communities for several years, about JPEG-compatible coding of HDR image [14], ranging from HDR radiance map capturing [8], efficient storage of 96 bit/pixel radiance maps [16], and tone mapping of HDR images for display in low dynamic range (LDR) media [12].
Despite these efforts, many technological challenges in HDR imageing remain. Another challenge is a visualization of HDR images for analysis and understanding of the scene. Currnet means of visualizing HDR images distinguish between contrast-enhancement and dynamic range compression techniques [4]. The key problem of visualization is how to translate from scene to image, while preserving the relevant scene information, producing a natural looking image, and avoiding common artifacts.
In this paper, We have a focus on description for how to best visualize a HDR image for the purpose of scene luminance analysis. The goal of this paper is to attempt to show that the color visualizing method can play an important role in descriptiveness of the visualization.
This paper is organized as follows: next section reviews related works about tone mapping and HDR imaging analysis. Section 3 presents the our method that uses two tasks of color conversion and color visualizing function. Experimental results are shown in section 4, and section 5 summarizes the study and its future works.
IT CoNvergence PRActice (INPRA), volume: 2, number: 4 (December), pp. 37-43
∗Corresponding author: Far East University, 76-43, Daehakgil Gamgok Eumseong Chungbuk, 369-700, Korea, Tel:
2
Related Works
A number of papers exist on tone mapping of HDR image. Tumblin [15] developed a tone mapping operator using human perception model. The main drawback of the algorithm is that he uses a global brightness adaptation, dark and bright regions are clipped. Qiu [11] proposed a tone mapping framework to offer an insightful and simple mechanism to control the appearance of the tone mapped image. Li [6] proposed the demanded local tone mapping of high dynamic range (HDR) images using saliency-aware weighting and edge-aware weighting. Reinhard [13] presented a time-tested techniques of photographic practice to develop a tone reproduction operator, which is simple and produces good results for a wide variety of images. He used and extended the techniques developed by Adams to deal with digital images. Information visualization is the study of (interactive) visual representations of abstract data to rein-force human cognition. The abstract data include both numerical and non-numerical data, such as text and geographic information [1]. Visualization is a process of presenting data graphically to gain insight and understand from image [7]. In this focus, study of visualizing HDR image is more accessible from image processing field. Pattanaik [10] proposed a multiscale model for the representation of pattern, luminance and color in the human visual system. The main problem with this work is that, although in-teresting for its detailed modeling of the human visual system, it cannot avoid halos. Pardo [9] proposed an algorithm for information visualization in HDR images to produce a minimal set of images capturing the information all over the HDR data. The main problem of this work is that the focused scene region with limited dynamic range is considered. Akyuz [2] presented a framework to generate false colored representation of HDR images. The main drawback of the paper is that evaluation is performed sub-jectively by 14 participants. Branchitta [3] proposed a local-contrast-enhancement algorithm on HDR image by applying a balanced contrast-limited adaptive-histogram-equalization technique.
3
The Proposed Method
Our idea is to propose a simple and effective method to visualize all the information in HDR image in a relevant way. First, we describe our high-level scheme that can be used to generate color visualization of HDR images, as shown in Figure 1. Then, we discuss several mapping functions that can be used in our method.
Figure 1: The proposed system flowchart
3.1 Workflow
As shown in Figure 1, we start with a HDR image, which is in a linear color space with sRGB primaries, with extension filename of HDR. As our goal is to assign different colors for different luminance values, our scheme uses HSV color space, which has the desired property that transition from dark to light values can be easily represented. Also, this color space gives another advantage. some saturated pixels (larger than 255) are clipped in sRGB space, however, this is avoided in HSV space. We then computes a luminance information by the following equation.
whereYhis the luminance of the high dynamic range image,Rh,GhandBhare the pixel value of the
HDR image, respectively. Although HSV encompasses a cylindrical volume, we use a single hue slice that has the highest possible value and saturation for maximizing visibility. The hue angles as a function of luminance is computed by the following.
H = 240◦·(1−CV(Y)) (2)
where color visualization function, CV, is a parameter, described in the next subsection. In HSV color space, the hue angle of 0◦corresponds to read and a hue angle of 240◦blue colors. From 240◦and 360◦, the hue angle transits the color from blue to violet and back to read. Thus, we exclude the violet portion of the hue circle, to avoid mapping both low and high luminance to similar hue values. We finally convert the computed HSV values back to RGB to obtain the color visualized HDR image.
3.2 Color Visualizing Functions
We estimate the our method with several simple color visualizing functions in Equation (2), which are linear scaling, logarithmic mapping and sigmoidal mapping.
The first function of color visualization is a linear scaling with clipping, which is defined as:
CVm(Y) =
[Y]m÷(100−m)−[Y]m
[Y]100−m−[Y]m (3)
where[·]mis the value at themthpercentile and[·]m÷nis the operator that clamps its input within the
given percentile.
The second is a logarithmic mapping, given by:
CVl(Y) =
log(Y+δ)−log(Ymin+δ)
log(Ymax+δ)−log(Ymin+δ)
(4) whereδ is small value, which is used to avoid singularity for black pixels.
The last is a sigmoidal mapping, defined as:
CVs(Y) = Ys 1+Ys where Ys= µ Y ·Y (5)
whereµ is a user-defined small value andY is the log-average luminance.
4
Results
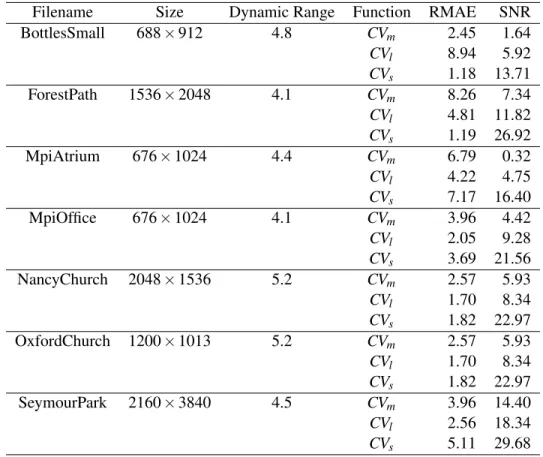
We have tested our method on many HDR images, shown in Figure 2, which are commonly used in the literature. We use relative mean absolute error (RMAE) and signal to noise ratio (SNR) to objectively to measure how well each visualization function describes the luminance in a given HDR image.
RMAE = 31N·∑N i=1 |R h(i)−R0h(i)| Rmaxh −Rminh + |Gh(i)−G0h(i)| Gmaxh −Gminh + |Bh(i)−B0h(i)| Bmaxh −Bminh SNR = 10·log ∑Ni=1(R2h(i)+G2h(i)+B2h(i)) ∑Ni=1((Rh(i)−R0h(i))2+(Gh(i)−G0h(i))2+(Bh(i)−B0h(i))2) (6)
whereRh,GhandBhare the HDR image pixels,R0h,G0handB0hare the recovered HDR image pixels,
Figure 2: HDR images used in the experiment; From left top to right bottom, (a) BottlesSmall, (b) ForestPath, (c) MpiAtrium, (d) MpiOffice, (e) NancyChurch, (f) OxfordChurch, and (g) SeymourPark
For each HDR image, we attempt to draw the color representation using the equations, described in the previous section, and the output results for only BottlesSmall image are shown in Figure 3. Then, we calculate the evaluation factors given in Equation (6). Our experimental results for all images are shown in Table 1. The experiments show that the sigmoidal mapping was consistently selected as the best color visualization approach for all images. The second approach is appeared to have been in the function of logarithmic scaling, and linear scaling with clipping consistently performed as the worst color visualizing method.
Figure 3: Outputs of HDR color visualizing method with BottlesSmall image; From left to right, (a) Linear Scaling with 5% Clipping, (b) Logarithmic Scaling, and (c) Sigmoidal Scaling
5
Conclusion
While tone mapping of HDR images for realistic display is a commonly studied, its scientific visual-ization for analysis of scene luminance has much less attention. In this paper, we have presented and implemented a simple approach for the reproduction and visualization of information in HDR images. The experiments indicate that sigmoidal scaling function show the better performance in terms of con-veying the luminance analysis in all HDR images.
A number of questions remain open after this work. The specific function here described for the computation of the set of images is just a particular example, and others should be developed. Addition-ally, which is the best algorithm for tone mapping of the most of HDR images. We hope that this work
Table 1: Experimental Results withm=5,δ =0.15, andµ=0.18
Filename Size Dynamic Range Function RMAE SNR
BottlesSmall 688×912 4.8 CVm 2.45 1.64 CVl 8.94 5.92 CVs 1.18 13.71 ForestPath 1536×2048 4.1 CVm 8.26 7.34 CVl 4.81 11.82 CVs 1.19 26.92 MpiAtrium 676×1024 4.4 CVm 6.79 0.32 CVl 4.22 4.75 CVs 7.17 16.40 MpiOffice 676×1024 4.1 CVm 3.96 4.42 CVl 2.05 9.28 CVs 3.69 21.56 NancyChurch 2048×1536 5.2 CVm 2.57 5.93 CVl 1.70 8.34 CVs 1.82 22.97 OxfordChurch 1200×1013 5.2 CVm 2.57 5.93 CVl 1.70 8.34 CVs 1.82 22.97 SeymourPark 2160×3840 4.5 CVm 3.96 14.40 CVl 2.56 18.34 CVs 5.11 29.68
will be the first study on answering this question.
Acknowledgements
This research was supported by the ICT Standardization program of MISP(The Ministry of Science, ICT & Future Planning)
References
[1] Wiki website. http://http://en.wikipedia.org/wiki/Information_visualization, 12/20/2014. [2] A. O. Akyuz. False color visualization for hdr images. InProc. of the First International Conference and
SME Workshop on HDR imaging (HDRi’13), Porto, Portugal, pages 1–5, April 2013.
[3] F. Branchitta, M. Diani, G. Corsini, and A. Porta. New visualization method improves perception of details.
Electronic Imaging & Signal Processing, pages 1–2, September 2008.
[4] F. Branchitta, M. Diani, G. Corsini, A. Porta, and M. Romagnoli. Dynamic range compression and contrast enhancement in infrared imaging systems. InProc. of the Electro-Optical and Infrared Systems: Technology and Applications IV (EOIS’07), Florence, Italy, September 2007.
[5] M. Chen, G. Qiu, Z. Chen, and C. Wang. Jpeg compatible coding of high dynamic range imagery using tone mapping operators. InProc. of the 25th Picture Coding Symposium (PCS’06), Beijing, China, pages 22–28, April 2006.
[6] Z. Li and J. Zheng. Visual-salience-based tone mapping for high dynamic range images. IEEE Transactions on Industrial Electronics, 61(12):7076–7082, March 2014.
[7] S. Murray. Interactive Data Visualization for the Web. O’Reilly Media, 2013.
[8] S. K. Nayar and T. Mitsunaga. High dynamic range imaging: Spatially varying pixel exposures. InProc. of the IEEE Conference on Computer Vision and Pattern Recognition (CVPR’00), Hilton Head Island, South Carolina, pages 472–479. IEEE, June 2000.
[9] A. Pardo and G. Sapiro. Visualization of high dynamic range images. IEEE Transactions on Image Process-ing, 12(6):639–647, June 2003.
[10] S. N. Pattanaik, J. A. Ferwerda, M. D. Fairchild, and D. P. Greenberg. A multiscale model of adaptation and spatial vision for realistic image display. InProc. of the 25th annual conference on Computer graphics and interactive techniques (SIGGRAPH’98), Orlando, Florida, USA, pages 287–298. ACM Press, July 1998. [11] G. Qiu, Y. Mei, K. M. Lam, and M. Qiu. Tone mapping hdr images using optimization : A general framework.
InProc. of the 2010 IEEE International Conference on Image Processing (ICIP’10), Hongkong, China, pages 3129–3132. IEEE, September 2010.
[12] G. Qiua, J. Duana, and G. D. Finlayson. Learning to display high dynamic range images.Pattern Recognition, 40(10):2641—-2655, October 2007.
[13] E. Reinhard, M. Stark, P. Shirley, and J. Ferwerda. Photographic tone reproduction for digital images. In
Proc. of the 29th annual conference on Computer graphics and interactive techniques (SIGGRAPH’02), San Antonio, Texas, USA, pages 267–276. ACM Press, July 2002.
[14] T. Richter. Backwards compatible coding of high dynamic range images with jpeg. InProc. of the 2013 Data compression Conference (DCC’13), Snowbird, Utah, USA, pages 153–160. IEEE, March 2013.
[15] J. Tumblin and H. Rushmeier. Tone reproduction for realistic images. IEEE Computer Graphics and Appli-cations, 13(6):42–48, November 1993.
[16] G. Ward and M. Simmons. Subband encoding of high dynamic range imagery. InProc. of the 1st Symposium on Applied perception in graphics and visualization (APGV’04), Los Angeles, California, USA, pages 83–90. ACM Press, August 2004.
Author Biography
Yong-Hwan Lee received the M.S. degree in Computer Science and Ph.D. in Elec-tronics and Computer Engineering from Dankook University, Korea, in 1995 and 2007, respectively. Currently, he is a assistant professor at the Department of Smart Mobile, Far East University, Korea. His research areas include Image/Video Repre-sentation and Retrieval, HDR Coding, Face Recognition, Augmented Reality, Mobile Programming and Multimedia Communication.
Young-Seop Kim received the M.S. in Computer Engineering from the University of Southern California in 1991, and the Ph.D. in Electronic Systems from Rensselaer Polytechnic Institute in 2001. He was a manager at Samsung SDI until 2003. He developed the image-processing algorithm for PDP TV while at Samsung. Currently he is an Associate Professor at Dankook University in Korea. He is the resolution member and the Editor of JPsearch part 2 in JPEG, the co-Chair of JPXML in JPEG, and Head of Director (HOD) of Korea. He is also Editor-in-chief of the Korea Semi-conductor and Technology Society. His research interests are in the areas of image/video compression, pattern recognition, communications, stereoscopic codecs, and augment reality. They include topics such as object-oriented methods for image/video coding, joint sourcechannel coding for robust video trans-mission, rate control, video transmission over packet wired or wireless networks, pattern recognition, image processing, and augmented reality.