The Australian Journal of Agricultural and Resource Economics, 46:3, pp. 99– 122
Blackwell publishing Ltd Oxford, UK AJAR
The Australian Journal of Agricultural and Resource Economics 1364-985X
© 2003 Australian Agricultural and Resource Economics Society Inc. and Blackwell Publishing Asia Pty Ltd. 2003 47 1 1 000 ORIGINAL ARTICLE
Implications of US Farm Bill D.A. Sumner
Implications of the US Farm Bill of 2002 for
agricultural trade and trade negotiations
*
Daniel A. Sumner†
The US Farm Bill of 2002 is the latest in a 7-decade history of farm subsidy laws that transfer funds to farmers and regulate and subsidize production of selected commodities. Fruit, tree nut, ornamental and vegetable crops, hay and meats remain outside scope of main subsidy programs. The new law continues many innovations of the 1996 Act, such as removal of authority for annual land idling and crop price floors accompanied by government stockholding. Govern-ment payGovern-ments remain the primary focus of commodity programs. The total amount of these payments are likely to remain similar to the amount paid in the period 1999 –2001, but with some changes in the form of the programs. For example, allowing owners to update acreage and yield payment bases creates additional incentives for farmers to link current planting decisions to anticipated farm sub-sidies. Similarly, the new program that ties “counter-cyclical” payments to the price of a specific crop also has production stimulus. A new program, estimated to add about 5 –10 per cent to marginal milk revenue for smaller farms, makes ‘deficiency’ payments to dairy farms when milk prices are low. Despite the new programs with added links to stimulating production, new USA programs stimulate production only marginally more than the subsidies of the 1999 –2001 period, which were replaced. Furthermore, the USA has flexibility to avoid explicitly violating its WTO commitments. Nonetheless, this US Farm Bill of 2002 has curtailed the previous trends toward lower farm subsidies and smaller production stimuli, and the negative publicity surrounding it has made negotiating reductions of farm trade distortions more difficult.
1. Introduction
The Farm Security and Rural Investment Act of 2002 (FSRIA), as the new US Farm Bill is formally known, garners international attention for * The present paper grew out of drafts prepared at the Korea Rural Economic Institute, Seoul Korea; the FAO, Rome; the INEA, Rome; the AARES 5th Annual Symposium,
Uni-versity of New England, Australia and the American Agricultural Economics Association Meetings. The author appreciates comments from participants at those sessions and espe-cially from Hyunok Lee, Jung Sup Choi, Giovanni Anania, Ivan Roberts, Bruce Gardner, the editors and two referees, and especially thanks Joseph Balagtas for discussions and analysis concerning the dairy payment program.
† Daniel Sumner is Director of the University of California Agricultural Issues Center and the Frank H. Buck, Jr. Professor in the Department of Agricultural and Resource Economics, University of California, Davis and a member of the Giannini Foundation.
100 D.A. Sumner
several reasons. First, the USA is a major producer, consumer, exporter and importer of many agricultural commodities. Behaviour of producers, consumers, and marketing firms in the USA can influence world markets. USA policies, thus, have the potential to affect price expectations and price realisations in major commodity markets around the world. Second, for many years the USA government has played a major role in international trade negotiations, including at the World Trade Organisation (WTO). Because its provisions may affect trade and because trade agreements also discipline USA policy, the Farm Bill may affect the negotiating positions of the USA or the positions of other countries. In this way the Farm Bill may affect international trade rules and these, in turn, influence policies in other countries and international commodity markets. Third, the Farm Bill might conflict with USA compliance with existing international agreements and thus lead to international disputes. Such disputes affect markets directly, affect trade negotiations and may slow the pace of global policy reform. Finally, for approximately 2 decades the USA was on a path of gradual reform to make its policies more consistent with market forces and trade liberalisation. Some international observers and policy makers have looked to the USA experience for lessons about the effects of farm policy, and therefore, policy change in the USA may influence policy reform prospects in other countries.
For more than 6 decades the USA has periodically renewed and reformu-lated legislation authorising domestic farm subsidy programs. For example, the Food and Agriculture Improvement and Reform (FAIR) Act of 1996 covered years 1996 to 2002, replacing the Farm, Agriculture, Conservation and Trade (FACT) Act of 1990 (together with the farm spending portions of the Omnibus Budget Reauthorization Act of 1990), which replaced the Food Security Act of 1985. Each of these laws authorised farm commodity programs for between 5 and 7 years and took the legal form of temporary amendments of the so-called ‘permanent’ authorising legislation of 1949. The 1949 Act itself was just one of the periodical laws that have governed the production and marketing of selected farm commodities in the USA since the mid 1930s (Olmstead and Sumner, in press). In its time, each of these laws has been known as ‘the Farm Bill’ and the 2002 Farm Bill is just the latest in this long line of legislation.
Farm bills typically deal with many topics far broader than farm com-modity subsidies. Over the years the laws have become ever more compre-hensive and complex. They are comprised of many separate titles, which deal with such diverse topics as food assistance for the poor, research and extension support, food safety, and aid to rural communities for sewage treatment or electricity. Farm bills also include a diverse set of programs that affect farming. These include authorisation for conservation-based
Implications of US Farm Bill 101 land reserves, subsidies for some farm environmental improvements, and updates of selected commodity marketing regulations. In the international arena, recent farm bills have included authorisation of export price subsi-dies, subsidies for international promotion, food aid, and export credit guarantee programs. The Farm Security and Rural Investment Act of 2002 is no exception to the trend – this bill is complex and diverse and includes all these items and more. Farm bills do not set tariff rates and do not implement trade agreements.
The present article reviews the 2002 Farm Bill in the USA with attention to those features of the legislation that are likely to be of the most interest in the international community generally and WTO negotiations in partic-ular. In recognition of space limitations, I will leave aside many topics that are important within the USA, but of less importance to agricultural observers and market participants outside the USA (USDA 2002). The relationship between the Farm Bill and the Uruguay Round Agreements on Agriculture (URAA) and the ongoing WTO negotiations are a major part of the present paper.
2. Clarification about USA agriculture and USA farm policy
While USA agriculture is large and diverse, about 90 per cent of all farm program payments, which are the traditional focus of farm bill debates, are provided to a small range of crops – grains, oilseeds (now including peanuts) and cotton that produce about 40 per cent of farm cash receipts. Several minor or specialty commodities such as honey and wool also receive sub-stantial payments relative to the size of the industries. Dairy is supported by a complex set of marketing regulations that allows price discrimination within the USA, by trade barriers, a small export subsidy program and direct payments. A few other commodities, notably beef, sugar, peanuts and frozen concentrated orange juice have significant trade barriers. But, despite crop insurance subsidies, disaster aids, marketing regulations and occasional ad hoc programs, government subsidy or protection for most of the rest of USA agriculture is quite low. In particular, the meats, fruits and tree nuts, vegetables and melons, ornamental crops, and hay crops receive almost no program payments and, even including import barriers (with a few exceptions, such as frozen concentrated orange juice), have little sup-port compared to the program crops and sugar. The average producer support for these commodities, which comprise more than half of USA agriculture, is less than 10 per cent of total revenue, and this figure includes broad support such as research and extension. In discussing commodity programs in the FSRIA we should not loose sight of which commodities are left out.
102 D.A. Sumner
3. 2002 context: prices, policy and WTO disciplines
The FAIR Act was negotiated in 1995 while many farm commodity prices were at historical highs. This price situation allowed the law to increase payments to farmers in the short term while projecting lower long-term payment commitments relative to what would have been allocated under previous law. The FAIR Act eliminated land set-asides and continued the move toward reducing the link between direct farm payments and current production or prices. Payment rules allowed farmers to plant alternative crops or leave the land idle. These Agricultural Market Transition Act (AMTA) payments were the centerpiece of FAIR Act reforms known as ‘Freedom to Farm’.
The FAIR Act also continued the use of payments rather than government purchases and stock management in the case of very low prices. For decades, farm bills had set floor prices at which the USDA acquired program crops and held them in government-administered stockpiles. Under the market-ing loan scheme, often implemented by Loan Deficiency Payments (LDP), the government simply pays the difference between the government-set loan rate (a price support for producer prices) and the loan repayment rate (the price at which government price support loans are repaid. The loan repayment rate varies with the market price for the crop (with different procedures for different crops). This scheme provides a price floor for growers, but removes the government from the demand-side and allows the crop to be marketed through normal channels. For wheat, feed grains and soybeans the loan rates were set at rates roughly equivalent to 70 per cent to 85 per cent of the moving average of past prices, with some fixed mini-mums, and was expected to be triggered only in the most unusual of cir-cumstances. (The marketing loan approach was introduced for rice and cotton in the 1985 Act.) Nonetheless, after 3 years of high prices, the collapse in prices in 1997 and 1998 caused large marketing loan benefits to be distributed. The magnitude of payments grew rapidly and remained high through most of 2002.
While the farm bills make international headlines, the USA enacts significant changes in agricultural policies almost every year. For example, over the past few years there have been changes in crop insurance pro-grams, disaster assistance and dairy marketing orders. Overshadowing all of those, however, were annual ad hoc increases in the payments, which had been supposedly set for seven years in the 1996 Fair Act. In 1998, the legislated payment rates were raised by 50 per cent and named Market Loss Assistance (MLA) payments. For each of the years 1999, 2000 and 2001 the direct payment rates were doubled under annual MLA legislation. The consensus among all farm program observers is that the payment
Implications of US Farm Bill 103 rates would have been doubled again for 2002 if the FSRIA had not intervened.
In summary, going into the debate on the 2002 Farm Bill, three farm pay-ment programs were making record paypay-ments to growers of program crops. These were (i) the AMTA payments, which were not tied to current produc-tion or prices; (ii) MLA payments that were not tied to current producproduc-tion; but were motivated by low commodity prices; and (iii) the marketing loan benefits (LDP) that were tied directly to current production of a specific commodity and calculated to offset low prices for that commodity.
Consider next how the FAIR Act and subsequent ad hoc legislation related to the URAA of the WTO. (I will not review the URAA in any detail here. For a brief review of the URAA in the context of farm trade negotiations see Sumner and Tangermann 2002) Remember, USA farm bills do not typically deal directly with import tariffs or tariff rate quotas (TRQ). The USA schedule of import barrier reductions and related rules was set in the implementing legislation in 1994. Farm bills have historically authorised export subsidies, and the FAIR Act continued that tradition by authorising the continuation of export price subsidy programs at URAA maximums, even though these were not then being used for grains and have not been used subsequently. Export subsidies have become a minor issue in recent USA policy discussion.
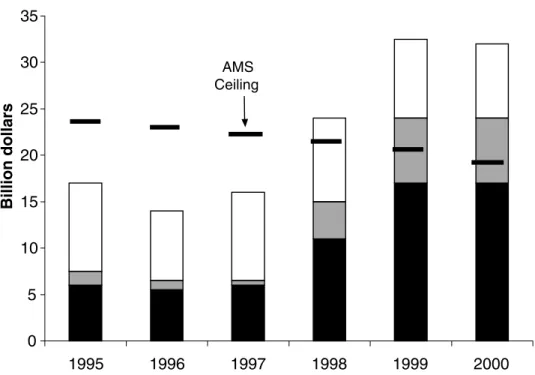
The main connection between recent farm legislation and the WTO relates to domestic support and the computation of Aggregate Measure of Support (AMS) limits. The AMS indicates the amount of subsidy that is presumed to affect trade significantly and therefore is liable to be reduced according to WTO rules. Figure 1 shows the total direct support of the USA in categories used in implementing the URAA. For the period 1995 through 1997 the AMS was in the range of #6 billion and far below the cap of more than #20 billion for that period. The FAIR act did nothing to change the AMS. Under the FACT Act of 1990, USA payment programs qualified as those not subject to AMS reduction commitments because mandatory land idling or specific limitations on the share of output that qualified for payments were included in the program. For 1996 and thereafter, the AMTA payment program qualified as ‘minimally trade distorting’ or ‘green box’ and therefore not subject to restrictions because payments had very limited ties to current production of any specific commodity. Figure 1 documents that, starting in 1998, the USA support levels jumped and the AMS jumped as well. Two sets of payments responded to low commodity prices. The marketing loan benefits are product-specific and tied directly to production and prices of specific commodities. They account for the rise in the AMS. The MLA payments were not tied to production of any specific crop but were linked to low prices (at least through Congressional intent).
104 D.A. Sumner
Therefore they have been designated non-product-specific amber support in the WTO notifications. Figure 1 shows how the exempt non-product-specific (NPS de minimis exempt) support jumped in 1998 and jumped again in 1999 when the amount of ad hoc payments was raised further. Because the USA provides relatively little support for most commodities, even with these payments added, the total NPS support remained less than five per cent of the value of total farm production (which is about 0.05 ×#200 billion = #10 billion) and so these payments did not contribute to the AMS that is sub-ject to WTO reduction commitments.
Details for the last official USA notification to the WTO are presented in Table 1 (adapted from Nelson 2002). This table provides a useful overview of the way USA programs related to WTO commitments. The AMS was mainly comprised of price support for dairy, sugar and peanuts plus mar-keting loan benefits. Importantly, the dairy support price relative to the fixed border price accounts for approximately #4.3 billion of the AMS, and this policy provides almost no support in addition to that provided by the dairy trade barriers. The NPS amber box support, which was outside the AMS, was mainly comprised of the ad hoc payments and crop insur-ance subsidies. Finally, the green box support was mainly comprised of the Figure 1Total direct support reported to the WTO: USA AMS approaches the ceiling. j, AMS; , NPS de minimis exempt; h, Other exempt
Implications of US Farm Bill 105
decoupled payments, plus payments for the long-term land idling in the Conservation Reserve Program (CRP), and miscellaneous payments.
The context for the 2002 Farm Bill included low farm prices in the USA and a perception on the part of some farm groups that the FAIR Act and the URAA did not create farm prosperity as promised and so these policy reforms had failed. This, together with a budget surplus when the legislative process began, was enough to ensure that farm spending would not be reduced from the recent amounts.
Let us now turn to consider some of the features of the 2002 Act so we can see how it relates to WTO commitments and negotiations.
4. Farm security and rural investment act of 2002
Official reports from the USA Congressional Budget Office have been inter-preted to mean that farm commodity spending will increase radically under the FSRIA. That is only true if we compare projections under the new law to projected spending under the FAIR Act and ignore the ad hoc legislation that was in place every year since 1998. The FSRIA does not increase com-modity program spending compared to programs that have actually been in place since 1999. In effect, the FSRIA makes the ad hoc spending included in the MLA programs a regular part of the legislation for the next 6 years. However, the form of spending changes somewhat and this has raised controversy. Even before the legislation was enacted, David Orden (2002), Table 1 USA direct support to agricultural producers in 1998 notified to WTO
WTO Category USA Program
1998 Total (# billion) AMS Exempt 1998 AMS
Amber Box Dairy price support 4.33 0 4.33
Product Specific* Loan deficiency payments & marketing loans
3.82 0.03 3.79
Other 2.39 0.08 2.27
Amber Box Payments (0.5 AMTA) 2.81 2.81 0
Non-product-Specific* Crop Insurance 0.75 0.75 0
Other 1.03 1.03 0
Green Box Support AMTA 5.66 5.66 0
Conservation reserve program
1.69 1.69 0
Disaster 1.41 1.41 0
Environment and Credit 0.35 0.35 0
Total 24.24 13.81 10.39
WTO Ceiling na na 20.70
AMS, aggregate measure of support; AMTA, agricultural market transition act. * Subsidies not in AMS ceiling if less than 5 per cent of applicable revenue
106 D.A. Sumner
for example, argued that the 2002 Act represents a reversal of the reforms of the past 15 years.
4.1 Selected provisions affecting commodity markets and trade
The FSRIA authorises additional subsidies in its conservation and environ-mental sections. Notably, the CRP ceiling increases from 36.4 million acres to 39.2 million acres, so that additional land will be removed from crop pro-duction for 10-year periods. Money is also added to subsidies for farmers to implement environmentally friendly practices in the environmental quality incentives program. Furthermore, a small new ‘Conservation Security Pro-gram’ provides annual payments to farms that use environmentally approved practices.
Trade provisions are a relatively minor part of the FSRIA and change little. The Export Enhancement Program is once again authorised at the WTO maximum limits, but (once again) no one expects the program to be used in a significant way. The law continues food aid and export credit subsidy pro-grams and gradually doubles, back to #200 million per year, the authorised subsidy for industry efforts to promote USA farm products in export mar-kets, known now as the Market Access Program (MAP). The MAP program, which is heavily used by the otherwise minimally subsidised commodities, provides matching funds for industry promotions overseas. It is not clear how effective these export programs are and they have not been treated as export subsidies in the WTO.
Another trade provision requires labelling of imported meats and fresh produce with their country of origin. For meat, the law requires labelling as imported meat from livestock that was born or spent part of its life out of the USA. Given the cross-border movement of livestock between the USA, Canada and Mexico, this feature of the law will be very difficult to imple-ment. This program was clearly designed to disadvantage imports, but it is unlikely to be a major factor in discouraging trade in general and is unlikely to raise WTO issues. The importance of the import labelling law is mainly symbolic and is a disquieting indication of the general protectionist tenor that has recently colored much farm policy discussion in the USA. (There is no requirement for labelling livestock fed with imported feed or conceived using imported semen. Perhaps those are on the agenda.)
4.2 Payments for program crops
The commodity payment provisions in the law are the headline story and where most of the annual #20 billion in budget costs are found. There are many details in the commodity title of the FSRI Act and some new ‘small’
Implications of US Farm Bill 107
or specialised programs. These include a new peanut program to replace marketing quotas and relatively small payments for apple growers. But here we will concentrate on the main payment programs.
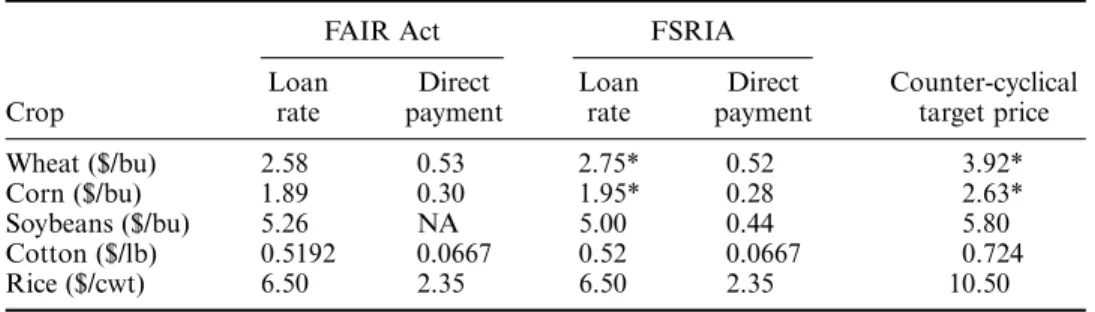
First consider loan rates. Table 2 shows that loan rates were raised for corn and wheat, lowered for soybeans, with no change for rice and cotton. (Marketing loan programs are also available for other feed grains, extra-long staple cotton, other oilseeds, peanuts, wool, mohair, honey, and field peas and lentils.) The lowering of soybean loan rates corrects a widely acknowledged problem with the FAIR Act that created incentives to plant soybeans in place of other crops. Remember these ‘loan rates’ are now used solely to determine the LDP or marketing loan benefit rate whenever the market price falls below the loan rate.
For a grower i of crop j in year t, the benefit is as follows:
Marketing Loan Benefitijt = ( LRijt− LRRijt)Aijt Yijt, (1)
where the loan rates, LR, vary by local areas and the quality of the crop and the loan repayment rates, LRR, vary (along with market prices) weekly by market conditions. The payments are applied to current production on each farm, which equals harvested area, A, times yield, Y.
Higher loan rates for corn and wheat increase the expected cost of the legislation significantly and have WTO implications, because these subsi-dies are clearly in the product-specific amber category. This feature of the farm programs, the most production distorting payment program, has been in place for many years for the main commodities, but was extended in 2002 to peas and lentils.
Table 2 also shows direct payments rates under FSRIA compared to the FAIR Act payment rates that applied in 2001. The new direct payment Table 2 National average loan rates, direct payments and counter-cyclical target prices
Crop
FAIR Act FSRIA
Counter-cyclical target price Loan rate Direct payment Loan rate Direct payment Wheat (#/bu) 2.58 0.53 2.75* 0.52 3.92* Corn (#/bu) 1.89 0.30 1.95* 0.28 2.63* Soybeans (#/bu) 5.26 NA 5.00 0.44 5.80 Cotton (#/lb) 0.5192 0.0667 0.52 0.0667 0.724 Rice (#/cwt) 6.50 2.35 6.50 2.35 10.50
* In 2002 and 2003 the wheat loan rate is #2.80 and the target price is #3.86. The corn loan rate is #1.98 and the target price is #2.60.
FAIR, Food and Agriculture Improvement and Reform; FSRIA, Farm Security and Rural Investment Act of 2002.
108 D.A. Sumner
rates are approximately equal to the payment rates that applied in 2001, except that now farms with a history of soybean or other oilseed produc-tion will receive a direct payment and a new program was added for peanuts. These payments were in the WTO green box under the FAIR Act.
The FSRIA direct payment for farm i is:
Direct Paymentij = 0.85Dj( BDij YDij), (2)
where D is the payment rate for base in crop j, BD is the base area established for farm i, crop j and YD is the established historical yield for i and j. In the FAIR act the BD and YD were based on the planting history on that farm during the period 1981 to 1985. Many farmers planted other crops on this land or left the land idle and still received their program payments. For the new law, area bases may, at the farmer’s option, be updated to the 1998 to 2001 period. Because soybeans are now eligible for these payments, some base updating would have been required to adjust for new assignments of base areas to soybeans that had been planted on base area of other program crops. The FAIR Act did not allow total flexibility in the use of land receiving these payments and restrictions continue. In particular, the payment land may not be shifted out of agriculture altogether and the land may not be used for fruits, tree nuts or vegetables and melons. These restrictions are of little importance for most USA program crop land, but they do matter for perhaps five per cent of the relevant area. For example, in California, vege-table crops, fruits and tree nuts compete with program crops, in the north-west potatoes and wheat compete for land and there are pockets in the Midwest where vegetables have some presence.
The third payment program in the FSRIA replaces the ad hoc MLA pay-ments that had been made from 1998 to 2001, and were on track to be dis-tributed again in 2002. This new counter-cyclical payment (CCP) program uses a target-price framework, but the distribution of payments is tied to historical bases rather than current production. In this case, if the producer elects to update the acreage base on a farm (Bij) that farm may also update
the yield base to 93.5 per cent of the average of the 1998 to 2001 yields ( YCCij). The counter-cyclical payment for a farm is calculated as:
CCPijt = 0.85( TPj − (Max (NPjt, LRijt)) − Dj)( Bij YCCij) (3)
where TP is the target price (shown in Table 2 for the main program crops) and NP is the national average market price. As with the loan benefits these payments are not allowed to be negative. The CCP is designed to supple-ment the direct paysupple-ment in times when the average price for the commodity is lower than the target price.
Implications of US Farm Bill 109 While the payments are made on historical bases and are not tied to cur-rent output of any specific crop, a higher probability that base areas and base yields may be updated increases the supply response to these pay-ments. Furthermore, because payment rates are tied to the market price of a specific crop, for those growers planning to plant the eligible crop on the base land, this payment provides a revenue off-set when prices are low.
The potential WTO concerns related to AMS calculations in the FSRIA are evident. Anticipating such concerns, the law provides that, if commod-ity support is projected to exceed the limits accepted by the USA in the Uruguay Round Agreement, the Secretary of Agriculture must adjust sup-port to comply with the WTO limits.
5. Implications of the FSRIA for production and prices of program crops
The implications of the 2002 Farm Bill for trade (and trade negotiations) centre mainly (if sometimes indirectly) on its production subsidy implica-tions, that is, the anticipated supply response to the various payment pro-grams included. The issues are (i) the effects on production of various crops; (ii) effects of this supply response on world supply and prices; (iii) the compliance of the new payment schemes with URAA rules; and (iv) the impact on the negotiating positions of the USA and others in the current negotiations. The first two of these issues are dealt with in this section.
For world markets the question is the change in commodity production anticipated under the new law relative to previous law, and how that addi-tional production would affect world prices. As a first step we must clarify our point of comparison. Many of the popular accounts and statements from international observers have compared commodity program outlays under the FSRI Act to the projected outlays under the FAIR Act without includ-ing the MLA payments that were made every year since 1998. One repre-sentative statement was from French President Jacques Chirac (REUTERS 2002) who noted that … ‘massive increases to [ USA] farm subsidies would hurt poor countries hardest – including those in Latin America’.
I argue that it is misleading to compare the FSRIA to the FAIR Act in a form which was not actually applied. In fact, the new feature of the FSRIA, the CCP program, was calibrated so that the projected payments roughly equal the amount of the MLA payments that were made in 2001 and would have been made in 2002. Thus, compared to programs that were actually applied, the FSRIA does not increase the commodity payments signifi-cantly. In budget terms, a reversal of farm program reform in the USA occurred in 1998 not 2002. Nonetheless, the FSRIA explicitly sets payment program rules that are planned for the next 6 years, and thus replaces annual ad hoc programs with what may be more secure funding. Of course,
110 D.A. Sumner
Congress can still pass new laws that add to or subtract from the FSRIA. In the 1990s, Congress lowered farm payment rates when budget deficits grew and then raised legislated payment rates later when the USA govern-ment budget was in surplus. With that experience, it is also wrong to claim, as some have done, that the FSRIA ‘locks in’ payments for the next 6 years.
For the rest of this section I will explicitly compare the FSRIA with the programs that were in place for 1998 to 2001, and were on track for 2002, before the new law replaced them.
The direct market implications of the FSRIA hinges on the supply response to the new law. Estimation of agricultural supply response is difficult in the simplest of circumstances. Projecting the supply impact of this new legisla-tion is exceedingly complex given the multi-commodity nature of the policies and farming enterprises and because several impacts are indirect.
Some supply responses for program crops to the FSRIA may be consid-ered by looking at the revenue flows of program crop producers. The Act does little to change marginal cost conditions significantly for these pro-ducers. Cross commodity impacts may also be important to consider, both within the program crops and for other crops and livestock commodities. Net revenue ( NR) associated with the program crop may be written as the sum of the three equations listed above plus market price ( P) times area times yield minus costs (C), which are also a function of area and yield. Obvi-ously, many of these variables are only known approximately and expected net revenue is the appropriate concept:
NRijt = ( LRijt− LRRijt)Aijt Yijt + 0.85Dj( Bij YDij) + 0.85(TPj − (Max ( NPjt,
LRijt) ) − Dj)( Bij YCCij) + Pijt(Aijt Yijt) − C(Aijt Yijt). (4)
In order to see the supply effects of the new law we need to think about how the new law affects the derivative of the net revenue equation with respect to production (harvested area times yield).
Direct expected marginal revenue from additional production is just, price plus the marketing loan gain. However, there are a number of effects of the new law on profitability of planting program crops, and these may be considered by examining equation (4) carefully and thinking about its derivatives. Let us summarise some of the main influences.
The first impact is straightforward. Because loan rates in the new law are about 8 per cent higher for wheat, about 3 per cent higher for corn and 5 per cent lower for soybeans, we would expect a supply shift towards wheat and corn and away from soybeans.
A second factor is not really new in the FSRIA but should be discussed in this context. Some economists have argued that any government payments
Implications of US Farm Bill 111 tied to farmland increases production even if they are not tied to current production (Roberts and Jotzo 2001). To the extent that more wealth on farms reduces the interest rate faced for farm investments, this impact can be built into supply response to the price of credit. There is little empirical analysis available to suggest that this interest rate impact is large. Also USA farmers are wealthy and the share of wealth tied to farm payments is small in aggregate, although the additional liquidity may be important in some cases. Further, a significant share of payments goes to farm landlords who are not active farmers. The credit effect is less direct for these payments. Recent data shows that about 20 per cent of the land value of program crops is attributable to farm payments, but 62 per cent of that land is owned by non-operator landlords rather than farmers (Barnard et al. 2001).
A related argument is that payments reduce the risk of growing certain crops. This is less obvious when one considers the undiversifiable policy risk associated with these payments. Even so, the effect of reduced annual revenue variability on production has not been adequately measured in a model in which farmers have a portfolio of potential investments and income streams. ( Hennessy (1998) and Young and Westcott (2000) discuss related issues in the context of FAIR Act payments. Both these papers suggest that the pro-duction effects of direct payments with loose ties to current propro-duction are small in aggregate.)
Third, consider the implications of replacing the ad hoc MLA payments with the new counter-cyclical payments. As noted, the payment rate is tied directly to the current price of the program crop and provides a price offset for producers who continue to plant the program crop when market prices are low. This reduces losses from downside price movements. Furthermore, growers may place a higher probability on actually receiving the CCP in the future because they are written into the continuing legislation.
The most interesting change in the FSRIA is the updating of the base areas and base yields from the fixed 1981–1985 bases in the old law. This change has implications for markets and trade. Clearly, voluntary updating to the recent period will cause more of the payments to flow to those pro-ducers who have grown more of the program crop recently. More important for market effects and WTO considerations, updating in 2002 naturally causes growers to revise estimates of the probability of future updating. This means that, in considering what to plant on payment-base acres, the effect on the present value of future payments becomes a more important consideration. The empirical importance of this supply response has not been investigated in practice. If growers expect a large effect of current area and yield on the base used for future payments, then they will plant sub-stantially more of the program crop now to build program base for the future. We need to consider the degree of linkage between payments with
112 D.A. Sumner
potentially updated bases and current production. Then we need to estab-lish how much a current update affects that degree of linkage.
Let us explore the degree of linkage between current production and pay-ments and how this is affected by updating base area in a simplified case. In Equation (5) the degree of linkage is the discounted sum over future years of the product of (i) probability that program remains operative t years in the future (Prob Gt) times (ii) the expected payment rate (conditional on
the program remaining in place) relative to the current payment rate (E(Rt/
Rn) ) times (iii) the probability that an update occurs for year n + t (Prob
Ut) times (iv) the expected marginal effect of current area planted on the
new base (dBt/dAn) times (v) the expected marginal effect of the new base
on the payment rate in year n + t relative to the current program (dRt/dBt)/
(dRn/dBn). This last expression measures how the new base affects
pay-ments compared to how the current program operates in that regard. A value of 1.0 for this term simply indicates that the future program payment rate per unit of base will be the same as under the current program.
Degree of linkage = ∑t (1 + r)−
t (Prob G
t)(E(Rt/ Rn) ) ( Prob Ut)E
(dBt/dAn)E( (dRt/dBt)/(dRn/dBn)). (5)
Consider a simplified example to fix ideas about the magnitude of this link-age starting with the probability of an update. A farmer believes that if an update happens at all it will occur 5 years in the future. He assigns a probability of 0.6 to this event ( Prob U5 = 0.6) and a zero to the probability
of an update in other years. This simplifies the present value calculation and allows us to ignore other years in the probability calculations. Using a discount rate of 0.10, the present value of income five years hence is 0.62 (a discount rate of 5 per cent yields a discount factor of 0.78 and a discount rate of 15 per cent yields a discount factor of 0.5). Now assume the farmer places a probability ( Prob Gt) of 0.9 on the program remaining in its
cur-rent form and an expected value of 0.9 for the payment rate 5 years hence relative to the current payment rate (E(Rt/Rn) ). The farmer also thinks that
there is a 90 per cent chance that, conditional on an update occurring, offi-cials will use a 5-year moving average for the update and that the new base will be used for 5 years. Under this scenario, the full value of the added base will be used in the update so E(dBt/dAn) = 0.9. This factor is
important because how much a specific year’s acreage decision affects the future base is unclear, even if a farmer were confident that updating were likely. Note that for the update in the FSRIA, only the most recent 4 years were used so the contribution of area planted in year t-5 (1997) to the base in 2002 was zero. Furthermore, the yield update used a scaling factor of 0.935, which reduced the value of recent yield in an update. Next assume
Implications of US Farm Bill 113 that the farmer believes that the same relationship between base and pay-ments will be in place in year t as exists now, so this ratio is 1.0. Multiply-ing these factors yields the followMultiply-ing calculation: Degree of linkage = (0.62)(0.9)(0.9)(0.6)(0.9)(1.0) = 0.27.
Under this simplified case, with numbers that are not unrealistic, we find that updated payments are 27 per cent as much linked to current produc-tion as payments that are directly condiproduc-tional on current producproduc-tion (such as the LDP). That is, if the farmer increased area planted this year, the expected present value of payments that will be made 5 years from now is increased, when there is a chance that base will be updated. Different growers have different expectations and thus different values for each of the components that comprise this calculation. For example, if a farmer uses a discount rate of 0.05 the resulting degree of linkage is 0.34 and if the farmer uses a discount rate of 0.15 the resulting degree of linkage is 0.22.
Of course, some farmers had positive expectations of an update before 2002. The supply response to the update in the FSRIA relative to an increase in a fully coupled payment is equal to the degree of linkage times the change in the probability of future updates caused by the FSRIA.
Finally, conservation provisions must be considered in determining the production and price effects of the new law. Most importantly, the FSRIA authorises an additional 3 million acres of cropland to be idled gradually under the CRP and loosens eligibility for land to enter the CRP based on wildlife habitat. Much of this land will be removed from program crop acres, especially wheat and feed grains. Based on the 15-year history of the program, a reasonable guess is that one or two million acres of additional program cropland will be taken out of production from this action alone. This is a significant effect that would by itself raise crop prices slightly.
The new Conservation Security Program provides payments to farmers and thus will increase revenue per acre. This additional revenue will increase crop supply marginally unless offset by a change in practices that reduces crop yields. All commodities are eligible for this new program including livestock farms. However the amount of funding is small, amounting to about 0.1 per cent of farm revenue. Thus any supply effects that exist in the-ory are almost surely tiny in practice.
Based on simple simulations and preliminary work reported by the Food and Agricultural Policy Research Institute (FAPRI) and underway at USDA, the effects on market prices of the FSRIA, compared to the FAIR Act, including the ad hoc MLA payments, may be summarised briefly. More detailed results await more complete simulations and more informa-tion about implementainforma-tion. Here, I will suggest impacts for the middle of the implementation period, say 2004. It is also reasonable to consider the dynamics of these impacts, as the loan rates and target prices are fixed
114 D.A. Sumner
and most models and analysts project gradually increasing crop prices in the out-years of the law. Also, the production effects will be smaller for 2002 as the crops were mainly planted before the new law was signed, although some farmers increased plantings in anticipation of the changes.
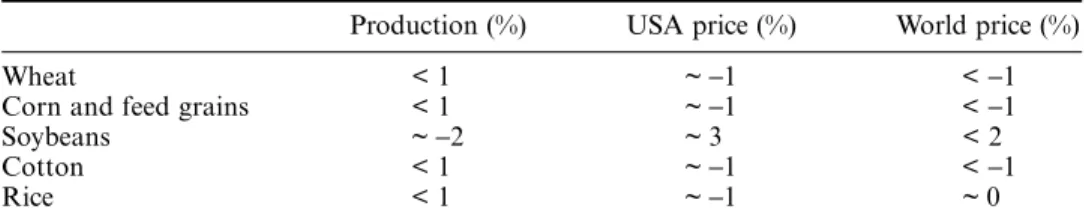
Production of wheat and corn in the USA are both likely to be slightly higher under the new law (FAPRI (2002), using their cross-commodity simulation model, estimates about 1 per cent higher production compared to the FAIR Act with no ad hoc payments). The net overall supply impact results from a balance between all the factors listed in the discussion of equation (4) relative to the additional acreage withdrawn under the CRP. Table 3 summarizes approximate effects.
The main reason for higher planted area of wheat and feed grains is the adjust-ment of the loan rate relative to soybeans. Higher production implies market prices for these crops will be slightly lower than would have occurred under the FAIR Act. The world price effect is likely to be especially small for wheat, given the small share of the USA in world wheat markets and the long run nature of the estimates of supply impacts, which allow for full adjustments on the markets. Production of soybeans is likely to fall slightly as fully coupled loan payments are reduced and the partially decoupled direct payments are added. Prices of soybeans and soybean products may be slightly higher than under the old law, but note, this suggests only a slight readjustment after a large increase in soybean production and far lower prices in recent years. The pro-duction for cotton and rice are likely to be slightly higher due in part to the update of bases and yields and the anticipation of future base adjustments. The best summary of these impacts is that they are small relative to the devasta-tion to world markets that was predicted in the rhetoric accompanying this legislation. The impacts of the FSRIA will be very hard to isolate amid the normal flux of world markets (Sumner and Lee 2000).
6. The new dairy payment program
A major innovation in the FSRIA concerns a new dairy payment scheme. The Milk Income Loss Contract (MILC) Program contains a deficiency Table 3 Direct commodity market effects of the Farm Security and Rural Investment Act of 2002
Production (%) USA price (%) World price (%)
Wheat < 1 ~ −1 < −1
Corn and feed grains < 1 ~ −1 < −1
Soybeans ~ −2 ~ 3 < 2
Cotton < 1 ~ −1 < −1
Implications of US Farm Bill 115
payment that distributes payments likely to be equivalent to between 5 and 10 per cent of total milk revenue for fully eligible dairy farms. The effect of the MILC payments on the USA dairy situation depends on three related issues: the size of the payment, the effect of the payment on milk supply and the effect of any supply response on milk prices. Initially we must understand the basics of the program.
The MILC payment rate in any month depends on the regulated mini-mum price of fluid drinking milk in Boston in that month. The payment rate per 100 pounds (cwt.) of milk is
MILC payment = max[0, (0.45(#16.94 − Boston Class minimum wholesale fluid milk price) ].
Although the law specifies the Boston price, actually the payments are tied to national prices for manufactured milk prices because the Federal Milk Marketing Order system sets the Boston Class 1 price to be equal to a base price that depends directly on movements in manufactured milk product prices plus #3.25 per cwt.
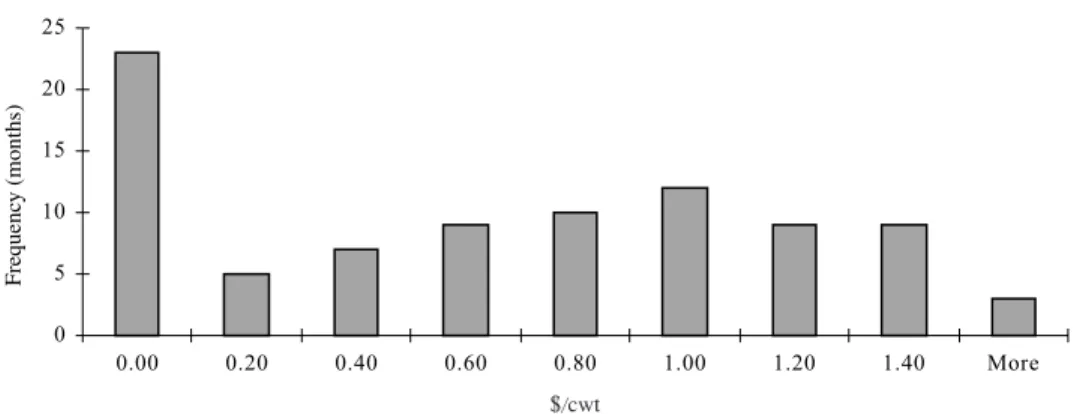
Figure 2 depicts a histogram of the monthly payment rate calculated as if it were in effect from July 1995 through September 2002. The payment rate would have been 0 in 23 of the 87 months considered and would have been
#1.00 or more in 28 of 87 months. Of course with a positive subsidy, the supply response would generate more milk and lower prices so this histo-gram underestimates the likely payments from the new prohisto-gram.
The production subsidy element depends on an additional feature of the law. Payments are limited to a maximum of 2.4 million pounds per operation in a year. This limit affects few producers in the New England region and a Figure 2 MILC payments based on historical data, 7/1995–9/2002. Payment calculated as max [0, 0.45* (#16.94 – Boston Class 1 Price ) ]
116 D.A. Sumner
minority of producers in the Upper Midwest. But, almost all producers in the West will find their payments limited to the maximum. Consider two cases: ‘small’ producers, for whom the 2.4 million pounds per year limit is more than annual production and ‘large’ producers, for whom the limit is certain to bind.
In Figure 3, Ssmall represents milk supply from all ‘small’ producers. Slarge
represents milk supply from all ‘large’ producers (Slarge is everywhere lower
than Ssmall, indicating lower marginal cost of production on large farms); D
is aggregate milk demand. In the absence of the MILC, aggregate supply is found as the horizontal sum of Ssmall and Slarge, and is denoted as Stotal,0. The
equilibrium price is P0, so that the quantity supplied from small producers
is Qsmall,0, and the quantity supplied from large producers is Qlarge,0. Total
quantity supplied is Qtotal,0.
Now (in order to save space) reconsider Figure 3 as applying to individual farms. The policy sets price TP for units up to QLIMIT per farm. For the small
producers, QLIMIT is non-binding; TP becomes the marginal price for small
producers, fixing the quantity supplied from these producers at Qsmall,1. For
large producers, QLIMIT is infra-marginal.
Under these conditions, aggregate supply (the horizontal sum of the indi-vidual farm supplies of each type) can now be found by shifting Stotal to the right
by quantity Qsmall (TP) − Qsmall(P), resulting in aggregate supply Stotal,1. The new
equilibrium price is P1, lower than P0. As the market price is the large
pro-ducers’ marginal price, supply from large producers is reduced to Qlarge,1.
Implications of US Farm Bill 117
Table 4 presents average annual milk production per farm for the USA, Vermont, Wisconsin and California. Annual average production per farm for Vermont and Wisconsin is well below the 2.4 million pound limit on MILC payments. Thus, even if the payments were made in all 12 months in a year, the average farms in Vermont and Wisconsin would fit the ‘small’ farm case described above and would increase production in response to the MILC payment. Average annual production per farm in California is more than 15 million pounds per year. Thus, even if the payment were active in only 3 months of the year (ignoring seasonality in production, dividing by 12), the average farm in California would fit the ‘large’ farm case described.
For the larger farms producing about 70 per cent of the milk in the USA, the program is equivalent to a lump sum infra-marginal payment where the size of the payment is inversely related to the price of milk. It is not yet clear how this program will be treated in WTO notifications, but it is likely that the whole amount will be considered product specific amber box pay-ments that enter the AMS.
Putting these pieces together we get a 10 per cent per unit revenue increase for about 30 per cent of production. With a supply elasticity of 1.0 that suggests a direct supply effect of about 3 per cent with a smaller equilibrium impact and reduced production on the large farms. The USA price of milk will be down a few percentage points, but the implications for world markets is smaller because USA trade barriers for dairy products imply minor effects on imports or exports. One international implication is somewhat smaller quota rents for firms that shift dairy products to the USA under quota.
7. Implications of the FSRI act of 2002 for WTO compliance
The first major WTO issue relates to the color of the domestic support ‘box’ in which to place the various farm bill payments. When that question Table 4 Average milk production per dairy operation, 2001
USA California Vermont Wisconsin
Milk cows1 (head) 9115 1555 153 1292
Operations2 97 560 2157 1600 17 833
Cows/operation 93 721 95 72
Milk /cow/year1 (pounds) 18 139 20 913 17 431 17 182
Milk/farm/year (pounds) 1687 15 078 1656 1237
1From Milk Production, Disposition, and Income 2001 Summary.
2Wisconsin data from NASS-Wisconsin, California data from California Department of Food and
118 D.A. Sumner
is answered, the relevant question becomes, what can the USA do to meet its URAA commitments of keeping its AMS below #19.1 billion? (Becker 2002). Clearly the marketing loans remain in the AMS and because loan rates were raised for corn and wheat and lowered for soybeans this could raise or lower loan outlays and the contribution to the AMS. In any case the expected net effect is small. Note, however, with net increases in production and lower loan repayment rates, the contribution to the AMS can be larger for those reasons as well. The other major contribution to the AMS has been the dairy, sugar and peanut price supports. In addition, a new deficiency payment for dairy producers (about #1 billion per year) will add to the AMS. The new payment program for peanuts also adds to the AMS in this way. The impact so far seems to be a small net increase in the product specific AMS, depending on what the weather does to prices and hence the size of payments.
Next, turn to the direct payments for grains and cotton. The updating of area bases for the new direct payments has raised concerns that these pay-ments should belong in the WTO amber box. If the USA declares them in the ‘green box’ there would likely be WTO challenges. The USA argument is that some update was required because soybeans were added to the pro-gram and thus the updates only minimally distort production because farmers may still leave the land idle or plant a large variety of crops. The example cited found that with reasonable numbers the payments were about 80 per cent decoupled. It seems a close call to argue that the produc-tion effect of the expectaproduc-tion of future updates 6 or more years into the future has a large production distorting effect. But, this may be a case that requires litigation. Note in any case, if these payments (worth about #4 bil-lion per year) were considered ‘amber box’, they would be declared NPS and thus be ‘charged’ against the de minimis limit which is about #10 bil-lion. This would represent a large share of a rapidly filling box.
The new CCP raises even more concerns about the box they are likely to enter. These payments allow updating of both the base area and base yield and are calculated in relation to the current market price of a specific com-modity. Therefore, even though the land may be left idle or other crops may be planted, it may be hard for the USA to successfully argue that these pay-ments are in the green box. This is especially true given that the USA reported the MLA payment to be NPS amber. These payments are also likely to be in the range of #4 billion per year, so if they are NPS, that box is already overflowing (given crop insurance and a number of minor subsi-dies in that class). There is another argument, however, that even though the CCP are not tied explicitly to current planting, they are tied to a spe-cific crop price, and, with base updating, they are tied to lagged output of a specific crop. Therefore, they should be in the commodity-specific amber
Implications of US Farm Bill 119 category and be added directly to the AMS. This would mean that they would be charged against the #19.1 billion limit.
A final issue concerns the new Conservation Security Payments. As argued, these payments may be considered tied to production and likely to stimulate production. That view would suggest that these payments also belong in the amber box as NPS payments. But, of course, because they are listed as conservation program payments the USA may argue they belong in the green box. These payments are likely to be only about #200 million per year so they only have a marginal effect.
The product specific subsidy in the loan benefits and dairy payments and price supports may already get close to the #19.1 billion limit in high-output low-price years. That problem would be worse if the CCP were placed in that category. However, if the CCP are NPS and the direct payments are also placed in that category, the USA may easily exceed the approximate #10 billion ceiling that is available for de minimis NPS amber support. If that were the case, all this NPS support would be placed in the AMS, and the URAA limit would be easily exceeded. Thus the USA may have a delicate balancing act to report its various programs in the product-specific and NPS catego-ries in order to minimize the chance the #19.1 billion limit is exceeded.
My view is that there are probably WTO-acceptable ways to report the USA programs that would minimise the prospect of exceeding the limit. One way to reduce the current NPS subsidy reported is to shift some pay-ments or benefits (such as a part of crop insurance subsidy, some grazing fees and even a part of the CCP) into the product-specific category. For those commodities with less than 5 per cent support, this step would take those subsidies out of consideration and leave more room for the direct payments or perhaps the CCP to fit within the NPS de minimis. That idea would apply for crop insurance for fruits and for grazing fees. Of course, this approach may imply additional problems for the product-specific amber support that is now reported in the AMS. One way to reduce the product-specific amber subsidy is to adjust the way price support policies for sugar and dairy are operated. For these commodities the real support comes from the import barriers. But, because the AMS is calculated as a difference between the support price and the fixed world reference price, the AMS for dairy and sugar, in particular, is very large relative to the benefit received by producers. It would be relatively simple to compensate produc-ers with less than #1 billion for a shift in the price support policy and thus drop the USA AMS by about #4 billion (See Table 1).
Finally, remember that the ‘circuit-breaker’ provision mentioned requires the USDA to assure that WTO obligations are not exceeded. Thus, the USA can argue that the bill is designed to fit within the URAA limits, even if it does not fit within the spirit of reducing subsidies and protection. That
120 D.A. Sumner
said, there is little doubt that the 2002 Act will be subject to WTO challenges. The huge increase in USA farm subsidies over the past 4 years has raised concerns in many nations. Some of these concerns pre-date the FSRIA and these specific commodity claims may fare better than wholesale attacks on the new law.
8. Implications of the FSRI act of 2002 for WTO negotiations
More important than the compliance with the URAA are the effects of the FSRI Act of 2002 on the prospects for successful trade liberalisation in the current WTO negotiations and elsewhere.
The new Farm Bill will possibly have several implications for these negoti-ations. First, USA negotiators will now have less opportunity to agree to lower domestic supports in exchange for additional market opening or lower export subsidies. Particularly with the Congress watching the negoti-ations closely, it would be difficult for the negotiators to assure successful passage of implementation legislation if a new WTO agreement clearly forced rewriting of the farm program. (The USA elections in November 2002, which shifted the control of the USA Senate to Republicans, did not change this point significantly.) Second, some other countries now see the USA as a major source of distortion in world markets and will focus atten-tion on negotiating lower USA subsidies while devoting less effort to open-ing markets in places such as Korea, Japan or Europe. The Cairns group in particular, by focusing on the US Farm Bill rather than import barriers in the USA and other places may be focusing on the less important distor-tions. Policies such as USA, Canadian and EU dairy trade barriers are likely to face less pressure for reduction. Third, some countries, especially in the developing world, are more likely to accept that production-distorting farm subsidies are an essential part of agricultural policy and are more likely to adopt such policies. None of these implications make it easier to achieve more open world markets for agricultural trade.
A few comments collected in May by farm journalist Jim Wiesemeyer (2002) from around the world reinforce these points. China’s vice minister of trade Long Yongtu asked, ‘After the U.S. Congress adopted such a bill, why can we not do similar things?’ He said USA actions like the Farm Bill have already ‘had a negative impact on enforcement of China’s commitments to the WTO’. The Financial Times of London begins its editorial on May 29, 2002, ‘With its new, grotesque farm subsidies, the U.S. has let the European Union off the hook. Trade liberalization was supposed to be one of the dis-ciplines that would push the EU to reform its absurd Common Agricultural Policy. But having surrendered to protectionism, Washington is in no posi-tion to fight’. It later wrote, ‘Washington’s reversion to huge subsidies tied
Implications of US Farm Bill 121 to production removes … pressure [for reform of the CAP] and leaves the international campaign for agricultural reform with little hope’. The heads of the WTO, World Bank and the IMF, in a joint letter, wrote, ‘How can leaders in developing countries or in any capital argue for more open eco-nomies if leadership in this area is not forthcoming from wealthy nations?’. Despite these concerns, the core USA positions and strategy for the cur-rent WTO negotiations following the Doha agreement did not change. The USA negotiators have stated that they remain committed to reducing trade barriers and opening markets through the WTO negotiation, in the negoti-ations for free trade in the Americas, and elsewhere. In the July 2002 WTO proposal, the USA called for the elimination of export subsidies and rapid tariff cuts, especially for the highest tariffs. That proposal also called for cuts in trade distorting domestic support that would impose changes on USA programs and make it even harder for the FSRIA programs to fit under the WTO cap on domestic support. Notably this proposal garnered strong expressions of support from major USA farm organisations.
Nonetheless, behind this negotiating position is the realisation that the USA has enacted a farm bill that codifies large farm subsidies well into the future. Furthermore, much of USA agriculture and a large majority in Congress strongly supported these programs. Therefore, negotiators must devote effort not to opening markets, but to protecting USA farm pro-grams. Indeed, negotiators must defend USA farm programs rather than defend the long-term economic interests of USA farmers and especially the interests of the least subsidised farmers, (leaving aside the broader interests of USA taxpayers, consumers and the economy more generally).
A focus on domestic support rather than border measures by those inter-ested in using the WTO to reform farm trade policy seems unfortunate to me. I argue elsewhere that analysis and evidence shows that border meas-ures typically have stronger trade impacts (Sumner 2000). Unfortunately, among the most serious consequences of the FSRIA is that the informal coalition of the USA and the Cairns group may be impaired. The positive Australian response to the USA WTO proposal released in July 2002 sug-gests that the damage may not have been permanent, but it is real nonethe-less. Of course, certain agricultural interests welcome these implications. Those countries and commodity interests that want little agricultural market opening from the new WTO round, will welcome the weakened negotiating position of the USA.
The final implications are likely to be more delay in the current trade round, smaller tariff cuts, less TRQ reform, and fewer other reforms. Per-haps, ironically, these implications of the FSRIA for WTO negotiations seem far more important than the relatively small production, trade and price implications.
122 D.A. Sumner
References
Barnard, C., Nehring, R., Ryan, J. and Collender, R. 2001, ‘Higher cropland value from farm program payments: who gains?’, Agricultural Outlook USDA, Economic Research Service, November 2001.
Becker, G. 2002, ‘Farm support programs and world trade commitments’, USA Congressional Research Service Report, updated April 29, 2002.
FAPRI (Food and Agricultural Policy Research Institute). 2002, ‘Farm Security and Rural Investment Act of 2002: Preliminary FAPRI Analysis’. [Online]. Available: http:// www.fapri.missouri.edu/
Hennessy, D. 1998, ‘The production effects of agricultural income support policies under uncertainty’. American Journal of Agricultural Economics, vol. 80, pp. 46 –57.
Nelson, F.J. 2002, ‘Aligning U.S. Farm Policy With World Trade Commitments’, Agricultural Outlook, ERS, USDA, January–February.
Olmstead, A. and Sumner, D.A. In press, ‘Farm Policy’, in S. Carter, S. Gartner, M. Haines, A. Olmstead, R. Sutch, and G. Wright (eds), Historical Statistics of the United States-Millennial Edition, Cambridge University Press, Cambridge.
Orden, D. 2002, ‘Reform’s Stunted Crop’, Regulation, vol. 25, no. 1. REUTERS. 2002, ‘Chirac Slams US “Unilateralism” at Summit’, May 17.
Roberts, I. and Jotzo, F. 2001, 2002 U.S. Farm Bill: Support and Agricultural Trade. ABARE research Report 1.13, Canberra.
Sumner, D.A. 2000, ‘Domestic support and the WTO negotiations’, Australian Journal of Agricultural and Resource Economics, vol. 44, pp. 457– 474.
Sumner, D.A. and Lee, H. 2000, ‘Assessing the effects of the WTO Agreement on rice markets: what can we learn from the first five years’, American Journal of Agricultural Economics, vol. 82, pp. 709 –717.
Sumner, D.A. and Tangermann, S. 2002, ‘International Trade Policy and Negotiations’, in B. Gardner and G. Rausser (eds), Handbook of Agricultural Economics. North Holland Press Amsterdam, The Netherlands.
USDA (United States Department of Agriculture). 2002, [Online]. Available: ‘Farm Bill 2002’ http://www.usda.gov/farmbill
Wiesemeyer, J. 2002, ‘Farm Bill opponents still talking & squawking’. [Online]. Available: http://www.agweb.com /analysisdetail.asp?ltype=insidewashingtontoday
Young, C.E. and Westcott, P. 2000, ‘How Decoupled is U.S. Agricultural Support for Major Crops?’, American Journal of Agricultural Economics, vol. 82, pp. 762–767.