JURNAL INFOTEL
Informatics - Telecommunication - Electronics
Website Jurnal : http://ejournal.st3telkom.ac.id/index.php/infotel ISSN : 2085-3688; e-ISSN : 2460-0997
Maize Leaf Disease Image Classification Using
Bag of Features
Mohammad Syarief1, Novi Prastiti2, Wahyudi Setiawan3*
1,2,3Informatics Department, University of Trunojoyo Madura 1,2,3PO BOX 2 Kamal, Bangkalan, Indonesia
*Corresponding Email: [email protected] Received 13 April 2019, Revised 02 May 2019, Accepted 24 June 2019
Abstract — Image classification is an image grouping based on similarities features. The features extraction stage is a crucial factor for classifying an image. In the conventional image classification, the features commonly used are morphology, color, and texture with various derivative features. The type and number of appropriate features will affect the classification results. In this study, image classification by using the Bag of Features (BOF) method which can generate features automatically. It consists of 4 stages: feature point location by using grid method, feature extraction by using Speed Up Robust Feature (SURF), clustering word-visual vocabularies by using k-means, and classification by using Support Vector Machine (SVM). The classification data are maize leaf images from the PlantVillage-Dataset. The data consists of 3 types of images: RGB, grayscale, and segmentation images. Each type includes four classes: healthy, Cercospora, common rust, and northern leaf blight. There are 50 images for each class. We used two scenarios of testing for each type of data: training and validation, 70% and 80% images for training, and the rest for validation. Experimental results showed that the validation accuracies of RGB, grayscale, and segmentation images were 82%, 77%, and 85%.
Keywords – Bag of features; Classification; Maize leaf disease images; Speeded-up Robust Features, Support Vector Machine.
All rights reserved.
I. INTRODUCTION
Image classification is a grouping of images that have similar features. The conventional images classification requires a determination of features manually. Commonly used features are morphology, color, and texture with all derivative features. Morphology features include axis ratio, diameter, perimeter, complexity, rectangularity, and sphericity. Color features include mean, skewness, and kurtosis. Texture features include the Gray Level Co-Occurrence Matrix (GLCM) [1], [2], [3], [4]. Type and number of features affect the classification results.
The leaf image is one object to classify diseases. In this study, the classification of diseases on maize leaves was carried out. Several studies using maize leaf, including Al Hiary et al. classified images of 16 types of food crops including maize. The classification was carried out to detect six disease classes. These classes were early scorch, cottony mold, as mold, late scorch, and normal. Image
processing applied to the research were preprocessing to convert RGB images to green channels, segmentation using thresholds, Gray Level Co-occurrence Matrix (GLCM) for feature extraction, and classification using the Backpropagation Neural Network method. The results showed the classification accuracy rate up to 94.67% [5]
.
Cao et al. conducted maize disease detection based on six classes: maize big spot disease, small maize spot disease, maize gray spot disease, maize curvularia lunata, maize circle spot disease, and maize brown spot disease. The image size used for the testing process was 148x256 pixels. The Backpropagation Neural Network method was used as the Classification method. Stages of the classification process were preprocessing, threshold segmentation, and feature extraction. The feature extraction was performed based on area, perimeter, circular degree and position of gravity. The Accuracy results showed a percentage of up to 88.2% [6].
ISSN : 2085-3688; e-ISSN : 2460-0997
Maize Leaf Disease Image Classification Using Bag of Features
49 Jurnal Infotel Vol.11 No.2 May 2019
https://doi.org/10.20895/infotel.v11i2.428 Alehegn classified the maize diseases into four
classes: common rust, leaf blight, healthy leaf, and leaf spot. The testing data is 800 images with 200 images of each class. The test results showed that the average level of accuracy is 94.4% [7].
Mohanty et al. Classified 14 types of food crops, including maize. Disease classes consist of 26 classes. The testing used images in vast numbers, i.e., 54,306 images. Deep Learning Conventional Neural Network (CNN) used for classification while the CNN architecture was AlexNet and GoogleNet. The classification results showed an accuracy of 31.4% [8].
Aravin et al. performed the classification of maize plant diseases with Bag-Features and Support Vector Machine. The classes consist of 4 categories, namely Cercospora, common rust, northern blight leaf, and healthy leaf. The testing results of the BOF and the statistical feature extraction method produced an accuracy of 83.7% and 81.3%, respectively [9]. Research [5-7] still uses manual feature extraction, research [8] obtained low accuracy, and research [9] has the opportunity to increase accuracy.
In this study, classification was carried out on maize leaf images. The images consist of 4 classes: normal, downy mildew, leaf blight, and leaf rust. The novelty of this research is classification using Bag-of-Feature consisting of 4 stages: divide image with grid method, feature extraction using Speeded-Up Robust Features (SURF), clustering word visual vocabulary by using k-Means and Classification by using Support Vector Machine.
II. RESEARCH METHOD
Bag-of-Feature Method (BOF) is a collection of features contained in an image. For example, in the human face image, the features consist of ears, nose, mouth, hair, chin, earrings, background color, and so on.
In the image of maize leaves, features can be leaves, leaf bones, leaf color, disease, background color, etc. BOF does not need to define the features. It can instantly recognize automatically through the features contained in an image.
Generally, BOF consists of 3 stages, i.e., feature extraction, word vocabulary clustering, and BOF feature construction, by checking the number of features existing in each cluster. The application of the BOF method has been used for medical images [10], [11], satellite images [12], [13], and images for agricultural purposes [14], [15].
A. Feature Extraction Using SURF
SURF is a feature detection method that was first made by Bay et al. in Zurich [16]. SURF emphasizes noise reduction, quick calculation, and in-plane rotation invariant. SURF procedures can be divided into three parts:
1. Interest point detection 2. Interest point description 3. Interest point matching a) Interest Point Detection
Interest point is the best point of an image containing much information and is stable against interferences. The detector used to detect interest points is blob detection. A blob is a region in the image having constant values or variation of specific values. Blob detection is used to determine the Hessian matrix determinant of an image [17]–[19]. For an identified image I, there is the Hessian matrix H (x, σ) = at x with the scale σ shown in equation 1,
( , ) = ( , )( , ) ( , )( , ) (1)
with ( , ) is a convolution of the second Gaussian derivative ( ) in the image I at point . This also applies to ( , ) and
( , ).
Determinants of the Hessian matrix use the Haar wavelet function [20], [21]. The Hessian matrix determinant has an invariant nature of scale, a stable algorithm, and a good loop.
When the image has a different size, the comparison of image features will be difficult. One of the solutions is by using a scale comparison method. The operation executed on the image is smoothing operation with Gaussian and then followed by sub-sampling which is performed from the lowest to the highest level of the pyramid. Filters used in this method can be a matrix of different sizes. [22].
b) Interest Point Description
The feature description is observing the dominant orientation of the image interest point. The next step is to comparing interest points with the related features in the comparison image by using Haar wavelet. Feature descriptions in the Haar wavelet use gradient histogram in four groups as shown in Equation 2,
= ∑ , ∑ , ∑| |, ∑ (2)
with is haar wavelet horizontal response, and is a haar wavelet vertical response.
c) Interest Point Matching
At this stage, the comparison of the results of the calculation process has been made. If there is a difference, it will be indicated by the Hessian trace matrix.
ISSN : 2085-3688; e-ISSN : 2460-0997
Maize Leaf Disease Image Classification Using Bag of Features
B. Word Visual Vocabulary Clustering Using K-Means
Word vocabulary is a term to display all words that appear in text classification. This is the same as applied to an image that shows all possible features. Clustering is needed to group similar features. Clustering uses the k-means method.
K-means clustering works iteratively until it reaches a stable class condition. With k-means clustering, the features can be reduced by only using 80% of the features that have existed through the previous process [23].
C. Support Vector Machine
Support Vector Machine (SVM) determines the best hyperplane that separates data between classes. The best hyperplane is the most significant margin between classes. Distance is measured from the outermost data points of each class. In Fig.1, an illustration of SVM is shown.
Fig.1. Support Vector Machine [24] D. Experimental Data
This study uses the data standards of maize leaves from PlantVillage-Dataseta. PlantVillage is an online collection of data and information about more than 200 agricultural plants. The data consists of 3 types: RGB, grayscale, and segmented images. Each type includes four disease classes: healthy, Cercospora, common rust, and northern leaf blight. There are 50 images for each class. Fig.2 shows the visualization of pests and diseases.
Fig.2. Maize Leaf Image Classes: (a) Healthy, (b) Cercospora, (c) Common Rust, and (d) Northern Leaf Blight. E. Maize Diseases
a) Cercospora
Cercospora is the most often disease found in maize plants. Cercospora attacks maize plants aged 1 to 2 weeks. Symptoms of Cercospora on maize leaves appear as the increasing of the chlorotic, which is parallel to the leaf bone. This disease also attacks the whole maize plant so it
cannot produce fruit. If it produces fruits, they have poor quality and inconsumable. Cercospora is caused by Peronosclerospora maydis and Peronosclerospora philippinensis fungi [25].
ISSN : 2085-3688; e-ISSN : 2460-0997
Maize Leaf Disease Image Classification Using Bag of Features
51 Jurnal Infotel Vol.11 No.2 May 2019
https://doi.org/10.20895/infotel.v11i2.428 b) Common rust
Common rust is caused by Helmithosporium turcicum. The initial symptoms of Common rust are small patches, which then develop elongated and elliptical. Hawar has a length of 2.5 to 15 cm. if common rust is not treated as soon as possible, the plants will die [25].
c) Northern leaf blight
Northern leaf blight is caused by Puccinia polysora. Northern leaf blight symptoms are similar to hawar, but the causes are different. Initially, the Northern leaf blight is small and round in size. The symptoms are found in the upper and lower maize leaves. The disease spreads through wind and can occur throughout the season [25].
III. RESULT
In this study, the Bag of Feature algorithm was constructed as follows:
1. Initialize the number and name of the category or class. Split the data into two groups for each category; 35 images for training and 15 images for validation.
2. Select feature points locations using the Grid method by dividing the image into several equal parts. The Grid size is [8 8], and the block width size is [32 64 96 128].
3. Extracting the features of training images for each category produce 143,360 features per category. The number of features for all categories were 4 x 143,360 = 458,752 features. Feature extraction by using the SURF method. Choose the best 80% features for each category. The remaining features are 367,001
4. Use K-mean clustering to create 500-word visual vocabularies of the image. Determine the cluster center. Perform iteration 12 times, out of its maximum 100 iterations.
5. Classification by using Support Vector Machine. The BOF stages are shown in Fig.3.
The testing images were divided into three different maize leaf image groups: RGB, grayscale, and segmented images. Each scenario consists of 200 images with four categories. There were 50 images for each category. Tables 1, 2, and 3 show the testing results for color RGB images, grayscale images, and segmentation images respectively with training data 70%. Tables 4, 5, and 6 with training data 80%.
Fig.3. BOF Stages
IV. DISCUSSION
We used two scenarios of testing for each type of data: training and validation. The first scenario uses 140 images for training and the rest (60 images) for validation. The validation accuracies for each scenario were 82%, 77%, and 85%. The testing results showed that the segmented image scenario had the best accuracies for the validation stage.
The second scenario is 160 images for training and the rest (40 images) for validation. The validation accuracies for each scenario were 85%, 83%, and 78%. The testing results showed that the RGB image scenario had the best accuracies for the validation stage.
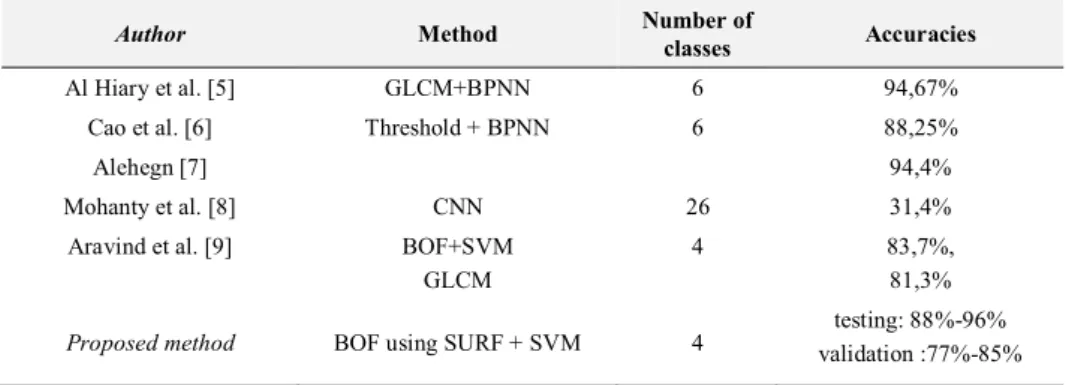
The testing results from this work are then compared with previous works to measure the testing success level according to the method. A comparison of the accuracy of the testing results is found in Table 7. For the training stages, the accuracies achieved were relatively high, up to 96%, while the validation accuracies were less compared to previous studies. This could be improved by increasing the amount of training data so that the learning process could be more extensive.
ISSN : 2085-3688; e-ISSN : 2460-0997
Maize Leaf Disease Image Classification Using Bag of Features
Table 1. Testing Results for RGB Scenario (70% Training Data)
Image types Testing Validation detected as detected as Cercospora common rust healthy Northern
leaf blight Cercospora
common rust healthy Northern leaf blight Cercospora 91 0 3 6 80 0 13 7 common rust 0 100 0 0 0 100 0 0 healthy 0 0 100 0 7 0 87 7 northern leaf blight 3 0 3 94 20 0 20 60
Training accuracy: 96% Validation accuracy: 82%
Table 2. Testing Results for Grayscale Scenario (70% Training Data)
Image types Testing Validation detected as detected as Cercospora common rust healthy Northern
leaf blight Cercospora
common rust healthy Northern leaf blight Cercospora 83 0 9 9 67 0 0 33 common rust 0 100 0 0 0 100 0 0 healthy 0 0 100 3 13 0 87 0 northern leaf blight 11 0 3 86 13 0 33 53
Testing accuracy:92% Validation accuracy: 77%
Table 3. Testing Results for Segmented Images Scenario (70% Training Data)
Image types Testing Validation detected as detected as Cercospora common rust healthy Northern
leaf blight Cercospora
common rust healthy Northern leaf blight Cercospora 89 3 0 9 87 0 13 0 common rust 0 100 0 0 0 100 0 0 healthy 0 0 100 0 0 0 100 0 northern leaf blight 20 60 11 63 27 13 7 3
Testing accuracy: 88% Validation accuracy: 85%
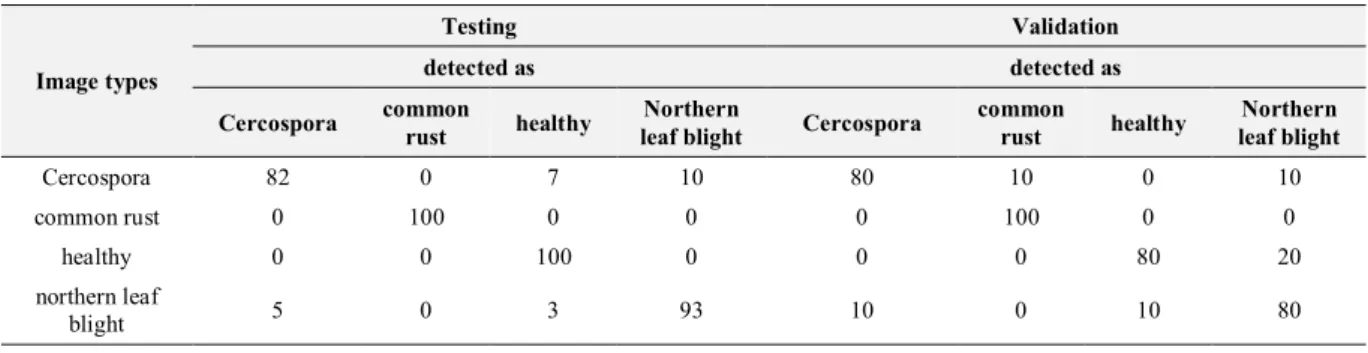
Table 4: Testing Results for RGB Scenario (80% Training Data)
Image types
Testing Validation
detected as detected as
Cercospora common rust healthy leaf blight Northern Cercospora common rust healthy leaf blight Northern
Cercospora 82 0 7 10 80 10 0 10
common rust 0 100 0 0 0 100 0 0
healthy 0 0 100 0 0 0 80 20
northern leaf
blight 5 0 3 93 10 0 10 80
ISSN : 2085-3688; e-ISSN : 2460-0997
Maize Leaf Disease Image Classification Using Bag of Features
53 Jurnal Infotel Vol.11 No.2 May 2019
https://doi.org/10.20895/infotel.v11i2.428 Table 5. Testing Results for Grayscale Scenario (80% Training Data)
Image types Testing Validation detected as detected as Cercospora common rust healthy Northern
leaf blight Cercospora
common rust healthy Northern leaf blight Cercospora 88 3 5 5 80 0 0 20 common rust 0 100 0 0 0 100 0 0 healthy 0 0 97 3 0 0 90 10 northern leaf blight 5 0 5 90 20 0 20 60
Testing accuracy:94% Validation accuracy: 83%
Table 6. Testing Results for Segmented Images Scenario (80% Training Data)
Image types testing Validation detected as detected as Cercospora common rust healthy Northern
leaf blight Cercospora
common rust healthy Northern leaf blight Cercospora 82 3 3 13 80 10 0 10 common rust 0 100 0 0 0 100 0 0 healthy 0 0 100 0 0 10 90 0 northern leaf blight 13 60 3 85 20 20 20 40
Testing accuracy: 92% Validation accuracy: 78%
Table 7. Comparison Between The Result of This Study and Other Studies
Author Method Number of
classes Accuracies
Al Hiary et al. [5] GLCM+BPNN 6 94,67%
Cao et al. [6] Threshold + BPNN 6 88,25%
Alehegn [7] 94,4%
Mohanty et al. [8] CNN 26 31,4%
Aravind et al. [9] BOF+SVM
GLCM
4 83,7%,
81,3%
Proposed method BOF using SURF + SVM 4 validation :77%-85% testing: 88%-96%
V. CONCLUSION
In this article, the image classification of leaves on maize plants has been carried out using the Bag-Of-Feature method. This method consists of feature extraction with SURF, clustering with k-Means, and classification using Support Vector Machine. This method is quite useful, with the accuracy up to 96% for the testing and 85% for the validation. To get better results, training can use more data or use deep learning methods for high classification speed and accuracy.
ACKNOWLEDGMENT
This article is the result of Penelitian Mandiri funded by the University of Trunojoyo Madura. We want to thank Sharada Prasanna Mohanty et al. for the permission of using PlantVilllage-Dataset as our data.
REFERENCES
[1] S. Arivazhagan, R. N. Shebiah, S. S. Nidhyanandhan, and L. Ganesan, “Fruit Recognition using Color and Texture Features Fruit Recognition using Color and Texture Features,” no. October 2010.
[2] S. Chatterjee, D. Dey, and S. Munshi, “Mathematical Morphology aided Shape, Texture and Colour Feature Extraction from Skin Lesion for Identification of Malignant Melanoma,” in International Conference on Condition Assessment Techniques in Electrical Systems (CATCON), 2015, pp. 200–203.
[3] C. Busch and M. Eberle, “Morphological Operations for Color – Coded Images.”
[4] N. Bagri and P. K. Johari, “A Comparative Study on Feature Extraction using Texture and Shape for Content-Based Image Retrieval,” Int. J. Adv.
ISSN : 2085-3688; e-ISSN : 2460-0997
Maize Leaf Disease Image Classification Using Bag of Features
Technol., vol. 80, pp. 41–52, 2015.
[5] H. Al Hiary, S. Bani Ahmad, M. Reyalat, M. Braik, and Z. ALRahamneh, “Fast and Accurate Detection and Classification of Plant Diseases,” Int. J. Comput. Appl., vol. 17, no. 1, pp. 31–38, 2011.
[6] L. Cao, X. San, Y. Zhao, and G. Chen, “Application of machine vision technology in the diagnosis of maize disease,” IFIP Adv. Inf. Commun. Technol., vol. 370 AICT, no. PART 3, pp. 188–194, 2012.
[7] E. Alehegn, “Maize Leaf Diseases Recognition and Classification Based on Imaging and Machine Learning Techniques,” 2017.
[8] S. P. Mohanty, D. Hughes, and M. Salathé, “Using Deep Learning for Image-Based Plant Disease Detection,” Front. Plant Sci., vol. 7, no. 10, pp. 1–7, 2016.
[9] K. R. Aravind, P. Raja, K. V Mukesh, R. Aniirudh, R. Ashiwin, and C. Szczepanski, “Bag of Features and Multiclass Support Vector Machine,” 2018 2nd Int. Conf. Inven. Syst. Control, no. Icisc, pp. 1191–1196, 2018.
[10] A. Foncubierta-Rodríguez, A. de Herrera, and H. Müller, “Medical image retrieval using bag of meaningful visual words: unsupervised visual vocabulary pruning with PLSA,” Proc. 1st ACM Int. Work. Multimed. Index. Inf. Retr. Healthc., pp. 75–82, 2013.
[11] M. R. Zare, W. C. Seng, and A. Mueen, “Automatic classification of medical X-ray images,” Malaysian J. Comput. Sci., vol. 26, no. 1, pp. 9–22, 2013.
[12] Y. Hu, Z. Li, P. Li, Y. Ding and Y. Liu, “Accurate and Fast Building Detection Using Binary Bag-of-Features,” ISPRS - Int. Arch. Photogramm. Remote Sens. Spat. Inf. Sci., vol. XLII-1/W1, no. June, pp. 613–617, 2017. [13] L. Weizman and J. Goldberger, “Detection of
Urban Zones in Satellite Images using Visual Words,” IGARSS 2008 - 2008 IEEE Int. Geosci. Remote Sens. Symp., pp. V-160-V–163, 2008. [14] D. Q. Xiao, J. Z. Feng, T. Y. Lin, C. H. Pang,
and Y. W. Ye, “Classification and recognition
scheme for vegetable pests based on the BOF-SVM model,” Int. J. Agric. Biol. Eng., vol. 11, no. 3, pp. 190–196, 2018.
[15] K. Venugoban and A. Ramanan, “Image Classification of Paddy Field Insect Pests Using Gradient-Based Features,” Int. J. Mach. Learn. Comput., vol. 4, no. 1, pp. 1–5, 2014.
[16] H. Bay, T. Tuytelaars, and L. Van Gool, “SURF: Speeded up robust features,” Lect. Notes Comput. Sci. (including Subser. Lect. Notes Artif. Intell. Lect. Notes Bioinformatics), vol. 3951 LNCS, pp. 404–417, 2006.
[17] M. Zhang and R. Askin, “Small Blob Detection in Medical Images,” no. May, 2015.
[18] A. Ming and H. Ma, “A blob detector in color images,” Proc. 6th ACM Int. Conf. Image video Retr. - CIVR ’07, pp. 364–370, 2007.
[19] R. Lakemond, C. Fookes, and S. Sridharan, “Affine adaptation of local image features using the Hessian matrix,” 6th IEEE Int. Conf. Adv. Video Signal Based Surveillance, AVSS, 2009, no. September, pp. 496–501, 2009.
[20] D.-C. Cheng, “Haar Wavelet Analysis Haar Wavelets,” pp. 1–17, 2011.
[21] L. February, “Chapter 1 Overview,” 2010. [22] S. Ehsan, A. F. Clark, N. ur Rehman, and K. D.
McDonald-Maier, “Integral images: Efficient algorithms for their computation and storage in resource-constrained embedded vision systems,” Sensors (Switzerland), vol. 15, no. 7, pp. 16804– 16830, 2015.
[23] K. S. Sujatha, G. M. Karthiga, and B. Vinod, “Evaluation of Bag of Visual Words for Category Level Object Recognition,” Int. J. Electron. Signals Syst., vol. 1, no. 4, pp. 104– 110, 2012.
[24] A. Kowalczyk, Support Vector Machine. Morrisville, North Carolina: syncfusion, 2017. [25] Burhanuddin, “Preferensi Penyakit Karat Daun (
Puccinia Polysora Undrew ) Pada Tanaman Jagung,” Pros. Semin. Nas. Serelia, pp. 395–405, 2015.